Abstract
Genetic sequence and hyper-methylation profile information from the promoter regions of tumor suppressor genes are important for cancer disease investigation. Since hyper-methylated DNA (hm-DNA) is typically present in ultra-low concentrations in biological samples, such as stool, urine, and saliva, sample enrichment and amplification is typically required before detection. We present a rapid microfluidic solid phase extraction (μSPE) system for the capture and elution of low concentrations of hm-DNA (≤1 ng ml−1), based on a protein-DNA capture surface, into small volumes using a passive microfluidic lab-on-a-chip platform. All assay steps have been qualitatively characterized using a real-time surface plasmon resonance (SPR) biosensor, and quantitatively characterized using fluorescence spectroscopy. The hm-DNA capture/elution process requires less than 5 min with an efficiency of 71% using a 25 μl elution volume and 92% efficiency using a 100 μl elution volume.
I. INTRODUCTION
The emerging field of epigenetics is primarily concerned with DNA modifications, such as DNA methylation, post-translational modifications of histone proteins, and chromatin remodeling, amongst others, without an actual change in the DNA sequence.1 Epigenetic assays are becoming increasingly important due to their potential for the early diagnosis of cancer, and new analysis tools have already increased the number of candidate oncogenes by the specific recognition of hyper-methylation patterns in the promoter regions of tumor suppressor genes.2 In particular high-throughput, small volume sample processing and analysis system will be important, which are ideally realized in microfluidic lab-on-a-chip (LOC) platforms. In particular, hyper-methylated DNA (hm-DNA) is characterized as the abnormal methylation of cystosine residues in CpG dinucleotides of normally non-methylated CpG islands in promotor sequences, and is associated with the transcriptional inactivation of tumor suppressor genes, thus it is critically important for epigenentic based assays.3 However, the amount of hm-DNA in typical samples is very small, e.g., 160 pg hm-DNA was recovered from human-genomic DNA using methyl-binding domain (MBD) protein enrichment and numerous PCR cycles,4,5 and hm-DNA has been reported to be present in concentrations less than 6 pM in 1 ml of homogenized stool.6 Therefore, hm-DNA enrichment is a necessary sample processing step for the analysis of biological samples such as stool, urine, saliva.7–9 Small volume LOC systems are well suited for processing small sample volumes, which is based on sample manipulation in microfluidic channels. LOC systems have been previously applied to clinical and molecular biology assays, where assay steps can be combined into a single miniaturized analytical system.10 Although microfluidic LOC systems have been applied extensively to DNA extraction, to the best of our knowledge they have not been previously reported for hm-DNA extraction and enrichment.
Conventional DNA extraction from silica-based resins have been reported to have extraction efficiencies around 70%–80%,11 and microfluidic solid phase extraction (μSPE) systems have been reported to have extraction efficiencies around 40%–50% from genomic samples.12–15 There have been many reports of μSPE DNA extraction.12–27 Previous reports describe DNA μSPE systems with integrated polymerase chain reaction21,22 and electrophoretic separation.23–25 Furthermore, DNA μSPE has been applied to forensics, where samples are typically very dilute.26,27 Recently, a hm-DNA analysis platform based on a temperature gradient microfluidic bisulfite assay was reported.28 MBD protein-based hm-DNA extraction is particularly promising as it facilitates both enrichment and purification of hm-DNA.6,28–30
In this article, we present a passive hm-DNA μSPE system, where the captured hm-DNA is eluted into a reduced sample volume, thus resulting in enrichment and purification. The μSPE system is comprised of a high surface area microfluidic chip that is functionalized with MBD proteins that serve as the capture agents. The capture and elution of hm-DNA from the MBD surfaces is based on modifying the electrostatic effects of binding through the variation of the ionic strength of the supporting buffer solution. The μSPE system is intended to process samples with low hm-DNA concentrations, in contrast to conventional hm-DNA enrichment systems that work best with more concentrated samples. The μSPE system is demonstrated with small hm-DNA concentrations (<1 ng ml−1), which results in an enrichment factor of 28× using a small 25 μl elution volume. The main advantages of the μSPE system compared to the conventional hm-DNA enrichment methods include: a small volume sample enrichment step, simple operation with a reduced number processing steps, and potential for high throughput sample analysis. The details of the microfluidic chip fabrication, surface functionalization schemes, and assay capture and elution characterization protocols are presented.
II. EXPERIMENTAL
A. Materials and chemicals
Amine functional monolayers are covalently attached to silicon dioxide (SiO2) surfaces using 3-amino propyl trimethoxy alkyl silane (APTES, Sigma Aldrich). Biotinylated surfaces are formed using a 10 mM biotin N-hydroxysuccinimide ester (NHS) (Thermo Scientific) in a phosphate buffered saline (PBS) solution. The MBD-Biotin protein (MBD2b protein conjugated to biotin, MethylMiner™ Kit, Life Technologies) is supplied in 0.5 mg ml−1 concentration and is diluted to 35 μg ml−1 for further use. Streptavidin (SA) (Life Technologies) is used for attachment to the biotinylated surfaces. The hm-DNA sample used for capture is 80 bp ds-DNA with eight symmetric 5-methyl-CpG islands, with sequence (methylated CpG dinucleotides are in bold): 5′-GCTATACAG GGMGTGTTAAMGATATAAMGTTTTGGCTMGACCAGTGACMGGACTCTMGTTCCTACCAGMGCAAMGCCCCC-3′ and 3′-CGATATGTCCCGMACAATTGMTATATTGMAAAACCGA GMTGGTCACTGGMCTGAGAGMAAGGA TGGTGGTCGMGTTGMGGGGG-5′ (Eurogentec).31 The non-hm DNA used as control is identical in sequence to the hm-DNA without the methylated cytosines. The non-hm-DNA sequence is as follows (non-methylated CpG dinucleotides are in bold): 5′-GGCCCGGCGGTCGCCACACCAATTCGTTACTCAGGGA CGTTACCACGGCTACTATCGTCGCAATTCAGTCAGGGATCTCG–3′ and 3′-CCGGGCCGCCAGCGGTGTGGTT AAGCAATGAGTCCCTGCAATGGTGC CGATGATAGCAGCGTTAAGTCAGTCCCTAGAGC–5′ (Eurogentec).31 The 160 mM NaCl incubation and wash buffers, MBD-Biotin proteins, and elution buffer (2 M NaCl) were used directly from the Methyl Miner Kit.31 Fluorescence imaging was done using two different fluorescent dyes: Alexa Flour 488 (AF488) conjugated directly to SA (SA-AF488) (Streptavidin, Alexa Fluor 488 conjugate, Life Technologies), and the PicoGreen intercalating dye (Quant-iT™ Technology, Life Technologies). The DNA and MBD-Biotin concentrations were measured prior to each experiment using a spectrophotometer (Nanodrop 2000c, Thermo Scientific). The surface plasmon resonance (SPR) imaging measurements were done using thiolated reagents conjugated to gold-coated sensor disks (SPRchip™, GWC Technologies). 11-mercapto-undecylamine (MUAM, Dojindo Molecular Technologies, Inc.) was used to form amine functional monolayers on the SPR sensor disk surfaces.
B. Surface functionalization
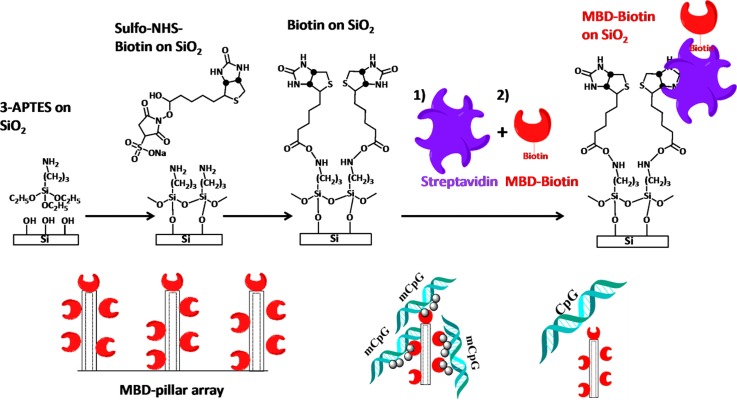
The MBD-biotin protein conjugation to SiO2 surfaces is shown in Scheme 1. Following immersion in a 2% APTES solution, the glass-silicon chip was washed with ethanol and heated at 120 °C for 15 min prior to further processing steps. The biotinylated surface was subsequently exposed to a 1 μM SA solution. The MBD-biotin protein is then attached to the available SA sites on the surface.
SCHEME 1.
Surface functionalization of MBD-biotin proteins to the SiO2 surface of the microchannel.
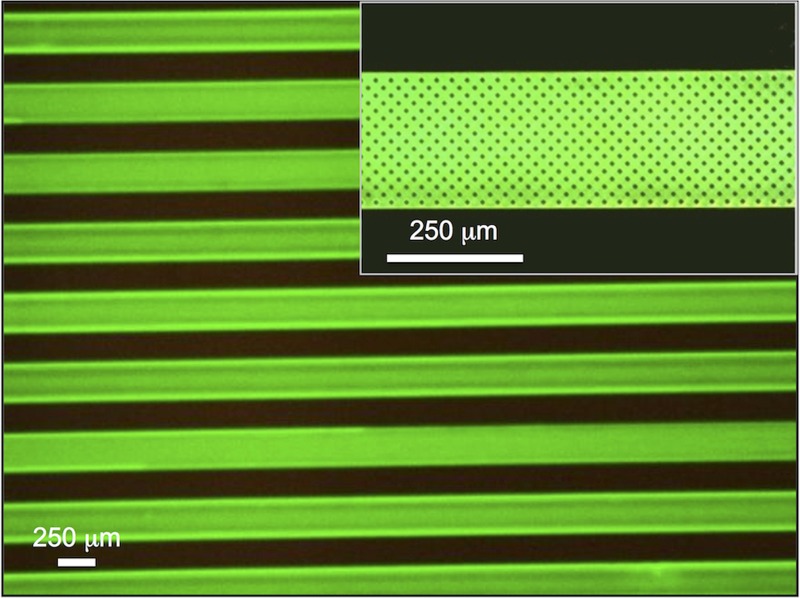
All surface functionalization steps were performed for 30 min by first flowing the sample in the microchannel and then stopping the flow and allowing incubation for 30 min. Fluorescence imaging with the AF488 dye is used to assess the surface coverage of the MBD-biotin functionalization in the microchannels, as shown in Figure 1, which demonstrates the attachment of the MBD protein to the biotinylated surface.
FIG. 1.
Fluorescence image (AF488) of MBD-biotin attachment to the SiO2 surface of the microfluidic channel. Inset shows a magnified view of the microfluidic channel.
C. Capture assay protocol and quantification
Following the preparation of the surface with MBD-biotin capture proteins, the microfluidic chip was used to extract hm-DNA from the sample solutions. An 80 bp non-hm-DNA, ds-DNA, is used as a control. Briefly, the hm-DNA in incubation/wash buffer is loaded into the microfluidic chip by flowing a 1 ml load volume through the microfluidic chip for 1 hr with a flow rate of Q = 18 μl min−1 (applied pressure: ΔP = 10 kPa). The microfluidic channels are then immediately washed with a 100 μl wash buffer, followed by a wash step with a 1 ml elution buffer with a flow rate of Q = 200 μl min−1 (ΔP = 100 kPa). For the small enrichment volume of 25 μl, the capture and elution flow rates are Q = 18 μl min−1. The capture and elution experiments were done using different DNA concentrations. The eluted DNA was de-salted with ethanol precipitation and re-suspended in 1 ml wash buffer and the concentration was quantified with a fluorescent assay (PicoGreen intercalating dye) and spectrometer (Perkin Elmer). A calibration curve was created and used for quantification of the capture/elution assay (Fig. S3, supplementary material).35 Using the calibration curve, the output hm-DNA concentration from the MBD-chip was quantified by dilution into a 2 ml volume.
D. Real-time assay monitoring
SPR imaging (SPRimager®II, GWC Technologies) is used to qualitatively assess to validate the overall capture and elution assay protocol, as well as to assess the specificity of the MBD protein for hm-DNA compared to non-hm-DNA. Prior to any surface functionalization, the SPR chips were cleaned in a fresh 3:7 piranha solution (H2SO4:H2O2) for 3 min, and subsequently incubated in a 5 mM ethanolic MUAM solution overnight (12 h) to form the MUAM monolayer on the gold surface. The MUAM treated SPR sensor disks were then treated with NHS for 30 min in 1× PBS buffer pH 7.4, followed by incubation with 1 μM SA, which is used to conjugate the MBD-biotin proteins to the SPR sensor disk surface. Scheme 2 shows the complete surface functionalization to the SPR sensor disk surface.
SCHEME 2.
Surface functionalization of MBD-biotin proteins on Au SPR sensor disks.
The formation of the MUAM-biotin-SA-biotin-MBD capture surface is done using a conventional procedure. Since the MBD-biotin protein availability is limited, the surface preparation and assay steps were performed in a microchannel to reduce reagent consumption.
E. Microfluidic chip design
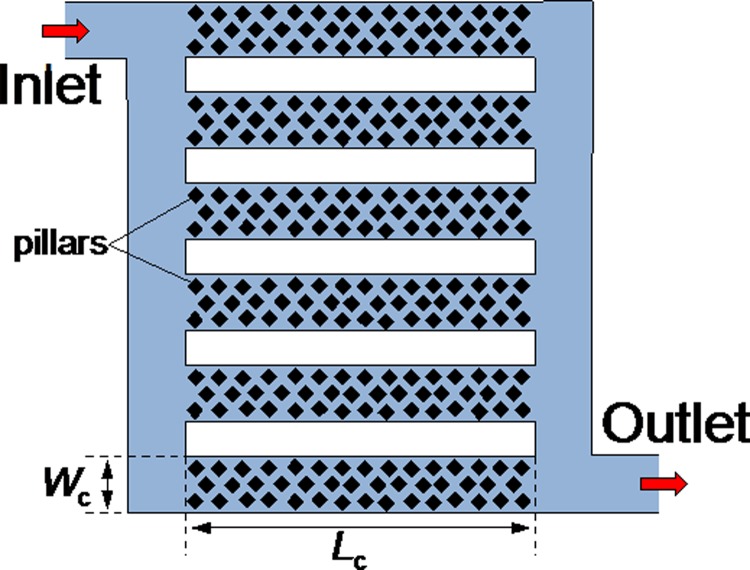
The capture of target hm-DNA from solution requires transport from the flow stream to the MDB protein capture moieties tethered to the surfaces of the microfluidic channels. Pressure driven fluid transport in microfluidic channels is laminar with a parabolic velocity profile across the channel cross-section and transport by diffusion is the dominant mechanism at the microchannel surfaces.32 Due to the parabolic velocity flow profile, the majority of the hm-DNA in the sample flow in the microchannel is not utilized because the interaction occurs only at the channel surfaces, where the flow velocity is small, and therefore, a balance of the diffusion-convection-reaction regimes is required. There are different ways to break the boundary condition of static flow on the microchannel walls, such as microparticles,19,20 sol-gels,11,19 and pillar structures.12,13 In this article, we use vertical pillar structures integrated into parallel microchannels to achieve the large capture surface area, as shown in Figure 2. The microfluidic μSPE system is implemented with 12 parallel microchannels, each with length Lc = 8.8 mm, width Wc = 0.25 mm, and height hc = 0.05 mm; each microchannel is packed with a two-dimensional array of vertical pillars. Square vertical pillars, 10 μm on a side, and spaced 10 μm apart, are integrated into the microfluidic channel. The pillar design is based on the need for high pillar density, for large surface area, while ensuring that the hydrodynamic resistance to fluid flow is not too large, which would require large applied pressures to achieve the desired flow rates for the assay. A three-dimensional finite element model was constructed and used to simulate (Multiphysics, Comsol, Inc.) the flow velocity in microchannels with different pillar orientations. A rotated pillar design was determined to facilitate a more efficient capture and elution process (Fig. S1, supplementary material).35
FIG. 2.
Schematic diagram of the microchannels of the μSPE LOC system.
F. Microfluidic chip fabrication
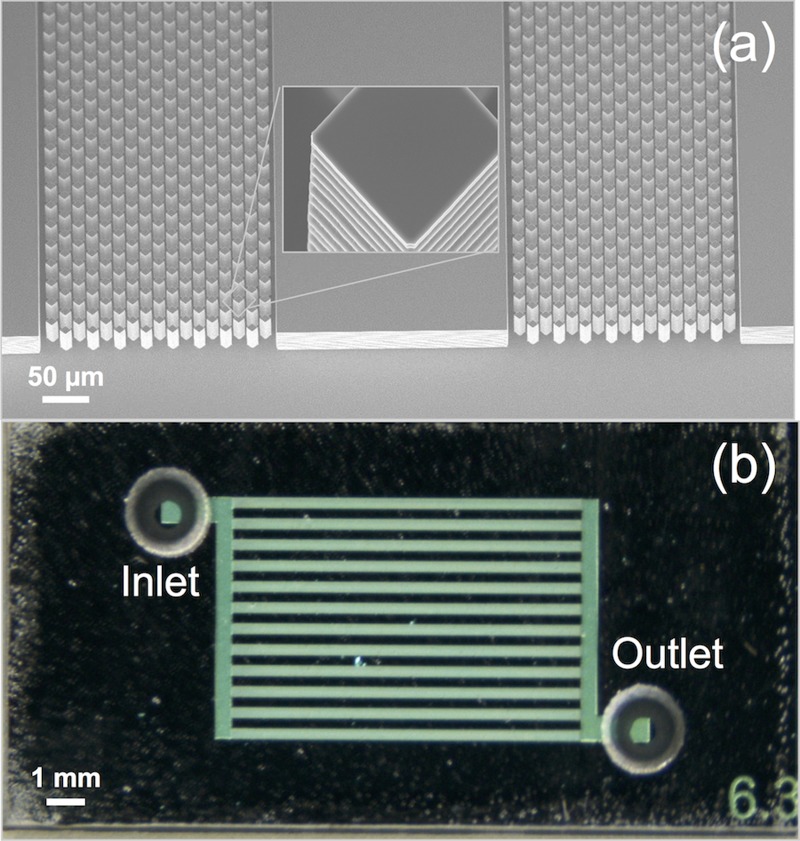
The microfluidic chip is comprised of a bonded glass-silicon structure that is implemented using conventional micromachining and anodic bonding microfabrication methods. The silicon layer is first processed where a 50 μm deep channel was first etched in a silicon substrate using deep reactive ion etching (AMS100-SE ICP, Adixen) to form the high aspect ratio pillar structures using a patterned photoresist layer (OIR 907-17, Arch Chemicals, Inc.). Following the cleaning step, a 300 nm thick SiO2 layer was reactively grown (1000 °C) on the silicon substrate. The thickness of the SiO2 layer is sufficient to avoid quenching of the fluorescent dyes. The inlet and outlet holes in the glass substrate are next microfabricated. A 1.1 mm thick glass wafer (Borofloat 33, Schott) is covered with a polymer foil (BF410, Ordyl) and subsequently exposed to UV light (EVG-620, EV Group) through a lithography mask to form the masking layer for the inlet and outlet holes. The exposed foil is then developed in a bicarbonate solution to form the inlet and outlet hole opening in the polymer foil. The exposed glass in the patterned mask is then removed using powder-blasting (29 μm diameter alumina particles), thus forming the through-wafer inlet and outlet ports. The remaining polymer foil is afterwards removed by sonication in deionized water. The silicon and glass wafers are aligned and anodically bonded (EV-501, EV Group). The bonded glass-silicon wafer is finally diced into 10 × 20 mm2 pieces (DAD-321, Wafer dicing saw, Disco Hi-Tec). The entire fabrication process for the glass-silicon MBD capture chip is shown in Figure S2 (supplementary material).35 Figure 3 shows images of the microfabricated chips. Figure 3(a) shows a scanning electron micrograph (SEM) image of the microchannel chip design etched in the silicon substrate. The inset in Figure 3(a) shows a single pillar with the scalloped pillar sidewall due to etch and passivation cycles of the Bosch etching process. Figure 3(b) shows an optical image of representative microfabricated glass-silicon chip with inlet and outlet holes aligned to the microchannels, which is used for sample inlet and waste outlet, respectively. Although we have used a silicon-glass microchip structure, which can be conveniently implemented in our research group, the entire microfluidic chip can be manufactured in low cost plastic, such as cyclic olefin copolymer (COC) or cyclic olefin polymer (COP), using injection molding since all feature sizes are 10 μm and greater.
FIG. 3.
Microfabricated LOC system. (a) SEM image of pillar array etched in the silicon substrate. (b) Optical image of glass-silicon bonded chips with inlet and outlet holes.
G. Assay test system
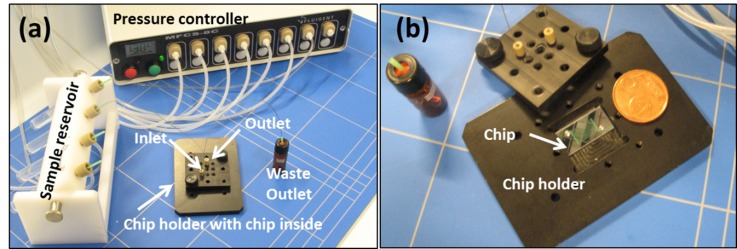
The diced chips are clamped into a custom-made chip holder. Poly-ether-ketone tubing (PEEK tubing, Upchurch Scientific) with 150 μm inside diameter is connected to the microfluidic chip with standard fittings (Nanoport, Upchurch Scientific). The sample fluids were transported through the PEEK tubing and microfluidic chip assembly using hydrostatic pressure from a regulated pressure source and controller (MFCS-8C, Fluigent). The capture of hm-DNA by the MBD proteins is performed by flowing 1 ml of hm-DNA (concentration < 1 ng ml−1) through the microchannel for 1 h (applied pressure drop: ΔP = 10 kPa), and followed by washing and elution. The elution step is performed at a higher flow rate Q = 200 μl min−1 (ΔP = 100 kPa) using a 1 ml elution volume. This was used for concentrations of DNA higher than 1 ng ml−1. For smaller enrichment volumes of 25 μl, both capture and elution flow rate is Q = 18 μl min−1 (ΔP = 10 kPa). A small enrichment volume was tested for concentrations of hm-DNA less than 1 ng ml−1. Figure 4 shows the MBD microchip assay test system.
FIG. 4.
Experimental setup for the MBD capture/elution microfluidic chip testing. (a) Complete test system. (b) Microfluidic chip mounted in chip holder.
III. RESULTS AND DISCUSSION
A. Real-time MBD assay monitoring
Each step of the MUAM-biotin-SA-biotin-MBD protein capture layer formation was monitored using real-time SPR measurements, and the major steps are depicted in Figure 5. The MBD-biotin protein treated SPR sensor disks are exposed to the hm-DNA and non-hm-DNA samples in the wash buffer and then subsequently treated with the elution protocol with the elution buffer (2 M NaCl). All sample handling, hm-DNA incubation, and washing steps are done in 1× wash buffer (160 mM NaCl) from the MethylMiner™ Kit, Life Technologies.
FIG. 5.

hm-DNA capture and elution protocol using a MBD capture surface.
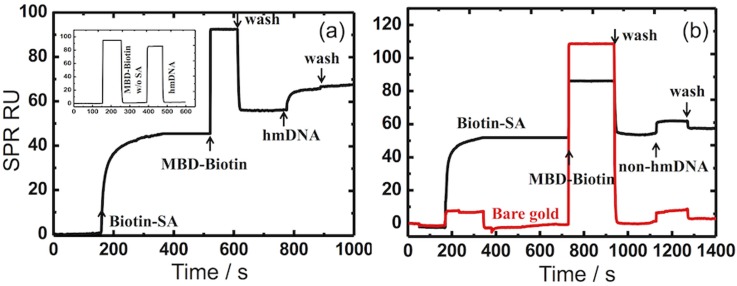
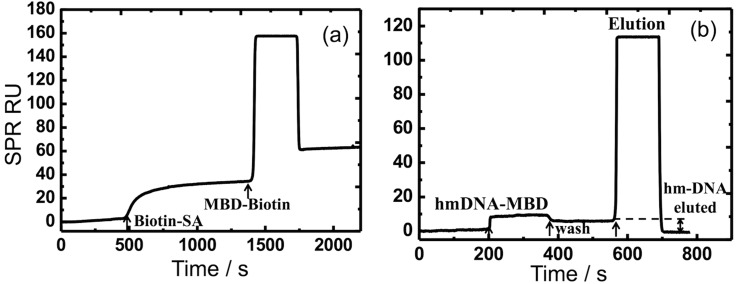
The real-time capture and elution sequences are demonstrated using the SPR experiments, shown in Figures 6 and 7. The real-time sensorgram trace is first recorded and demonstrates the conjugation of each component of the MUAM-biotin-SA-biotin-MBD complex.
FIG. 6.
Real-time SPR sensorgrams. (a) Monitoring the biotin-SA/MBD-biotin complex conjugation and subsequent binding of hm-DNA. (b) Selectivity of non-hm-DNA that is minimally hybridized with the MBD moiety. The measured signals are reported in the instrument RU.
FIG. 7.
Real-time SPR sensorgrams. (a) MBD protein attachment step. (b) hm-DNA capture and elution steps. The measured signals are recorded in the instrument RU.
In Figure 6(a), the MUAM treated gold SPR sensor disks are biotinylated with Biotin-NHS. Starting with a biotinylated gold surface, SA is introduced to the surface at t = 180 s, which saturates in about 150 s. The MBD protein is injected at t = 500 s and washed with buffer at t = 625 s. The baseline does not completely return to the starting level, as there is some binding of the MBD-biotin complex on the SA layer. The MBD protein is diluted from the commercial stock, and is not prepared by reconstituting dry protein with the same buffer used for SA and hm-DNA, which results in a bulk refractive index shift. The hm-DNA injection to the MBD protein capture surface starts at t = 800 s, thus giving rise to the association binding curve, and subsequently exhibits no dissociation when washed with buffer at t = 900 s. The top left inset in Figure 6(a) shows the response of a SPR sensor surface not treated with MBD proteins, and thus shows no binding response to the hm-DNA sample injection. Figure 6(b) shows the response of the capture surface to the injection of non-hm-DNA samples (solid black trace) and to bare gold surfaces (solid red trace). Biotin-SA binding is very strong and saturates the surface, as observed during the washing step at t = 350 s (solid black trace). The non-hm-DNA is injected on a MBD surface at t = 1150 s and most of the non-hm-DNA is removed with the wash buffer injection at t = 1300 s, however, the response indicates a larger than expected signal following the wash step and requires further investigation to determine if this is a function of the MBD protein or the gold surface. A bare gold surface, which is not biotinylated, does not bind any target, as shown in the red trace.
Figure 7 shows the capture and elution process of hm-DNA by the MUAM-biotin-SA-MBD surface during the assay protocol. Figure 7(a) shows the sensor response during the preparation of the gold surface with the MBD-biotin protein. In Figure 7(b), the elution process is demonstrated with a surface prepared with the MBD protein. The hm-DNA sample prepared in 1× wash buffer is injected at t = 200 s, followed by a wash step at t = 380 s. It is important to note that the starting response in Fig. 7(b) is lower than that shown in Fig. 6(a), which is due to baseline shift of the SPR instrument between different experiments. Despite this difference in baseline signal, the hm-DNA binding response in Fig. 7(b) at t = 200 s is of similar magnitude in response units (RUs) to the binding response of hm-DNA in Fig. 6(a) at t = 800 s. There is a small amount of dissociation in the wash buffer injected at t = 380 s, followed by the elution buffer injection at t = 580 s, where the baseline returns to the pre-injection response level after t = 700 s, thus confirming that captured hm-DNA has been removed. The elution process produces a large bulk refractive index change response due to the difference in the composition of the elution buffer and wash buffer.
B. MBD microfluidic chip assay
Table I lists the capture/elution results quantified using the complete assay protocol and fluorescence spectroscopy. The sample flow rate during the capture process is 18 μl min−1. A calibration plot of the fluorescence intensity as a function of hm-DNA concentrations was measured and used for all quantification experiments (Fig S3, supplementary material).35 For input concentrations less than 1 ng ml−1, the capture/elution assay performs with an efficiency of 89% (Table S1, supplementary material).35 The surface appears to saturate with concentrations above 100 ng ml−1.
TABLE I.
Measured average input and output capture/elution concentrations from the hm-DNA capture/elution assay with 1 ml elution volume (n = 3).
| Input concentration (ng ml−1) | Output concentration (ng ml−1) |
|---|---|
| 1 | 0.9 ± 0.01 |
| 123 | 4.0 ± 0.14 |
| 200 | 3.8 ± 0.14 |
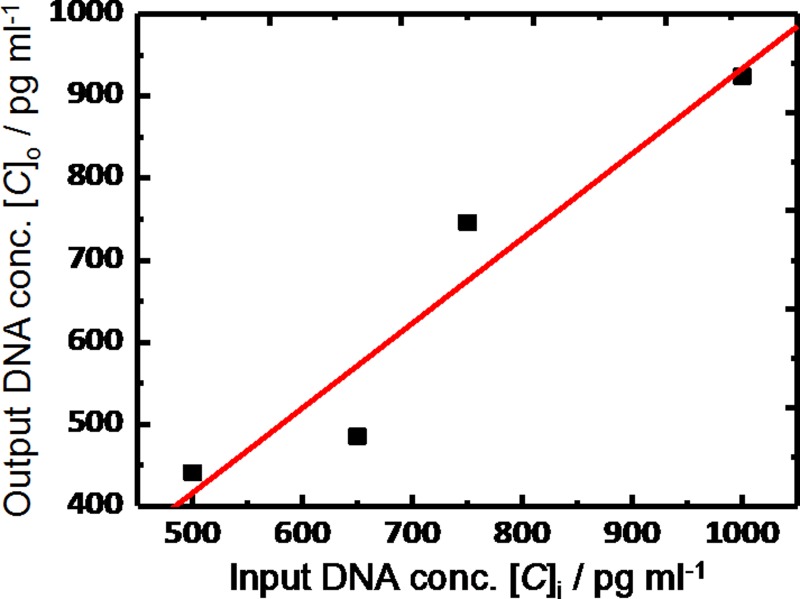
Considering that the capture surface area is approximately 1.7 cm2, the protein attachment density is approximately 3 × 10¹⁰ MBD-biotin molecules per cm2 (assuming 100% capture efficiency), which is reasonable considering the mass of the MBD protein.33 The assay results show a linear capture/elution relationship for concentrations less than 1 ng ml−1 (Figure 8).
FIG. 8.
hm-DNA capture and elution profile from MBD chip.
Table II lists a summary of the small volume hm-DNA elution results using the same assay with 1 ng ml−1 hm-DNA concentration. We used three different elution volumes, 25 μl, 50 μl, and 100 μl, followed by ethanol precipitation and quantification with the fluorescence assay.
TABLE II.
Summary of measurements from capture-elution MBD-chip-hm-DNA assay (n = 3).
| hm-DNA (ng ml−1) | Elution vol. (μl) | Eluted hm-DNA (ng ml−1) | Efficiency % |
|---|---|---|---|
| 1 | 25 | 28 ± 2 | 71 |
| 1 | 50 | 18 ± 5 | 90 |
| 1 | 100 | 9 ± 2 | 92 |
For elution volumes larger than 100 μl, the elution efficiency is improved, at the expense of a reduced enrichment factor. The elution efficiency is 71% using an elution volume of 25 μl. A 50 μl elution volume resulted in an increased efficiency of 90%, and increased only marginally to 92% using a 100 μl elution volume. A 28× enrichment of input hm-DNA with 1 ng ml−1 sample concentration was obtained for the lowest elution volume of 25 μl. The elution efficiency for the 100 μl elution volume is 92%, which is higher than the large volume 1 ml elution experiments (Table I). The large elution volume of 1 ml during post processing with ethanol precipitation could be the reason for loss of sample. MBD proteins can discriminate hm-DNA from non-hm-DNA, however, there is a larger than expected amount of non-specific attachment of the non-hm-DNA to the MBD modified surface, as previously confirmed qualitatively with SPR measurements (Figure 6). A control experiment with 1 ng ml−1 non-hm-DNA, in a 200 μl elution volume, resulted in a 32% capture efficiency, which is similar to the non-specific attachment shown in the SPR results (Figure 6(b)). We are not certain if this higher than expected level of non-specific attachment of non-hm-DNA to the MDB surface is due to the MBD protein or the surface as no blocking layers were used in either experiment, and more investigation is required to determine the cause of the non-specific adsorption, which will improve the performance of the assay. The efficiency was calculated as a ratio of the output concentration in the small volume eluent to the input concentration. Since the capture and elution of hm-DNA on MBD surfaces is based on modifying electrostatic binding effects by varying the ionic strength of the supporting buffer solution, the use of poly-MBD proteins may decrease the non-specific binding of non-hm-DNA.34 The hm-DNA μSPE system can be further miniaturized and optimized for integration with down-stream amplification or a detection chamber. The smallest volume used for elution, i.e., 25 μl, is limited by the ability to effectively reconstitute the hm-DNA into the elution buffer and can be further optimized by improving the target dissociation from the capture surface. We estimate the reproducibility of the protocol to be about 80%, which can be further improved with optimization to each of the protocol steps. Regardless, this first report of a hm-DNA μSPE system is promising for application in an analytical platform that combines an integrated system for hm-DNA purification, enrichment and subsequent detection
IV. CONCLUSIONS
A small volume μSPE system has been presented that is designed for capturing low hm-DNA concentrations (<1 ng ml−1). The elution into a small buffer volume provides sample enrichment and purification. All assay steps have been qualitatively characterized using a real-time surface plasmon resonance imaging biosensor, and quantitatively characterized using calibrated fluorescence spectroscopy. The μSPE system performs the capture-elution process with an efficiency greater than 90%, which is comparable to the efficiency of conventional large volume extraction kits, such as Epimark (New England Biolabs), Methyl Collector Ultra (Active Motif), and Methyl Miner (Life Technologies). The commercially available hm-DNA enrichment kits use MBD-protein based capture of hm-DNA, where the MBD protein is functionalized onto paramagnetic beads. Target hm-DNA capture and elution efficiencies are higher than 95% through repeated wash-elution cycles in the commercial kits. The μSPE system has been characterized with a 80-bp ds-hm-DNA and a 28× enrichment factor was obtained using a 25 μl elution volume. In principle, we can reach an enrichment factor near 100× with a 5 μl elution volume, which requires further optimization of the elution protocol. The advantages of the μSPE system compared to the conventional hm-DNA enrichment methods include (1) small volume sample enrichment step, (2) simple operation and a reduction of sample handling steps, which facilitates automation, and (3) a clear path to high throughput sample analysis.
ACKNOWLEDGMENTS
This work was supported by a private cancer research foundation in the Netherlands, and NanoNextNL, a nanotechnology consortium with 130 partners that is funded by the Government of the Netherlands. The authors thank Lennert de Vreede, Johan Bomer, Jan van Nieuwkasteele, and the MESA + Nanolab staff for helpful comments with device processing, and Mark Smithers for assistance with SEM imaging.
References
- 1.Wolffe A. P. and Matzke M. A., Science 286, 481 (1999). 10.1126/science.286.5439.481 [DOI] [PubMed] [Google Scholar]
- 2.Mulero-Navarro S. and Esteller M., Crit. Rev. Oncol. Hem. 68, 1 (2008). 10.1016/j.critrevonc.2008.03.001 [DOI] [PubMed] [Google Scholar]
- 3.Herman J. G., Graff J. R., Myöhänen S., Nelkin B. D., and Baylin S. B., Proc. Natl. Acad. Sci. U.S.A. 93, 9821 (1996). 10.1073/pnas.93.18.9821 [DOI] [PMC free article] [PubMed] [Google Scholar]
- 4.Gebhard L., Schwarzfischer L., Pham T. H., Andreesen R., Mackensen A., and Rehli M., Nucleic Acids Res. 34, e82 (2006). 10.1093/nar/gkl437 [DOI] [PMC free article] [PubMed] [Google Scholar]
- 5.Sonnet M., Baer C., Rehli M., Weichenhan D., and Plass C., Lymphoma: Methods in Molecular Biology ( Springer, 2013). [DOI] [PubMed] [Google Scholar]
- 6.Zou J., Harrington R. L., Rego D. A., and Ahlquist, Clin. Chem. 53, 1646 (2007). 10.1373/clinchem.2007.086223 [DOI] [PubMed] [Google Scholar]
- 7.Nollau P., Moser G., and Wagener C., Biotechniques 20, 784 (1996); available at http://www.biotechniques.com/multimedia/archive/00010/96205bm10_10965a.pdf. [DOI] [PubMed] [Google Scholar]
- 8.Muller A., Stellermann K., Hartmann P., Schrappe M., Fatkenheuer G., Salzberger B., Diehl V., and Franzen C., Clin. Diagn. Lab. Immun. 6, 243 (1999); available at http://www.ncbi.nlm.nih.gov/pmc/articles/PMC95694/. [DOI] [PMC free article] [PubMed] [Google Scholar]
- 9.Glöckner S. C., Dhir M., Joo M. Y., McGarvey K. E., Van Neste L., Louwagie J., Chan T. A., Kleeberger W., Bruïne A. P. De, Smits K. M., Bakker C. A. J. Khalid-de, Jonkers D. M. A. E., Stockbrüggker R. W., Meijer G. A., Oort F. A., Iacobuzio-Donahue C., Bierau K., Herman J. G., Baylin S. B., Van Engeland M., Schuebel K. E., and Ahuja N., Cancer Res. 69, 4691 (2009). 10.1158/0008-5472.CAN-08-0142 [DOI] [PMC free article] [PubMed] [Google Scholar]
- 10.Manz A., Graber N., and Widmer H. M., Sens. Actuators B-Chem. 1, 244 (1990). 10.1016/0925-4005(90)80209-I [DOI] [Google Scholar]
- 11.Tian A., Hühmer F. R., and Landers J. P., Anal. Biochem. 283, 175 (2000). 10.1006/abio.2000.4577 [DOI] [PubMed] [Google Scholar]
- 12.Cady N. C., Stelick S., and Batt C. A., Biosens. Bioelectron. 19, 59 (2003). 10.1016/S0956-5663(03)00123-4 [DOI] [PubMed] [Google Scholar]
- 13.Christel L. A., Petersen K., McMillan W., and Northrup M. A., J. Biomech. Eng. 121, 22 (1999). 10.1115/1.2798037 [DOI] [PubMed] [Google Scholar]
- 14.Bienvenue M., Duncalf N., Marchiarullo D., Ferrance J. P., and Landers J. P., J. Forensic Sci. 51, 266 (2006). 10.1111/j.1556-4029.2006.00054.x [DOI] [PubMed] [Google Scholar]
- 15.Nakagawa T., Tanaka T., Niwa D., Osaka T., Takeyama H., and Matsunaga T., J. Biotechnol. 116, 105 (2005). 10.1016/j.jbiotec.2004.08.018 [DOI] [PubMed] [Google Scholar]
- 16.Cao W., Easley C. J., Ferrance J. P., and Landers J. P., Anal. Chem. 78, 7222 (2006). 10.1021/ac060391l [DOI] [PubMed] [Google Scholar]
- 17.Wen C., Guillo C., Ferrance J. P., and Landers J. P., Anal. Chem. 79, 6135 (2007). 10.1021/ac0703698 [DOI] [PubMed] [Google Scholar]
- 18.Wu Q., Bienvenue J. M., Hassan B. J., Kwok Y. C., Giordano B. C., Norris P. M., Landers J. P., and Ferrance J. P., Anal. Chem. 78, 5704 (2006). 10.1021/ac060390t [DOI] [PubMed] [Google Scholar]
- 19.Wolfe A., Breadmore M. C., Ferrance J. P., Power M. E., Conroy J. F., Norris P. M., and Landers J. P., Electrophoresis 23, 727 (2002). [DOI] [PubMed] [Google Scholar]
- 20.Breadmore C., Wolfe K. A., Arcibal I. G., Leung W. K., Dickson D., Giordano B. C., Power M. E., Ferrance J. P., Feldman S. H., Norris P. M., and Landers J. P., Anal. Chem. 75, 1880 (2003). 10.1021/ac0204855 [DOI] [PubMed] [Google Scholar]
- 21.Min J., Kim J. H., Lee Y., Namkoong K., Im H. C., Kim H. N., Kim H. Y., Huh N., and Kim Y. R., Lab Chip 11, 259 (2011). 10.1039/c0lc00320d [DOI] [PubMed] [Google Scholar]
- 22.Cady C., Stelick S., Kunnavakkam M. V., and Batt C. A., Sens. Actuators B-Chem. 107, 332 (2005). 10.1016/j.snb.2004.10.022 [DOI] [Google Scholar]
- 23.Easley C. J., Karlinsey J. M., Bienvenue J. M., Legendre L. A., Roper M. G., Feldman S. H., Hughes M. A., Hewlett E. L., Merkel T. J., Ferrance J. P., and Landers J. P., Proc. Natl. Acad. Sci. U.S.A. 103, 19272 (2006). 10.1073/pnas.0604663103 [DOI] [PMC free article] [PubMed] [Google Scholar]
- 24.Bienvenue J. M., Legendre L. A., Ferrance J. P., and Landers J. P., Forensic Sci. Int-Gen. 4, 178 (2010). 10.1016/j.fsigen.2009.02.010 [DOI] [PubMed] [Google Scholar]
- 25.Legendre L. A., Bienvenue J. M., Roper M. G., Ferrance J. P., and Landers J. P., Anal. Chem. 78, 1444 (2006). 10.1021/ac0516988 [DOI] [PubMed] [Google Scholar]
- 26.Reedy C. R., Bienvenue J. M., Coletta L., Strachan B. C., Bhatri N., Greenspoon S., and Landers J. P., Forensic Sci. Int.-Gen. 4, 206 (2010). 10.1016/j.fsigen.2009.09.005 [DOI] [PubMed] [Google Scholar]
- 27.Reedy C. R., Hagan K. A., Strachan B. C., Higginson J., Bienvenue J. M., Greenspoon S. A., Ferrance J. P., and Landers J. P., Anal. Chem. 82, 5669 (2010). 10.1021/ac100649b [DOI] [PubMed] [Google Scholar]
- 28.Zhang H., Shan L., Wang X., Ma Q., and Fang J., Biosens. Bioelectron. 42, 503 (2013). 10.1016/j.bios.2012.10.013 [DOI] [PubMed] [Google Scholar]
- 29.Zhao Y., Guo S., Sun J., Huang Z., Zhu T., Zhang H., Gu J., He Y., Wang W., Ma K., Wang J., and Yu J., PLoS One 7, e35175 (2012). 10.1371/journal.pone.0035175 [DOI] [PMC free article] [PubMed] [Google Scholar]
- 30.Acevedo L. G., Sanz A., and Jelinek M. A., Epigenomics 3, 93 (2011). 10.2217/epi.10.69 [DOI] [PubMed] [Google Scholar]
- 31.MethylMinerTMMethylated DNA Enrichment Kit Users Manual (Invitrogen, A11129, 09 September 2009).
- 32.Zimmermann M., Delamarche E., Wolf M., and Hunziker P., Biomed. Microdevices 7, 99 (2005). 10.1007/s10544-005-1587-y [DOI] [PubMed] [Google Scholar]
- 33.Shu W., Laue E. D., and Seshia A. A., Biosens. Bioelectron. 22, 2003 (2007). 10.1016/j.bios.2006.08.047 [DOI] [PubMed] [Google Scholar]
- 34.Jorgensen H. F., Adie K., and Bird A. P., Nucleic Acids Res. 34, e96 (2006). 10.1093/nar/gkl527 [DOI] [PMC free article] [PubMed] [Google Scholar]
- 35.See supplementary material at http://dx.doi.org/10.1063/1.4899059E-BIOMGB-8-025405 for the three dimensional flow simulation results, the glass-silicon microchip fabrication process, the fluorescence assay calibration curve, and hm-DNA capture elution data.
Associated Data
This section collects any data citations, data availability statements, or supplementary materials included in this article.
Data Citations
- See supplementary material at http://dx.doi.org/10.1063/1.4899059E-BIOMGB-8-025405 for the three dimensional flow simulation results, the glass-silicon microchip fabrication process, the fluorescence assay calibration curve, and hm-DNA capture elution data.


