

Abstract
Objective
Hypoxia–ischemia (HI) in preterm infants primarily leads to injuries in the cerebral white matter. However, there is growing evidence that perinatal injury in preterms can also involve other zones including the cortical gray matter. In a neonatal rat model of HI, selective vulnerability of subplate has been suggested using BrdU birth-dating methods. In this study, we aimed to investigate the neuropathological changes of the subplate and deep layers of the cortex following cerebral HI in neonatal rats with specific cell markers.
Methods
P2 rats underwent permanent occlusion of the right common carotid artery followed by a period of hypoxia. P8 rats were analyzed using immunohistochemistry; subplate and deep layers cells were quantified and compared with sham-operated case.
Results
A large variability in the extent of the cerebral injury was apparent. For the three analyzed subplate populations (Nurr1+, Cplx3+, and Ctgf+ cells), no significant cell reduction was observed in mild and moderate cases. Only in severe cases, subplate cells were strongly affected, but these injuries were always accompanied by the cell reductions in layers VI and V.
Interpretation
We could therefore not confirm a specific vulnerability of subplate cells compared to other deep layers or the white matter in our model.
Introduction
Hypoxia–ischemia (HI) is the most common cause for perinatal brain injury both in term and preterm infants.1,2 In preterm infants, perinatal brain injury is mainly localized in the white matter; however, there is increasing evidence that cortical and subcortical gray matter are also involved. Injury to subplate neurons, a population of early-born cells at the border between white matter and cortical layer VI, could importantly contribute to the cognitive, sensory, and behavioral deficits resulting from preterm injury due to the important role of these cells in normal cortical development. Subplate abnormalities have been described in several neuropathological disorders including schizophrenia, autism, and periventricular leukomalacia.3,4 The human subplate layer reaches a developmental peak at the same time as the premature brain is at the highest risk for hypoxic injury, that is, around 27–30 gestational weeks.5,6 Subplate neurons are particularly critical for the development of visual thalamocortical connections and the establishment of ocular dominance columns.7,8 Subplate damage has therefore been proposed to underlie visual impairments which are common in infants with preterm perinatal damage.9,10
There is some evidence that subplate neurons could be specifically vulnerable to insults at the preterm stage. Purified subplate cells in culture are more vulnerable to oxygen–glucose deprivation than cells derived from the cortical plate.11 Similarly, in a P1/P2 rat model of HI, cell loss was observed in the ventricular zones, the white matter and the subplate, while other cortical layers appeared intact except in the most severe cases.12 In subsequent studies on the model, an impairment of the ocular dominance plasticity in the visual cortex was reported.13
We have recently identified and confirmed a range of specific markers for rodent subplate using a microarray-based approach and found that different subplate subpopulations are characterized by distinct expression patterns of these genes.14–16 In this study, we use a combination of specific markers to analyze cell numbers in different cortical cell populations including subplate following HI in a preterm rat model.
Methods
HI model
All experiments were performed according to the guidelines of the Swiss Veterinary Office. Two-day-old male Sprague-Dawley rats were anesthetized with 3% isoflurane and their right common carotid artery (CCA) was double ligated and cut. Sham-operated animals underwent the same surgical procedure except that the carotid was not sectioned. After a recovery period of at least 2 h with the dam, all pups except for the sham animals were placed in 6% O2 at 35.5°C in an incubator for 1.5–2 h. Body temperature was monitored after the surgery and again after the hypoxic period and was kept stable at 35–36°C. The pups were then returned to the dam until P8 when they were killed for analysis. A total of 65 animals were used in six experimental series. The mortality rate was 24% during the hypoxic period. Of the remainder, we used seven sham and 35 HI brains for this study.
Tissue preparation, staining, and immunohistochemistry
Animals were deeply anesthetized with pentobarbitone and transcardially perfused with 4% Paraformaldehyde (PFA). Brains were removed and postfixed overnight in the same fixative. They were then sectioned into 50-μm-thick coronal sections on a vibrating microtome (Leica Microsystems (UK) Ltd, Milton Keynes, UK).
For cresyl violet staining, mounted and air-dried sections were rehydrated in serial alcohol dilutions with descending concentration and stained with 0.1% cresyl violet (Sigma, Swindon, UK) in H2O for 10 min. Sections were rinsed in H2O and dehydrated through serial alcohol dilutions with ascending concentration and cleared with xylene and histoclear (Sigma).
For immunohistochemistry, sections were blocked for 2 h at RT with 5% donkey serum (Sigma) in Phorphate Buffered Saline (PBS) with 0.2% Triton-X100 British Drug Houses (BDH). For permanent immunohistochemistry, sections had been quenched in 1.5% hydrogen peroxide before blocking. Sections were then incubated with primary antibody in 1% donkey serum and 0.2% Triton overnight at 4°C. The following primary antibodies were used: antinuclear receptor-related 1 (Nurr1) 1:200 (AF2165; R&D Systems, Abingdon, UK) anticomplexin 3 (Cplx3) 1:3000 (gift K. Reim), anticonnective tissue growth factor (Ctgf) 1:500 (sc-14939; Santa Cruz Biotechnologies, Dallas, Texas, USA) anti-fork head boxP2 (FoxP2) 1:4000 (ab16046; Abcam, Cambridge, UK) anti-ETS transcription factor (Er81) 1:32,000 (gift T. Jessel) and antimyelin basic protein (MBP) 1:200 (sc-13914; Santa Cruz Biotechnologies), anti-ionized calcium-binding adapter molecule 1 (Iba1) 1:500 (ab5076; Abcam), anticleaved caspase 3 1:500 (9661; Cell Signaling/New England Biolabs, Hitchin, UK) antiglial fibrillary acidic protein (GFAP) 1:100 (Z0334; DAKO, Ely, UK) anti-Nestin 1:100 (MAB353; Chemicon, Watford, UK). For permanent labeling, biotinylated donkey anti-rabbit antibody 1:200, donkey anti-mouse antibody 1:200, or donkey anti-goat antibody 1:200 (Abcam) in 1% donkey serum were applied for 2 h at RT and reacted with avidin–biotinylated enzyme complex (ABC) using the Vectastain Elite kit (Vector Labs, Peterborough, UK) and 3,3′-diaminobenzidene (DAB Peroxidase substrate kit; Vector) according to the manufactuer’s instructions. For fluorescent labeling, sections were incubated with secondary antibody AlexaFluor568 conjugated donkey anti-rabbit (Life Technologies, A10042; 1:500) or donkey anti-mouse (Life Technologies, A10037; 1:500) or donkey anti-goat (Life Technologies, A11057; 1:500), Paisely, UK or Fluorescein Griffonia (Bandeiraea) Simolicifolla Lectin Isolectin B4 (FL-1201, Vector Laboratories, 1:200) in 1% donkey serum PBS for each of the primary antibody.
For colocalization between MBP and isolectin B4 sections were blocked in 5% donkey serum in TBS: Trisbuffered saline with 0.1% Triton-X100 for 2 h at RT and incubated with anti-MBP antibody at 4°C overnight. Anti-goat AlexaFluor 488 1:500 (Life technologies) was added together with Griffonia Simplicifolia isolectin B4-Texas Red 1: 200 (Vector Laboratories) in 1% donkey serum in TBS+ Triton for 2 h at RT before counterstaining with DAPI: 4′,6-diamidino-2-phenylindole.
Quantification of cell numbers and layer thickness
Cortical thickness was measured at three positions (dorso-medial, middle, and lateral).
Nurr1+, Cplx3+, and Ctgf+ subplate cells were quantified in the subplate (defined as a 120-μm-thick layer in the P8 rat based on marker expression) across a 3.5-mm-long expanse of the cortex. The layer V and VI cells were counted in three 0.5-mm radial columns (Fig. S1). Cells were counted blind to treatment condition on at least two sections at the level of S1 (Bregma −2.5) per brain. For each marker, cell numbers were statistically compared between sham and treated animals using analysis of variance (ANOVA) followed by t-tests. Cell reduction rates (Figs. 2, 3) were calculated as: %(cell reduction) = 1 − ([number of cells]/[average number of cells in sham]).
Figure 2.

Changes in Nurr1+, Cplx3+, and Ctgf+ subplate cell populations after hypoxia–ischemia. Examples of Nurr1 (A), Cplx3 (B), and Ctgf (C) immunoreactive subplate cells in the ipsilateral hemisphere of sham (control) and mild, moderate and severe cases after hypoxia–ischemia. In the mild case, subplate cell populations appear unaffected. In the moderate case, a few patches of cell loss are visible in the subplate with all of markers (arrowheads). In the severe case, only subplate cells in the most dorso-medial cortex are preserved. Scale bars: 1 mm (large panels); 200 μm (small panels). Quantification of cell death of Nurr1+, Cplx3+, and Ctgf+ in the ipsi- and contralateral hemispheres compared to sham controls (D). In the ipsilateral cortex of severe cases, a large proportion of Cplx3+, Nurr1+, and Ctgf+ cells underwent cell death (~80%). n = 7 (mild), five (moderate), and five (severe) for Nurr1 and Cplx3; n = 4 for Ctgf. Error bars are SEM. Asterisks (*) indicate significant cell death compared to sham controls (P < 0.05).
Figure 3.

Changes in deep cortical layer IV–VI cell populations after hypoxia–ischemia. Examples of Er81 immunoreactivity labeling layer VI (A), for the immunoreactivity for FoxP2 labeling layer VI (B) in the ipsilateral hemisphere of sham (control) and mild, moderate, and severe case after hypoxia–ischemia. In the mild case, the FoxP2+ layer VI appears unaffected while a few patches of cell loss are seen in the Er81+ layer V (arrowhead). In the moderate case, cell loss is visible in the Er81+ layer V and the FoxP2+ layer VI (arrowhead). In severe cases, a very large proportion of Er81+ and FoxP2+ cells underwent cell death. Scale bar: 500 μm. (C) Quantification of differences in Er81+ and FoxP2+ cell numbers in the ipsi- and contralateral hemispheres compared to sham controls. In severe cases, a large proportion of Er81+ and FoxP2+ cells underwent cell death (~90%). Error bars are SEM. Asterisks (*) indicate significant cell death compared to sham controls (P < 0.05).
The thickness of deep layers (layers VI and V) and upper layers (layers II–IV) was measured on FoxP2-immunoreacted sections, where layers VI and V are labeled. Thicknesses were measured at two points in the cortex (2 and 3 mm away from the midline) on two sections at the level of S1 (Bregma −2.5). Measurements were normalized to sham controls and a reduction in thickness calculated as: reduction (thickness) = 1 − ([thickness]/[average thickness in sham]). Thickness of upper and lower cortical layers were compared within the same severity group using t-tests.
Results
Histological analysis of hypoxic–ischemic brains
The extent of the cerebral injury was assessed for each brain on cresyl-violet-stained sections 6 days after the hypoxic–ischemic insult. As previously reported by others,12,13 a large variability in the severity of the pathological changes was apparent (Fig. 1A–C). Sixteen brains (46%) had normal structural and cellular morphologies with no apparent lesions (Fig. 1A). Twelve further brains (34%) showed decreased cell density in the deep layers of the ipsilateral hemisphere which were sometimes accompanied by several patches of degenerated cells or scarred tissue (Fig. 1B). Finally, seven brains (20%) had extensive lesions in the ipsilateral cortical hemisphere with prominent scars, primarily localized in layer V (Fig. 1C). Cells in the layers below the scar appeared severely degenerated while cells in the layers above the scar appeared normal. These severe cortical lesions were generally accompanied by a degenerated hippocampus and enlarged ventricles. In addition, in the three most severe cases, the contralateral hemisphere was also affected, although to a lesser extent than the ipsilateral hemisphere. The affected contralateral hemispheres were most severely damaged in the region closest to the midline but also showed some atrophy, cell loss, and/or small scars more laterally (not shown).
Figure 1.
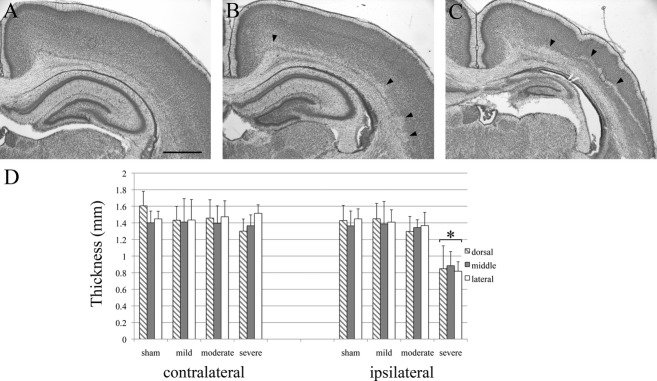
Histological assessment of cortical injuries after hypoxia–ischemia. Cresyl-violet-stained sections from the ipsilateral hemispheres at P8 after hypoxia–ischemia at P2. Sections at the level of the somatosensory cortex in a mildly (A), a moderately (B), and a severely affected brain (C). In the mild case (A), structural and cellular morphologies appear normal. In the moderate case (B), small patches of necrotic cells and cell loss are visible in and above the subplate zone (arrowheads). In the severe case, a large band of necrotic cells spans the lower cortical layers and a prominent scar crosses the cortical wall. The hippocampus is severely degenerated (C). Scale bar: 1 mm. (D) Quantification of the cortical thickness. There is no observable difference in cortical thickness between ipsi and contralateral cortices in sham, and mild cases. In moderate cases, there is a trend for a slight reduction in thickness compared to the contralateral side. In severe cases, the cortical thickness at all locations (dorso-medial, middle, and lateral) is significantly reduced compared to sham cases. There was no significant difference among dorso-medial, middle, and lateral areas. Asterisks (*) indicate significant difference in thickness, most probably due to cell death, compared to ipsilateral sham controls (P < 0.05). Error bars are SEM.
Based on this histological assessment, brains were divided into three categories: Mild (no or mild atrophy, normal histology; n = 16 brains), moderate (mild or moderate atrophy; decreased cell density or patches of dead cells at least in one area of the brain; n = 12 brains) and severe (moderate or severe atrophy; presence of a scar; n = 7 brains).
As a simple quantitative measure of injury, the cortical thickness of ipsi- and contralateral hemispheres was taken at three different positions. There was no observable difference in cortical thickness between ipsi- and contralateral cortices in sham and mild cases. In moderate cases, there was a trend for slight reduction of the ischemic side compared to contralateral side, but this was not significant. In severe cases, the cortical thickness of the ipsilateral hemisphere was significantly reduced by ~40% compared to sham cases (P < 0.001). There was no difference among dorso-medial, middle, and lateral areas (Fig. 1D).
Subplate cell death is limited to severe cases
The number of Nurr1+, Cplx3+, and Ctgf+ cells was counted in the ipsi- and contralateral hemispheres of the hypoxic–ischemic brains and compared to cell numbers in the sham operated (Fig. 2).
We found, on average, no changes in subplate cell numbers in the mild and moderate cases for all three subplate cell populations. The number of Cplx3+ cells was slightly decreased by an average of 14% in the ipsilateral hemisphere of moderate cases, but this difference was not significant. In the ipsilateral hemisphere of the severely affected brains, all three subplate cell populations were severely and significantly decreased by an average of 80–90% (P < 0.05) (Fig. 2).
Subplate damage is accompanied by cell death in layers V and VI
To assess whether cells in other cortical layers were affected by the hypoxic–ischemic insult, cell numbers in layers VI and V were quantified using immunohistochemistry against FoxP2 and Er81, respectively.
For the mildly affected cortices, no significant cell death was observed for either cell population on average. In moderate cases, a significant cell reduction was observed for Er81+ cells in layer V (28%, P = 0.035) but not for FoxP2+ layer VI cells (Fig. 3A). In severe cases, there was a very large reduction in the number of both Er81+ and FoxP2+ cells in the ipsilateral hemisphere (~90%, P < 0.001) and a more modest reduction in the number of Er81+ cells in the contralateral hemisphere (26%, P = 0.021) (Fig. 3A and B).
In order to determine, with an alternative method, whether lower layers (i.e., SP, VI, and V) were more affected than upper layers (layers IV and II/III), the thickness of the two compartments was measured in hypoxic–ischemic cases and compared to sham animals. Sections were labeled with the deep layer marker FoxP2. In mild, moderate, and severe cases, the decrease in layer thickness was more pronounced in the deep layers than in the upper layers (Fig. 4J). However, this difference in thickness reduction between lower and upper layers was only significant for the moderate cases (P = 0.008).
Figure 4.
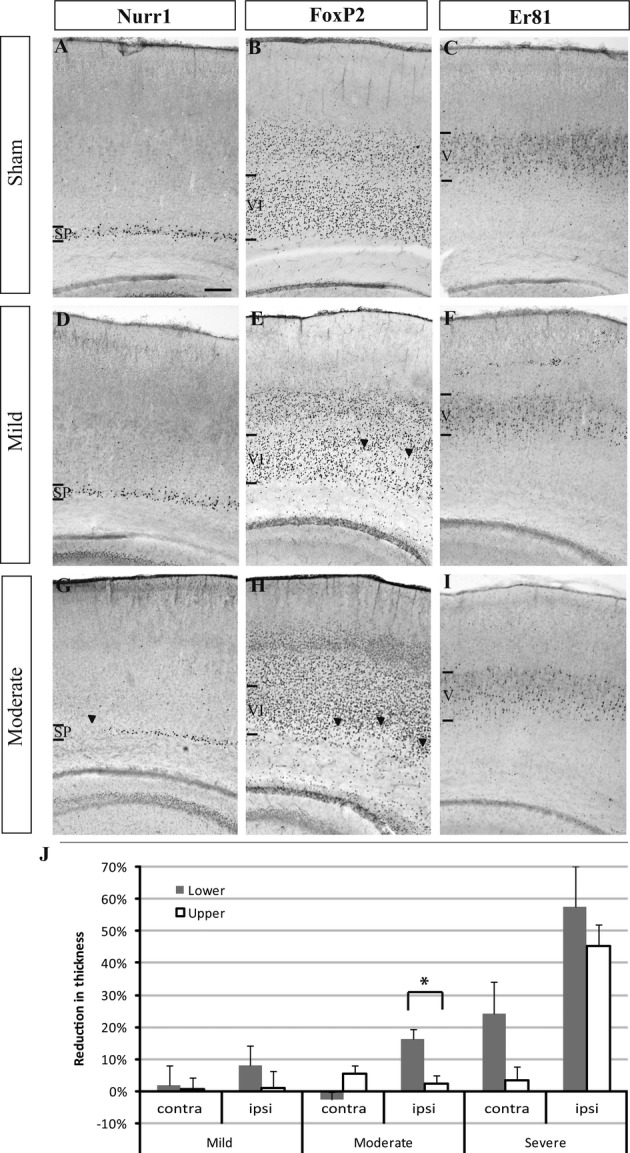
Thickness of deep cortical layers V and VI after hypoxia–ischemia. Examples of immunohistochemistry signals of the subplate (SP) marker Nurr1 (A, D, and G), the layer VI marker FoxP2 (B, E, and H) and the layer V marker Er81 (C, F, and I) in the ipsilateral hemisphere of sham (control) and mild and moderate cases after hypoxia–ischemia. In the mild case (D–F), the Nurr1+ SP appears unaffected (D) while a few patches of cell loss are seen in the Foxp2+ layer VI (E, arrowheads). In the moderate case (G–I), cell loss is visible in the Nurr1+ SP (G) and the FoxP2+ layer VI (H) (arrowheads). Staining for Er81 in layer V appears less dense (I) than in the sham control (C). Scale bar: 200 μm. (J) Quantification of the reduction in thickness of upper and lower layers in the ipsilateral (IL) and contralateral (CL) cortex compared to sham controls. In the IL hemisphere of mild and moderate cases, reduction in thickness was more pronounced for the lower layers than the upper layers. This difference reached statistical significance for moderate cases (indicated by an asterisk *, P = 0.008). In severe cases, the thickness of lower layers was reduced both ipsi- as well as contralaterally, and the upper layer thickness was reduced on the ipsilateral side. Error bars are SEM.
Changes in MBP+ cells following hypoxic–ischemic insult
As HI in preterm infants is known to primarily damage developing oligodendrocytes, immunohistochemistry against MBP was performed on a subset of brains to evaluate myelination and oligodendrocyte maturation (Fig. 5). A reduction of MBP+ cell staining was observed in a majority of analyzed cases (11 of 16 brains). In mild cases, MBP+ cells and fibers appeared reduced and extended less deeply into the cortical plate (Fig. 5B). In severe cases, MBP+ cells appeared degenerated and almost no MBP+ fibres were present (Fig. 5D). Surprisingly, in several brains, MBP+ cells were found to be accumulating within lesions in the cortical plate (Fig. 5C). These MBP+ cells presented a characteristic morphology with large cell bodies and extensive, arborizing ramifications (insert Fig. 5C) and did not coexpress the microglial marker IB4 (Fig. 5E).
Figure 5.

Changes in white matter and oligodendrocytes after hypoxia–ischemia. Examples of immunohistochemistry signals of MBP+ oligodendrocytes and cortical white matter in the ipsilateral hemisphere of sham (control) (A) and mild (B), moderate (C), and severe cases (D) after hypoxia–ischemia. In the mild case (B), MBP+ cells and fibers are reduced in length in the lateral cortex compared to the sham control (arrowheads). In the moderate case (C), the lesioned area in layer V/VI is filled with MBP+ cells. The insert in (C) shows the morphology of two of these cells. In the severe case (D), the entire cortex below the scar contains MBP+ cells. These cells appear degenerated and do not have the same morphology as observed in moderate cases. (E) Immunohistochemistry signals of MBP and IB4 within the cortical lesion. The MBP+ cells (green, filled arrowheads) filling the lesions in moderate cases (C) do not coexpress the microglial marker IB4 (red, empty arrowheads) and the two cell types have very different morphologies. Scale bars: 1 mm (A–D); 50 μm (E and insert in C).
Alterations in markers of injury throughout the cortical hemisphere
In both moderate and severe cases, an increase of cells expressing activated caspase 3 was observed throughout the entire extent of the cortical hemisphere (Fig. 6E and F) indicating ongoing apoptotic processes in all cortical layers. Similarly, an increase in microglia labeled by Iba1 was found throughout all cortical layers in moderate cases (Fig. 6B). In severe cases, many microglia with hypertrophic bodies appeared to accumulate within the glial scar, while many others were found above and below (Fig. 6C).
Figure 6.
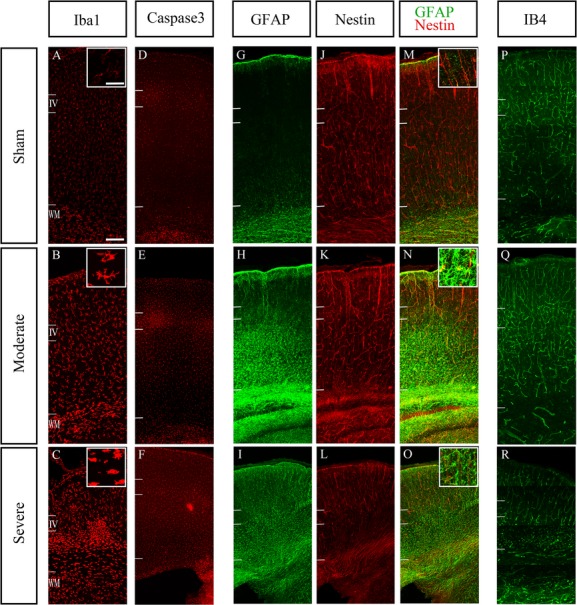
Measures of cell death and inflammation. Immunoreactivity imaged with confocal microscopy for the microglial marker Iba1 (A–C), the apoptotic cell death marker cleaved caspase3 (D–F), the astrocyte marker GFAP (G–I), Nestin (J–L) and IB4 as a marker of endothelial cells to delineate blood vessels (P–R) in the ipsilateral hemisphere after HI in sham (upper row), moderate (middle row), and severe (lower row) cases. Qualitative analysis suggests a larger number of Iba1+ cell in the moderate case (B) compared to sham (A). Moreover, the labeled cells exhibited hypertrophic bodies and concentrated below the layer IV in severe case (C). Caspase3+ cells appear more abundant in moderate and severe cases compared to sham (D–F). Caspase3 immunoreactivity appears strongest in layer 4, but it was observed across the entire depth of cortex, suggesting an increase in apoptosis in all layers of the cortex after HI. GFAP immunoreactive astrocytes were distributed within white matter and deep layers in moderate case (H), but in severe case, GFAP+ cell were extending into the entire thickness of the cortex (I). In the severe case, Nestin+ cells are less frequent than sham in deep layers (L). In the moderate case (Q), IB4 immunoreactive blood vessels were more abundant and possibly also more branched compared to sham cases (P). The density of labeled structures was similar between sham (P) and severe cases (R), but the IB4+ structures did not have the appearance of normal blood vessels in the deep layers. Scale bars: 50 μm (A–L), 200 μm (M–R).
GFAP+ astrocytes were primarily localized within the white matter in sham. But in moderate cases, many astrocytes were also found in deep layers (Fig. 6H). In severe cases, overall labeling with GFAP was greatly increased and astrocytes were found throughout the entire cortex (Fig. 6I). In moderate cases, Nestin immunoreactivity was not affected, but there was a sparser labeling in deep layers in severe cases (Fig. 6J–L). Some GFAP+ cells coexpressed Nestin in moderate cases, but there appeared to be only limited overlap between GFAP and Nestin labeling in severe cases (Fig. 6M–O).
Using IB4 to label endothelial cells, we observed that a disruption of the blood vessel network was seen in severe cases in the area of the scarred tissue (Fig. 6R). Many IB4+ cells appeared to be degenerated and accumulating within the lesions.
Discussion
We used a model of HI in rat at P2 and assessed layer specific cell death ~1 week later. This delay between insult and analysis allows us to monitor overall brain damage, not just immediate cell death events, which might lead to subsequent waves of cell death. We chose this time point, as we were particularly interested in identifying whether selected subgroups of subplate neurons are more vulnerable to HI, and the subplate-specific molecular markers are best documented for P8 in rat. However, this precludes an analysis of the effects of HI on behavior. For comparison, human 27–30 GW is roughly equivalent to rat P1–P2 when comparing neurogenesis and axon extension events (translatingtime.net).
HI mainly affects deep layers but is not specific to subplate
As previously reported by others,12,13 a large variability in the severity of the hypoxic–ischemic damage between different animals was observed. However, we found that subplate cell populations, identified by either Nurr1, Cplx3, or Ctgf, were relatively robust to HI. In mild and moderate cases, no significant changes in cell numbers were observed, even though in a few individual cases, small patches of cell loss had been visible in the subplate (Fig. 2). Only in severe cases, subplate cell numbers were strongly and significantly reduced by 80–90% for all three populations. Unlike previous publications, we did not find evidence for subplate-specific vulnerability when compared to other deep layers. Er81+ layer V cells underwent significant cell reductions in moderate cases and both layer V and FoxP2+ cell numbers were strongly reduced in severe cases. Similarly, cleaved caspase3, a marker of apoptosis, and Iba1+, a marker for microglia, were seen expressed in the entire cortex 1 week after the hypoxic–ischemic insult, further suggesting that cell death and inflammatory processes were taking place in all cortical layers.
We did find some evidence, however, that deep layers including subplate appeared to be more vulnerable than upper layers as the decrease in cortical thickness was significantly greater for lower layers compared to upper layers. Similarly, at least in moderate cases, astrocytes appeared to be mainly present in the white matter and the deep layers including subplate and absent from the upper layers. The increased vulnerability of the lower cortical layers is in line with previous studies on comparable models of P2 and P3 rats where columns of degenerated cells in the deep cortex involving subplate, layer VI, and layer V were described.17,18
Our qualitative analysis suggests increasing active apoptosis, microglia, and astrocyte in moderately and severely damaged cases after HI. Interestingly, in the severe cases, there was an increased occurrence of IB4+ cells that appeared to be degenerated and a disrupted blood vessel network. This decrease and damage to the blood vessel network might be related to the observed cell death.
Limitations of this study and comparison to other models
The discrepancies of our findings with those of McQuillen and colleagues,12 who reported subplate-specific cell death in mild and moderate cases, could be partially due to differences in methods. As McQuillen and colleagues identified subplate cells by BrdU birth-dating at E13 but did not label other cell populations, it is conceivable that they were not detecting changes in other deep layer populations. On the other hand, we cannot exclude that using Nurr1, Cplx3, and Ctgf to identify subplate cells, we have analyzed different subplate subpopulations than those labeled by a pulse of BrdU at E13. A recent study in mouse suggests that different subplate markers label subplate cells of different birth dates.19
Discrepancies between the two studies could also be due to small differences in the models: although the same rat strain (Sprague-Dawley) and same age (P2) were used, we exposed the animals to a slightly milder hypoxic environment (6% O2 vs. 5.6%) at a lower temperature (35.5°C vs. 37°C). In order to rule out that different parameters were underlying the observed differences in pathologies, we performed one series of experiments using the same oxygen concentration and temperature as McQuillen and colleagues. A qualitative analysis of cresyl-violet-stained sections of 10 hypoxic–ischemic brains indicated no changes in subplate cell densities (Data S1).
In addition to the cited work, at least seven independent studies have been conducted on models of preterm HI and their parameters and the main findings are summarized in Table 1. Even though all models work with rats between P1–P3, the resulting injuries are different in each model. Most commonly, however, damage is observed in the periventricular white matter and in the deep cortical layers including subplate. This is further confirmed by electrophysiological evidence, suggesting that layer 5 pyramidal cells and subplate neurons are similarly affected by oxygen–glucose deprivation.26
Table 1.
Summary of the parameters and major findings of preterm hypoxia–ischemia models previously described in the literature
| Age | Strain | Parameters of HI | Survival rate | White matter injury | Cortical injury | Reference |
|---|---|---|---|---|---|---|
| P1 | Sprague Dawley | Right CCA coagulation, 6% O2, 3.5 h, 37°C | 74% (23/31) | Edema and necrosis in the periventricular white matter; thin cc | Neuronal loss and cystic necrosis; most severe damage in layers III–V | Sheldon et al.20 |
| P2/P3 | Wistar | Right CCA ligation, 5% O2, 30 min, 34° C | 100% (10/10) | None | None | Towfighi et al.17 |
| P2/P3 | Wistar | Right CCA ligation, 5% O2, 1 h, 34°C | 53% (16/30) | n.a. | The upper cortical layers in small infarcts were relatively preserved. | |
| P2/P3 | Wistar | Right CCA ligation, 5% O2, 1.5 h, 34°C | 0% (0/10) | – | – | |
| P5 | Wistar | Right CCA ligation, 5% O2, 30 min, 34°C | 100% (10/10) | n.a. | Columns of dead cells, sometimes fused into larger infarcts, mainly in deep cortical layers | |
| P5 | Wistar | Right CCA ligation, 5% O2, 1 h, 34°C | 100% (10/10) | n.a. | ||
| P5 | Wistar | Right CCA ligation, 5% O2, 1.5 h, 34°C | 100% (10/10) | n.a. | ||
| P3 | Wistar | Right CCA coagulation, 6% O2, 30 min, 37°C | Loss of myelination in the intracortical white matter (but not the cc) and clumping of fibers; increase in numbers and proliferation of early OL progenitors and numbers of mature OLs in the area of injury | Scattered or confluent columns of degenerating cells; majority of injury in deep layers (VI and subplate) 12–24 h after HI; axonal injury in the deep and middle layers (IV, V, VI and subplate) | Sizonenko et al.21–23 | |
| P3 | Sprague Dawley | Left CCA coagulation, 6% O2, 15 min, 37°C | 88% (100/114) | n.a. | Neuronal death in all cortical layers plus thalamus and basal ganglia | Stadlin et al.24 |
| P2 | Sprague Dawley | Left CCA ligation, 6% O2, 4 h, 37°C | n.a. | Selective degeneration of late OL progenitors; loss of tissue in the cc; increased number and proliferation of late OL progenitors in the area of lesion; reactive OLs | n.a. | Back et al.25 |
| P1/P2 | Sprague Dawley | Right CCA coagulation, 5.6% O2, 3 h, 37°C | 75% (48/64) | Extensive cell death in the periventricular white matter and the internal capsule (ISEL) | Moderate to near-complete death of the subplate (ISEL, BrdU), other cortical layers mostly intact 24 h, 4 days after HI, increased cell death was not detectable | McQuillen et al.12 |
HI, hypoxia–ischemia; CCA, common carotid artery; cc, corpus callosum; BrdU, Bromodeoxyuridine; OL, oligodendrocytes; ISEL, in-situ end labeling (a method to label apoptotic cells); n.a., not analyzed.
The variability observed between individual animals within one model and between different models makes it more difficult to draw conclusions, but also reflects the variability observed in human pathology. For instance, a recent study on hypoxic–ischemic encephalopathy in preterm babies describes that one-third of the infants had normal outcomes, one-third died, and one-third showed impairments ranging from mild motor delays to severe cerebral palsy.27 Animal models of preterm HI could therefore be a useful tool to further study the intrinsic and extrinsic factors determining the large variability of the outcome of a hypoxic–ischemic insult.
Finally, our method of quantifying cell populations limits our analysis to the detection of cell loss or large changes in gene expression. In the future, it would be interesting to investigate more subtle changes in the different layers such as modification in the expression of neurotransmitters or neuroaxonal damages. As we have found some changes in inflammatory markers (Iba1, GFAP, Nestin), these mechanisms should further be investigated.
Conclusion
In contrast to previous studies, we found that subplate cells identified by Nurr1, Cplx3, and Ctgf appeared to be surprisingly robust in a rat model of preterm HI. We did not find any evidence that subplate cells are more vulnerable than other deep layers or the white matter as they were generally damaged in parallel.
Acknowledgments
This work is supported by the MRC (UK), the Berrow Foundation (Lincoln College, Oxford University), and the Eagle Foundation (Switzerland). We are grateful to Ann Sheldon and Donna Ferriero (University of California San Francisco, Neurointensive Care Nursery, 505 Parnassus Ave., 15th floor, San Francisco, CA 94143, USA) for providing material for Figure S2 and for discussions.
Conflict of Interest
None declared.
Supporting Information
Additional Supporting Information may be found in the online version of this article:
Regions of quantifications illustrated. (A) Subplate cells were counted on coronal sections taken at the level of anterior corpus callosum in putative somatosensory cortex in a 3.5-mm-long stripe that was 1.5-mm lateral from the midline. (B) Cortical thickness was measured at three positions (dorso-medial, middle, and lateral). The layer V and VI cells were counted in three 0.5-mm radial columns that are indicated with squares in (B).
Cresyl-violet and Nurr1+ staining of the somatosensory cortex after hypoxia–ischemia model 2. Examples of Cresyl-violet-stained sections (A and B) and immunohistochemistry signals of Nurr1+ (C and D) from the ipsi, contralateral hemispheres at P8 after hypoxia–ischemia at P2. There was no apparent variability between the cases of the second model. All hypoxic–ischemic brains had a normal outer appearance and showed normal structural and cellular morphologies of the cortex. All cases in this model were classified as “mild”. Scale bars: 500 μm (A), 1 mm (C).
Supplementary method: Hypoxia–ischemia model 2.
References
- Inder TE, Volpe JJ. Mechanisms of perinatal brain injury. Semin Neonatal. 2000;5:3–16. doi: 10.1053/siny.1999.0112. [DOI] [PubMed] [Google Scholar]
- Khawaja O, Volpe JJ. Pathogenesis of cerebral white matter injury of prematurity. Arch Dis Child Fetal Neonatal Ed. 2008;93:F153–F161. doi: 10.1136/adc.2006.108837. [DOI] [PMC free article] [PubMed] [Google Scholar]
- Eastwood SL, Harrison PJ. Interstitial white matter neuron density in the dorsolateral prefrontal cortex and parahippocampal gyrus in schizophrenia. Schizophr Res. 2005;79:181–188. doi: 10.1016/j.schres.2005.07.001. [DOI] [PubMed] [Google Scholar]
- McQuillen PS, Ferriero DM. Selective vulnerability in the developing central nervous system. Pediatr Neurol. 2004;30:227–235. doi: 10.1016/j.pediatrneurol.2003.10.001. [DOI] [PubMed] [Google Scholar]
- Kostović I, Judaš M, Radoš M, et al. Laminar organization of the human fetal cerebrum revealed by histochemical markers and magnetic resonance imaging. Cereb Cortex. 2002;12:536–544. doi: 10.1093/cercor/12.5.536. [DOI] [PubMed] [Google Scholar]
- Kostovic I, Jovanov-Milosevic N. The development of cerebral connections during the first 20-45 weeks’ gestation. Semin Fetal Neonatal Med. 2006;11:415–422. doi: 10.1016/j.siny.2006.07.001. [DOI] [PubMed] [Google Scholar]
- Ghosh A, Antonini A, McConnell SK, et al. Requirement for subplate neurons in the formation of thalamocortical connections. Nature. 1990;347:179–181. doi: 10.1038/347179a0. [DOI] [PubMed] [Google Scholar]
- Ghosh A, Shatz CJ. Involvement of subplate neurons in the formation of ocular dominance columns. Science. 1992;255:1441–1443. doi: 10.1126/science.1542795. [DOI] [PubMed] [Google Scholar]
- Cioni G, Fazzi B, Coluccini M, et al. Cerebral visual impairment in preterm infants with periventricular leukomalacia. Pediatr Neurol. 1997;17:331–338. doi: 10.1016/s0887-8994(97)00152-5. [DOI] [PubMed] [Google Scholar]
- Lanzi G, Fazzi E, Uggetti C, et al. Cerebral visual impairment in periventricular leukomalacia. Neuropediatrics. 1998;29:145–150. doi: 10.1055/s-2007-973551. [DOI] [PubMed] [Google Scholar]
- Nguyen V, McQuillen PS. AMPA and metabotropic excitoxicity explain subplate neuron vulnerability. Neurobiol Dis. 2010;37:195–207. doi: 10.1016/j.nbd.2009.10.002. [DOI] [PMC free article] [PubMed] [Google Scholar]
- McQuillen PS, Sheldon RA, Shatz CJ, et al. Selective vulnerability of subplate neurons after early neonatal hypoxia-ischemia. J Neurosci. 2003;23:3308–3315. doi: 10.1523/JNEUROSCI.23-08-03308.2003. [DOI] [PMC free article] [PubMed] [Google Scholar]
- Failor S, Nguyen V, Darcy DP, et al. Neonatal cerebral hypoxia-ischemia impairs plasticity in rat visual cortex. J Neurosci. 2010;30:81–92. doi: 10.1523/JNEUROSCI.5656-08.2010. [DOI] [PMC free article] [PubMed] [Google Scholar]
- Hoerder-Suabedissen A, Wang WZ, Lee S, et al. Novel markers reveal subpopulations of subplate neurons in the murine cerebral cortex. Cereb Cortex. 2009;19:1738–1750. doi: 10.1093/cercor/bhn195. [DOI] [PubMed] [Google Scholar]
- Wang WZ, Oeschger FM, Montiel JF, et al. Comparative aspects of subplate zone studied with gene expression in sauropsids and mammals. Cereb Cortex. 2011;21:2187–2203. doi: 10.1093/cercor/bhq278. [DOI] [PubMed] [Google Scholar]
- Oeschger FM, Wang WZ, Lee S, et al. Gene expression analysis of the embryonic subplate. Cereb Cortex. 2012;22:1343–1359. doi: 10.1093/cercor/bhr197. [DOI] [PMC free article] [PubMed] [Google Scholar]
- Towfighi J, Mauger D, Vannucci RC, et al. Influence of age on the cerebral lesions in an immature rat model of cerebral hypoxia-ischemia: a light microscopic study. Brain Res Dev Brain Res. 1997;100:149–160. doi: 10.1016/s0165-3806(97)00036-9. [DOI] [PubMed] [Google Scholar]
- Zeis T, Schaeren-Wiemers N. Lame ducks or fierce creatures? The role of oligodendrocytes in multiple sclerosis. J Mol Neurosci. 2008;35:91–100. doi: 10.1007/s12031-008-9042-1. [DOI] [PubMed] [Google Scholar]
- Hoerder-Suabedissen A, Molnár Z. Molecular diversity of early-born subplate neurons. Cereb Cortex. 2013;23:1473–1483. doi: 10.1093/cercor/bhs137. [DOI] [PubMed] [Google Scholar]
- Sheldon RA, Chuai J, Ferriero DM. A rat model for hypoxic-ischemic brain damage in very premature infants. Biol Neonate. 1996;69:327–341. doi: 10.1159/000244327. [DOI] [PubMed] [Google Scholar]
- Sizonenko SV, Sirimanne E, Mayall Y, et al. Selective cortical alteration after hypoxic-ischemic injury in the very immature rat brain. Pediatr Res. 2003;54:263–269. doi: 10.1203/01.PDR.0000072517.01207.87. [DOI] [PubMed] [Google Scholar]
- Sizonenko SV, Kiss JZ, Inder T, et al. Distinctive neuropathologic alterations in the deep layers of the paruetal cortex after moderate ischemic-hypoxic injury in the P3 immmature rat brain. Pediatr Res. 2005;57:865–872. doi: 10.1203/01.PDR.0000157673.36848.67. [DOI] [PubMed] [Google Scholar]
- Sizonenko SV, Camm EJ, Dayer A, et al. Glial responses to neonatal hypoxic-ischemic injury in the rat cerebral cortex. Int J Dev Neurosci. 2008;26:37–45. doi: 10.1016/j.ijdevneu.2007.08.014. [DOI] [PubMed] [Google Scholar]
- Stadlin A, James A, Fiscus R, et al. Development of a postnatal 3-day-old rat model of mild hypoxic-ischemic brain injury. Brain Res. 2003;993:101–110. doi: 10.1016/j.brainres.2003.08.058. [DOI] [PubMed] [Google Scholar]
- Back SA, Han BH, Luo NL, et al. Selective vulnerability of late oligodendrocyte progenitors to hypoxia-ischemia. J Neurosci. 2002;22:455–463. doi: 10.1523/JNEUROSCI.22-02-00455.2002. [DOI] [PMC free article] [PubMed] [Google Scholar]
- Albrecht J, Hanganu IL, Heck N, Luhmann HJ. In vitro ischemia induced dysfunction in the somatosensory cortex of the newborn rat. Eur J Neurosci. 2005;22:2295–2305. doi: 10.1111/j.1460-9568.2005.04398.x. [DOI] [PubMed] [Google Scholar]
- Logitharajah P, Rutherford MA, Cowan FM. Hypoxic-ischemic encephalopathy in preterm infants: antecedent factors, brain imaging, and outcome. Pediatr Res. 2009;66:222–229. doi: 10.1203/PDR.0b013e3181a9ef34. [DOI] [PubMed] [Google Scholar]
Associated Data
This section collects any data citations, data availability statements, or supplementary materials included in this article.
Supplementary Materials
Regions of quantifications illustrated. (A) Subplate cells were counted on coronal sections taken at the level of anterior corpus callosum in putative somatosensory cortex in a 3.5-mm-long stripe that was 1.5-mm lateral from the midline. (B) Cortical thickness was measured at three positions (dorso-medial, middle, and lateral). The layer V and VI cells were counted in three 0.5-mm radial columns that are indicated with squares in (B).
Cresyl-violet and Nurr1+ staining of the somatosensory cortex after hypoxia–ischemia model 2. Examples of Cresyl-violet-stained sections (A and B) and immunohistochemistry signals of Nurr1+ (C and D) from the ipsi, contralateral hemispheres at P8 after hypoxia–ischemia at P2. There was no apparent variability between the cases of the second model. All hypoxic–ischemic brains had a normal outer appearance and showed normal structural and cellular morphologies of the cortex. All cases in this model were classified as “mild”. Scale bars: 500 μm (A), 1 mm (C).
Supplementary method: Hypoxia–ischemia model 2.