Abstract
Purpose:
To determine the impact of constrained reconstruction techniques on quantitative CT (qCT) of the lung parenchyma and airways for low x-ray radiation dose.
Methods:
Measurement of small airways with qCT remains a challenge, especially for low x-ray dose protocols. Images of the COPDGene quality assurance phantom (CTP698, The Phantom Laboratory, Salem, NY) were obtained using a GE discovery CT750 HD scanner for helical scans at x-ray radiation dose-equivalents ranging from 1 to 4.12 mSv (12–100 mA s current–time product). Other parameters were 40 mm collimation, 0.984 pitch, 0.5 s rotation, and 0.625 mm thickness. The phantom was sandwiched between 7.5 cm thick water attenuating phantoms for a total length of 20 cm to better simulate the scatter conditions of patient scans. Image data sets were reconstructed using STANDARD (STD), DETAIL, BONE, and EDGE algorithms for filtered back projection (FBP), 100% adaptive statistical iterative reconstruction (ASIR), and Veo reconstructions. Reduced (half) display field of view (DFOV) was used to increase sampling across airway phantom structures. Inner diameter (ID), wall area percent (WA%), and wall thickness (WT) measurements of eight airway mimicking tubes in the phantom, including a 2.5 mm ID (42.6 WA%, 0.4 mm WT), 3 mm ID (49.0 WA%, 0.6 mm WT), and 6 mm ID (49.0 WA%, 1.2 mm WT) were performed with Airway Inspector (Surgical Planning Laboratory, Brigham and Women’s Hospital, Boston, MA) using the phase congruency edge detection method. The average of individual measures at five central slices of the phantom was taken to reduce measurement error.
Results:
WA% measures were greatly overestimated while IDs were underestimated for the smaller airways, especially for reconstructions at full DFOV (36 cm) using the STD kernel, due to poor sampling and spatial resolution (0.7 mm pixel size). Despite low radiation dose, the ID of the 6 mm ID airway was consistently measured accurately for all methods other than STD FBP. Veo reconstructions showed slight improvement over STD FBP reconstructions (4%–9% increase in accuracy). The most improved ID and WA% measures were for the smaller airways, especially for low dose scans reconstructed at half DFOV (18 cm) with the EDGE algorithm in combination with 100% ASIR to mitigate noise. Using the BONE + ASIR at half BONE technique, measures improved by a factor of 2 over STD FBP even at a quarter of the x-ray dose.
Conclusions:
The flexibility of ASIR in combination with higher frequency algorithms, such as BONE, provided the greatest accuracy for conventional and low x-ray dose relative to FBP. Veo provided more modest improvement in qCT measures, likely due to its compatibility only with the smoother STD kernel.
Keywords: computed tomography, quantitative analysis, reconstruction, lung
1. INTRODUCTION
Chronic obstructive pulmonary disease (COPD) and asthma related conditions pose an immense burden on the health care community and are expected to be among the leading causes of morbidity and mortality worldwide by 2020.1 Although COPD and asthma related diseases are regarded as being highly treatable afflictions, the prognosis of patients with these conditions is directly correlated to effective methods of early detection of disease.2 COPD, in particular, is characterized by decreased lung function, air trapping, and hyperinflation, primarily due to airway narrowing and/or destruction of the lung parenchyma known as emphysema. Generally, spirometry has been used to assess lung function in patients in order to diagnose pulmonary airflow obstruction, but this method of diagnosis does not depict regional disease and has been shown to be sometimes inconsistent as it depends mainly on patient cooperation during the testing.3 Thus, a regional and potentially more accurate assessment of disease status via direct measurement of airway narrowing has been developed using high resolution computed tomography (CT).4,5
With the advent of multislice helical CT scanners, high resolution x-ray CT has become the standard for pulmonary imaging. Because of currently used hardware, these scanners can provide high temporal, spatial, and contrast resolution of pulmonary structures, including the airways and parenchyma commonly used in the assessment of progression of diseases, such as COPD, cystic fibrosis, and asthma. Typically, the assessment of disease progression is best characterized using measures of the lung parenchymal density and airway wall thickness (WT), lumen diameter (LD), and wall area percentage (WA%) in the third–fifth generation [1–3 mm inner diameter (ID)],6 thus requiring high spatial resolution. For conventional filtered back projection (FBP) reconstruction, the quantitative accuracy of lung CT airway measures has also been shown to be highly dependent on the selection of parameters used for reconstruction of the raw scan data as well as the orientation of the airway measured to the scan plane.7,8 Moreover, due to the fact that the CT studies typically involve multiple lung volumes and multiple time points to characterize longitudinal progression, quantitative airway measurements that require high spatial resolution scans may accrue a relatively high radiation dose for patients to improve spatial resolution while reducing statistical noise. An important challenge in clinical research of early obstructive disease is, then, to obtain accurate quantitative CT (qCT) airway measures with a relatively low x-ray dose protocol.
Some strategies for dose reduction in CT diagnostic image acquisition have been proposed using combinations of automatic exposure control (AEC), noise reduction schemes, and postprocessing algorithms. Among these strategies, reduction of noise via iterative reconstruction (IR) techniques has shown much promise to reduce patient scan dose. In particular, the major CT manufacturers have promoted both statistical and model-based IR (MBIR) methods to mitigate noise in lower dose scans, including the adaptive statistical iterative reconstruction (ASIR, GE Healthcare), IR in image space (IRIS, Siemens Medical), iDose (Philips), and AIDR (Toshiba) techniques. MBIR techniques, such as Veo (GEHC) and SAFIRE (Siemens Medical) have been introduced more recently. ASIR estimates the initial image using FBP of the raw data providing the option to use the full range of density correction kernels in the iterative estimation process. As the iterative reconstruction progresses, fluctuations in quantitative projection measures due to limited photon statistics are taken into account, which iteratively reduces pixel variance for features that are not likely to represent objects in the image, thus decreasing noise in the final image.9,10 The greatest advantage of ASIR for improving spatial resolution is its compatibility with higher frequency reconstruction kernels. Thus, ASIR provides a means to reduce noise while improving spatial resolution using higher frequency kernels that we hypothesize will improve the depiction of airway structures and the accuracy of airway measures. Others have investigated aggressive dose reduction using IR methods in the diagnostic setting.11 However, an optimal choice of CT reconstruction parameters to improve spatial resolution of qCT using lower dose scan protocols in combination with IR techniques has not been investigated. In this work, we explore potential dose reductions of 2–4, while maintaining or improving qCT accuracy for measurement of the airways.
This study first determines the accuracy of current techniques used for qCT of the airways in a published airways phantom (COPDGene12), and then explores the use of well known techniques to improve spatial resolution through higher frequency bandwidth reconstruction kernels and reduced display field of view (DFOV) to improve sampling. However, these approaches normally cannot be supported for FBP of the lungs due to excessive noise amplification. Here, we investigate the best parameters for improved spatial resolution while mitigating noise amplification for ASIR and Veo to assess their ability to retain robustness for qCT and reduced x-ray doses. We hypothesize that a combination of improved spatial resolution with IR approaches will significantly improve the accuracy of airway measures, especially for the smaller (<3 mm diameter) peripheral large airways, and potentially with reduced overall x-ray dose.
2. METHODS
2.A. Airway measurement and analysis
In this work, a free analysis software package, Airway Inspector (Surgical Planning Laboratory at Brigham and Women’s Hospital, Boston, MA), designed to be flexible for research and development allowed for airway measurement without requiring a specific DFOV or reconstruction kernel, was used for all airway measurements.
Single airways were selected, and two different wall detection schemes were used to assess WT, WA%, and inner lumen diameter. These include the full width at half maximum (FWHM),13,14 and single kernel phase congruency15 (SKPC) methods. SKPC has been shown to be a superior method15 to FWHM (Ref. 13) and this result was confirmed in this study. SKPC was therefore used as the preferred edge detection method in this study. From the measures of the inner and outer airway diameters, wall thickness and wall area percentage can then be calculated as
where OD is the outer airway wall diameter.
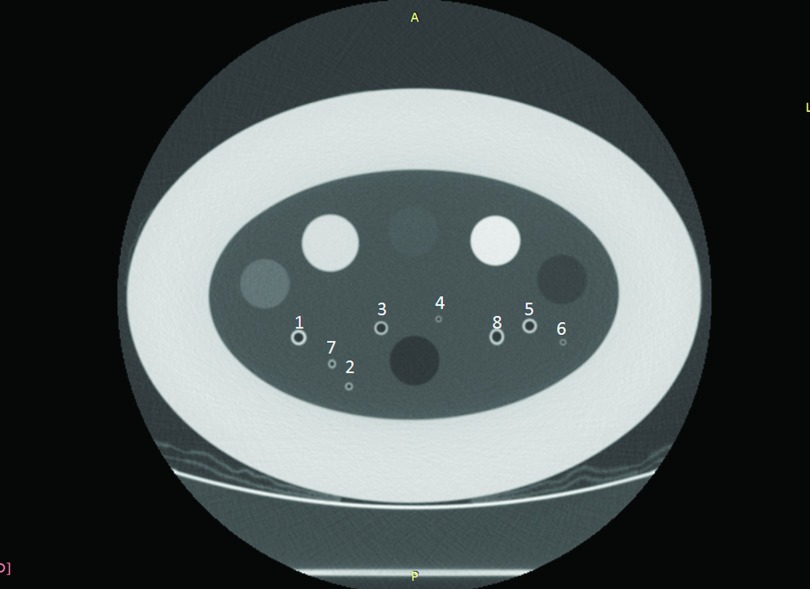
The COPDGene study quality assurance phantom (CTP698; The Phantom Laboratory, Schenectady, NY) contains several polycarbonate plastic tubes of known dimensions to mimic airway structures (Table I). All airways numbered in Fig. 1 were measured to assess accuracy. To simplify presentation, the eight airways were categorized into three sizes to represent typical performance of airway measurement under different conditions: a large size (6 mm in diameter), a medium size (3 mm in diameter), and a small size (2.5 mm in diameter). The two small airways consisted of one axially oriented as well as one oblique oriented airway to assess the effects of partial volume averaging between in-slice spatial resolution and through-slice interpolation using both FWHM and SKPC methods. In each case, the measurement was performed using five adjacent slices, and the resulting measures were obtained by averaging the measures for the individual slices. Plots of the profile across the airways were also performed using FIJI (http://fiji.sc/Fiji) in order to visualize the actual location and contrast of the airway walls relative to the background.
TABLE I.
Airway index and actual dimensions of simulated airways in the COPDGene phantom. * denotes tubes that were oriented at 30° with respect to the axis of the phantom.
| Airway | Actual ID (mm) | Actual WT (mm) | Actual WA% | Actual WA (mm2) | Actual OD (mm) |
|---|---|---|---|---|---|
| 1 | 6 | 1.5 | 55.56 | 19.51 | 9 |
| 2 | 3 | 0.6 | 48.98 | 35.34 | 4.2 |
| 3 | 6 | 0.9 | 40.83 | 19.51 | 7.8 |
| 4 | 2.5 | 0.4 | 42.61 | 3.64 | 3.3 |
| 5 | 6 | 1.2 | 48.98 | 27.14 | 8.4 |
| 6 | 2.5 | 0.4 | 42.61 | 3.64 | 3.3 |
| *7 | 3 | 0.6 | 48.98 | 6.79 | 4.2 |
| *8 | 6 | 1.2 | 48.98 | 27.14 | 8.4 |
FIG. 1.
The numbering scheme of the simulated airways in the COPDGene phantom study is summarized in Table II. Larger cylindrical plugs are variable density foams not used in the present study.
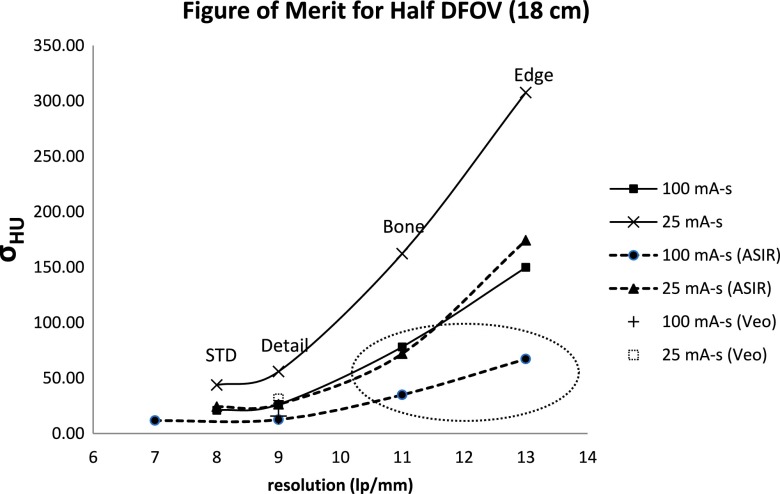
The CATPHAN 600 resolution phantom was used to evaluate performance of the potential combined reconstruction algorithms. Using an appropriate method to decouple the effect of noise to the actual resolution, the spatial resolution in line pairs per millimeter (lp/mm) was measured and recorded for each of the various combinations of reconstruction kernel, DFOV, with and without the use of ASIR. This method involved the summation of images obtained at each dose, equivalent to the total milliamperes second that was used to acquire the images, in order to produce a final image from which the resolution measurement was taken. For example, 20 images at 100 mA s were used, while 80 images were used at 25 mA s. In order to measure the effect of kernel selection and use of ASIR on the noise of the images obtained, a circular region of interest (ROI) was placed at the center of five adjacent images, and the mean standard deviation of the pixel values in Hounsfield units (HU) was recorded as an estimate of image noise. The resulting measures of noise and spatial resolution were then combined to form a figure of merit (FOM) to quantify the tradeoffs between various reconstruction kernels, algorithms, and dose combinations. The goal was to identify the combination with the highest spatial resolution and smallest noise penalty.
To verify applicability in more complex situations, a preliminary study in a swine lung that was held at an inflated volume artificially in situ was done using similar acquisition and reconstruction parameters to those used in the phantom. For this study, lower dose acquisitions were compared to a high dose (395 mA s) acquisition reconstructed using ASIR and the BONE kernel that was used as the reference standard due to lack of an absolute reference standard in the biological model. Airways of similar size (∼3–6 mm inner diameter) to those found in the phantom were selected for analysis.
2.B. CT scanning and reconstruction
Images of the COPDGene phantom and CATPHAN 600 resolution phantom were obtained using a GE discovery CT750 HD scanner. Helical scans were performed at 200, 100, 50, and 25 mA; with beam collimation of 40 mm; tube potential of 120 kVp, pitch of 0.984, rotation speed of 0.5 s, and 0.625 mm slice thickness. These parameters were selected to represent the standard CT acquisition for ongoing qCT imaging studies of lung disease in asthma (Severe Asthma Research Program12 and COPDGene16). The 5 cm thick COPDGene phantom was placed between two 7.5 cm thick phantoms for a total length of 20 cm. This was done to better simulate the scatter conditions of patient scans. The scan data were then reconstructed using both a full DFOV (36 cm) and a half DFOV (18 cm) and slice thickness of 0.5 mm while independently varying the spatial resolution and noise variance using the reconstruction kernel [STANDARD (STD), DETAIL, BONE, and EDGE kernels] and reconstruction algorithm (FBP, 100% ASIR, and Veo). The acquisition and reconstruction parameters for this study are further detailed in Table II.
TABLE II.
Summary of the acquisition and reconstruction parameters used in the study for both CATPHAN and COPDGene phantoms investigated. Images were assessed for all combinations of these parameters.
| Beam collimation (mm) | 40 |
| Pitch | 0.984 |
| Table speed (mm/rot) | 39.37 |
| Recon Kernels | EDGE, BONE, DETAIL, and STANDARD |
| Recon option | FBP, ASIR, and Veo |
| mA s settings | 100, 50, 25, and 12.5 |
| DFOV (cm) | 36, 18 |
3. RESULTS
3.A. Spatial resolution and noise tradeoffs
As spatial resolution (in lp/mm) improves through use of higher bandwidth reconstruction kernels and improved sampling (Fig. 2 and Table III), noise was also observed to increase as expected (Fig. 2). For reduced dose (tube current–time product reduction by a factor of 4), noise decreased by the expected factor of 2 at equivalent reconstruction kernel. Importantly, there are clear inflection points marking increased noise penalty for a given increase in spatial resolution that can be useful for identifying robust operating points for different combinations of dose, reconstruction kernel, and reconstruction algorithm. For example, the ASIR using the EDGE kernel was able to push to higher spatial resolution with only moderate noise increase at 100 mA s. However, ASIR combined with the EDGE kernel led to a dramatic increase in noise standard deviation at 25 mA s and for lower dose generally, making it an unfavorable combination for dose reduction.
FIG. 2.
Figure of merit plot of resolution vs noise from Table III with each point corresponding to a specific reconstruction kernel that increases in frequency bandwidth from left to right. The circled data correspond to the parameter combinations that provide highest spatial resolution and lowest noise for conventional and reduced dose scans. Veo has only one point on the plot due to its compatibility with the STD kernel only.
TABLE III.
Achieved spatial resolution (lp/mm) and noise for FBP and 100% ASIR with 200 mA (100 mA s) and 50 mA (25 mA s) tube currents at half DFOV. Veo measures were similar to that achieved for 100% ASIR, but were only obtained for the STD kernel because of incompatibility with higher frequency kernels. Values are plotted in Fig. 2.
| Recon | Recon kernel | Resolution (1p/mm) | σHU | Recon kernel | Resolution (1p/mm) | σHU |
|---|---|---|---|---|---|---|
| algorithm | 100 mA s | 25 mA s | ||||
| FBP | STD | 8 | 20.95 | STD | 8 | 43.70 |
| DETAIL | 9 | 26.27 | DETAIL | 9 | 55.89 | |
| BONE | 11 | 78.1 | BONE | 11 | 162.23 | |
| EDGE | 13 | 149.85 | EDGE | 13 | 307.63 | |
| ASIR | STD | 8 | 11.69 | STD | 7 | 24.14 |
| DETAIL | 9 | 12.45 | DETAIL | 9 | 26.34 | |
| BONE | 11 | 34.85 | BONE | 11 | 71.97 | |
| EDGE | 13 | 67.2 | EDGE | 13 | 174.29 | |
Based on this analysis in general, ASIR preserved resolution while mitigating noise for higher frequency kernels up to and including the BONE kernel. Although MBIR using the Veo method was anticipated to improve upon statistical IR methods, its incompatibility with higher frequency kernels (smooth standard kernel only) limited achievable spatial resolution compared to ASIR. Based on this analysis, parameter combinations using the BONE kernel were expected to give the highest spatial resolution with acceptable noise and were, therefore, selected to demonstrate improvements in the accuracy of airway measurement using the COPDGene phantom at conventional and reduced x-ray doses.
3.B. Airway measures
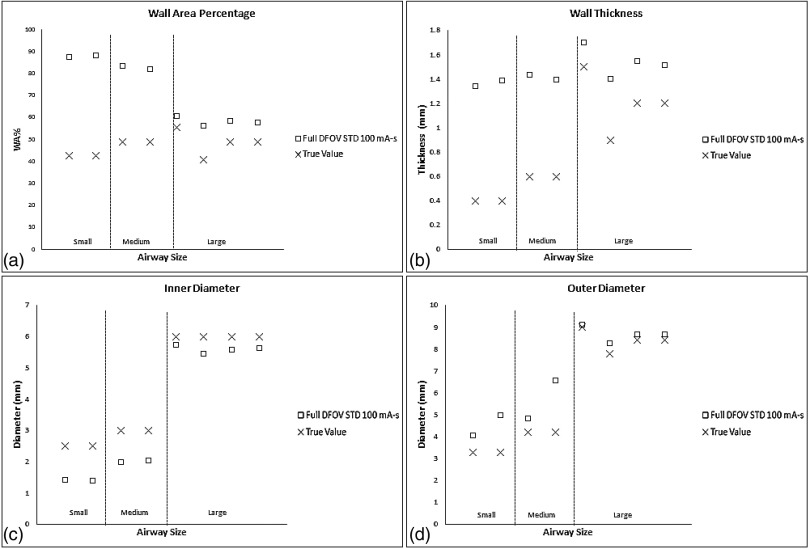
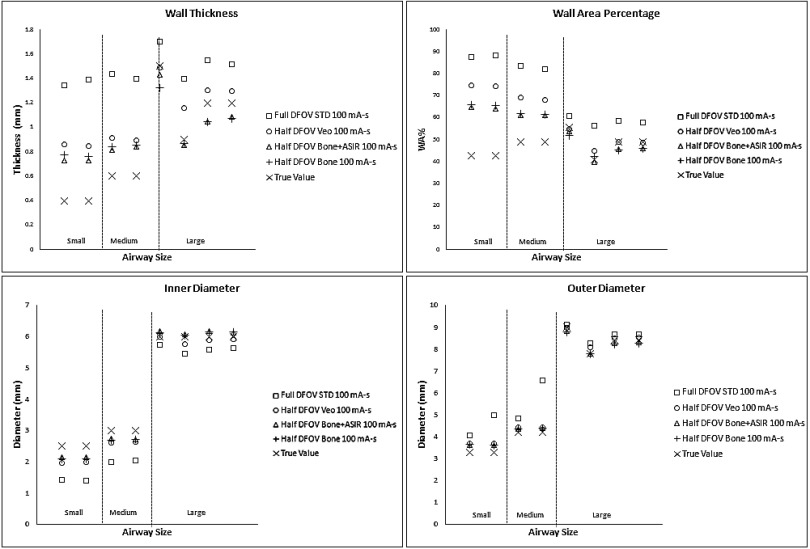
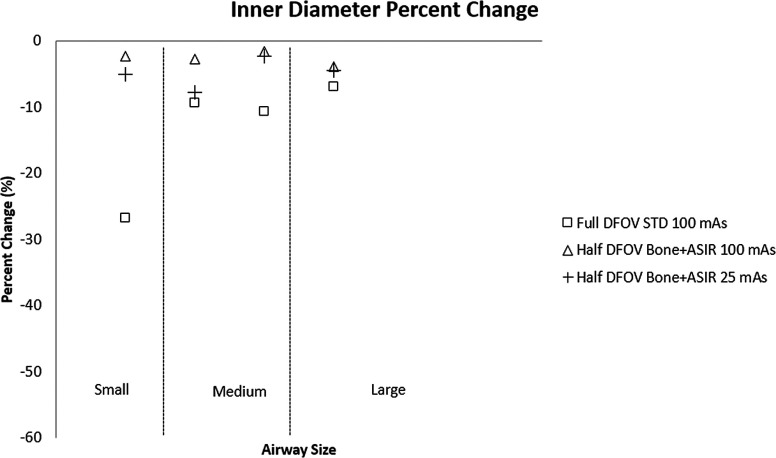
For conventional reconstruction parameters (FBP, 100 mA s, standard kernel, 36 cm DFOV), wall thickness measurements showed the progressive overestimation as airway tube size decreased; this was especially pronounced for medium and small airway dimensions—IDs 3 mm or below. Larger airway tubes—ID 6 mm—were the most accurately measured (Fig. 3). The dominant source of error was under estimation of the inner diameter [Fig. 3(b)]. Comparing the results in Figs. 3 and 4, the limited spatial resolution of the conventional reconstruction, which had a nominal pixel size of about 0.7 mm, is partially overcome by using a half DFOV, nominal pixel size of 0.35 mm, combined with the higher resolution BONE kernel. As predicted by the analysis in Fig. 2, the accuracy of all measures improved by approximately a factor of 2 when using the half DFOV and BONE kernel combination. Additional improvements were observed for combinations that included the ASIR and Veo techniques (Fig. 4), and these improvements were maintained at a quarter (25 mA s) of the x-ray dose (Fig. 5).
FIG. 3.
Baseline performance of airway measures for commonly used reconstruction parameter combinations, full DFOV with the standard kernel, and 100 mA s. (a) Wall thickness (top left), (b) inner diameter (top right), (c) outer diameter (bottom left), and (d) wall area percentage (bottom right). “Small”, “medium”, and “large” airways are defined based on inner diameter of 2.5, 3, and 6 mm, respectively.
FIG. 4.
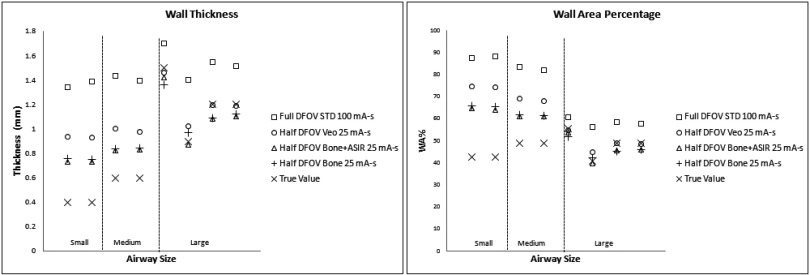
Equivalent dose airway measures for the higher resolution parameter combinations tested. Note that the parameters are determined from the figure of merit summarized in Fig. 2 with representative airways of the small (2.5 mm), medium (3 mm), and large (6 mm) sizes as in Fig. 3. The conventional reconstruction parameters (□) from Fig. 3 are also shown for comparison.
FIG. 5.
Reduced dose airway measures with and without IR for a 25 mA s acquisition—A 4X reduction. The measures are consistently more accurate than conventional reconstruction parameters (□) at full dose again shown for comparison.
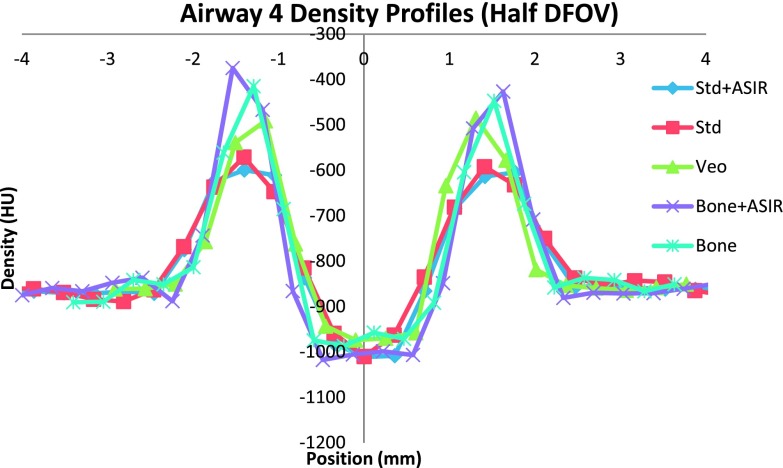
Overall, the combination of half DFOV, BONE, and ASIR (Fig. 5) performed best with respect to absolute reduction in WA% error (up to 50% increase in accuracy), which was most pronounced for the smallest airway [airway 4(−2.5 mm ID, WT = 0.4 mm)] included in the phantom (Tables IV and V). Veo reconstructions showed slight improvement over STD FBP reconstructions (4%–9% increase in accuracy). Improvements in airway measurement accuracy with ASIR and Veo are presumably due to mitigation of noise, as shown in Table III and Fig. 2. For comparison, line profiles across the airway 4 are shown for equivalent half DFOV, but varying reconstruction kernel and algorithm in Fig. 6. Improved wall and inner lumen depiction are demonstrated qualitatively. Note the increased wall density and sharper, more accurate depiction of air densities in the lumen for the BONE + ASIR combination.
TABLE IV.
Inner diameter and WA airway measurements for the smallest, most inaccurately measured airway airway 4(−2.5 mm ID, WT = 0.4 mm) using FBP.
| Recon option | mA s | DFOV (cm) | Recon kernel | Inner diameter (mm) | ID error (%) | WA% | WA% error (%) |
|---|---|---|---|---|---|---|---|
| FBP | 100 | 36 | BONE | 1.7872 | 28.5114 | 77.2157 | 81.2151 |
| STD | 1.5832 | 36.6707 | 83.4498 | 95.8455 | |||
| 100 | 18 | BONE | 2.0981 | 16.0771 | 66.8300 | 56.8412 | |
| STD | 1.7044 | 31.8249 | 80.1656 | 88.1380 | |||
| 25 | 18 | BONE | 2.1301 | 14.7979 | 65.8417 | 54.5216 | |
| STD | 1.7120 | 31.5219 | 79.8636 | 87.4293 |
TABLE V.
Inner diameter and WA airway measurements for airway 4 (−2.5 mm ID, WT = 0.4 mm) using iterative reconstruction techniques showing marked decrease in error when using BONE + ASIR, even at a quarter of the dose.
| Recon option | mA s | DFOV (cm) | Recon kernel | Inner diameter (mm) | ID error (%) | WA% | WA% error (%) |
|---|---|---|---|---|---|---|---|
| IR | 100 | 36 | BONE + ASIR | 1.8209 | 27.1621 | 76.29 | 79.0419 |
| Veo | 1.6582 | 33.6700 | 89.41 | 89.4117 | |||
| 100 | 18 | BONE + ASIR | 2.1480 | 14.0810 | 64.5930 | 51.5912 | |
| Veo | 1.9759 | 20.9655 | 71.3630 | 67.4796 | |||
| 25 | 18 | BONE + ASIR | 2.1503 | 13.9880 | 64.6649 | 51.7599 | |
| Veo | 1.8157 | 27.3735 | 76.8657 | 80.3935 |
FIG. 6.
A line profile across the smallest airway (airway 4) depicting more pronounced wall signal from BONE + ASIR, allowing for better edge detection. Data shown were acquired at 100 mA s.
For completeness, our analysis also includes verification of improved accuracy for oblique oriented airways. Airways 7 and 2, which are of the same dimensions but oblique vs axially oriented, respectively, are compared in Table VI. Note that measures are consistent between both airways and consistent with the trends shown in Fig. 4.
TABLE VI.
Comparison of axially oriented tubes (airway 2) vs nonaxially oriented tubes (airway 7). Data reported were acquired at 100 mA s.
| Recon kernel | Airway number | Inner diameter (mm) | WT (mm) | WA% |
|---|---|---|---|---|
| BONE | 2 | 2.7016 | 0.8407 | 62.00 |
| 7 | 2.6921 | 0.8595 | 62.73 | |
| BONE + ASIR | 2 | 2.7414 | 0.8160 | 60.70 |
| 7 | 2.7223 | 0.8423 | 61.81 |
Initial measurements in the swine lung (Fig. 7) show promising results that these techniques are feasible in the more complex structure of the lungs. Airways of similar size (∼3–6 mm inner diameter) to those in the phantom show values that are more consistent with the high dose reference measures, especially at the smallest airway sizes and dimensions.
FIG. 7.
Preliminary measurements in a swine lung, which show similar results as was shown in the phantom study.
4. DISCUSSION
Current techniques in airway analysis typically involve acquisition of patient data with reconstruction parameters that include use of a relatively smooth standard kernel, with the FBP algorithm at a DFOV sufficient to cover the entire lung volume (full DFOV). With the typical display matrix size of 512 × 512, both of these conditions limit achievable in-slice spatial resolution, the former by low-pass filtering of the raw projection data and the latter by increasing the sampled voxel size in the image. This work confirmed relatively large inaccuracies in wall measures using current reconstruction parameters and techniques,12,17,18 especially for smaller airways (<3 mm ID) as shown in Fig. 4 and Table IV. More importantly, significant improvements, on the order of 40%–50%, in the accuracy of WT, LD, and WA% measurements were realized in this work by combining higher frequency kernels with reduced DFOV reconstructions, techniques that can be applied across any platform, compared to current methods.
An important reason for using lower resolution reconstruction parameters is to conform to the requirements of automated segmentation and analysis tools. After reconstruction, the CT images are usually reformatted in automated airway segmentation and analysis packages, such as Pulmonary Workstation from Vida Diagnostics (VIDA, Iowa City, IA) or similar prototype automated software packages for qCT lung analysis (for example, http://www.mevis.fraunhofer.de/en/solutions/quantitative-lung-ct-analysis-for-copd.html, Fraunhofer MEVIS, Breman, Germany). Generally, a 3D model of the lung is generated and airway branch segments are automatically identified so that further measurement analysis of airway segments can be performed. In practice, these analysis tools are limited to use of full DFOV to include the entire thoracic lung volume and smooth reconstruction kernels to reduce the effect of noise on airway segmentation which depends on region growing along contiguous airway paths.19
However, it has been recognized for some time that high resolution CT measurement of the airways does not provide enough accuracy to reliably characterize early and/or progressive obstructive lung disease in the more distal (∼2 mm ID) airway segments.13,14,20,22 Strategies employed in this study, such as reduction of reconstructed DFOV, use of higher frequency kernels, and use of noise mitigating iterative techniques such as Veo and ASIR, were developed and tested in a well-characterized airway phantom with known airway tube dimensions. Specific combinations of reconstruction parameters were shown to be much more accurate. In particular, the BONE kernel with 100% ASIR at a half DFOV provided the most accurate measures for all airways, improving accuracy by a factor of 2 over currently used techniques even at a quarter of the dose. To a less dramatic degree, reduced DFOV with Veo also improved measures (4%–9% increase in accuracy), but Veo was constrained by its inflexibility with respect to choice of reconstruction kernel. ASIR, in general, provided more flexibility in terms of compatibility with higher resolution kernels and showed promise in this study for application in human airway analysis.
Several limitations of the current technique present remaining challenges for translation. While the COPDGene phantom is a useful tool, the contrast conditions of the airways relative to the foam in the background only approximate that of lung. Although the phantom is simplistic in nature, it is worth noting if a procedure does not work in a simple situation it should not be expected to work in complex situations. The simplicity of the phantom provides a bound on performance for more complicated situations such as the lungs where the texture of the parenchyma, blood vessels, and airways are overlapping and admittedly more complicated in structure than the phantom used in the present work.21 Many important structures that may confound the results demonstrated are missing, including vascular structures, atelectasis, and other obstructive pathologies affecting lung density may complicate IR methods. Also, using a reduced DFOV may be problematic in patient because it truncates other branches of the airway tree, although a reconstruction algorithm designed to produce larger matrix sizes, and, thus, smaller pixel dimensions could easily remedy this problem. In addition, the analysis method used in this work requires manual selection of the airways to be measured, which is user intensive. However, several targeted methods of airway measurement have been proposed22 and may be viable to reduce the number of airways to be measured in the clinical research setting. Moreover, automated approaches to vascular tree segmentation using random seeds23 do not depend on complete continuity of the tree to perform region growing segmentation and, thus, may be readily adapted for automated segmentation and measurement of airways using limited FOV approaches.
In summary, using the BONE + ASIR at half DFOV technique, airway measures were shown to improve by a factor of 2 relative to the commonly used STD + FBP combination even at a quarter of the x-ray dose. This combination, and analogous combinations of kernel and IR for other vendors (i.e., Siemens’ B75f + IRIS24), can potentially improve airway measurements for distal airways in clinical research studies of early and progressive obstructive lung disease.
ACKNOWLEDGMENT
NIBIB-PB-EB-1010-159-JKS “Recovery-Quantitative Imaging Biomarker Alliance (QIBA);” NIH/NHLBI U10 HL109168. The Science and Medicine Research Scholars Fellowship.
REFERENCES
- 1.Lopez A. D., Mathers C. D., Ezzati M., Jamison D. T., and Murray C. J., “Global and regional burden of disease and risk factors, 2001: Systematic analysis of population health data,” Lancet 367, 1747–1757 (2006). 10.1016/S0140-6736(06)68770-9 [DOI] [PubMed] [Google Scholar]
- 2.Vestbo J.et al. , “Global strategy for the diagnosis, management and prevention of chronic obstructive pulmonary disease, GOLD executive summary,” Am. J. Respir. Crit. Care Med. 187, 347–365 (2013). 10.1164/rccm.201204-0596PP [DOI] [PubMed] [Google Scholar]
- 3.Aaron S. D., Dales R. E., and Cardinal P., “How accurate is spirometry at predicting restrictive pulmonary impairment?,” Chest 115, 869–873 (1999). 10.1378/chest.115.3.869 [DOI] [PubMed] [Google Scholar]
- 4.Nakano Y.et al. , “Quantitative assessment of airway remodeling using high-resolution CT,” Chest 122(6 suppl.), 271S–275S (2002). 10.1378/chest.122.6_suppl.271S-a [DOI] [PubMed] [Google Scholar]
- 5.Orlandi I.et al. , “Chronic obstructive pulmonary disease: Thin-section CT measurement of airway wall thickness and lung attenuation1,” Radiology 234(2), 604–610 (2005). 10.1148/radiol.2342040013 [DOI] [PubMed] [Google Scholar]
- 6.Nakano Y., Wong J. C., de Jong P. A., Buzatu L., Nagao T., Coxson H. O., and Paré P. D., “The prediction of small airway dimensions using computed tomography,” Am. J. Respir. Crit. Care Med. 171(2), 142–146 (2005). 10.1164/rccm.200407-874OC [DOI] [PubMed] [Google Scholar]
- 7.Conradi S. H., Lutey B. A., Atkinson J. J., Wang W., Senior R. M., and Gierada D. S., “Measuring small airways in transverse CT images: Correction for partial volume averaging and airway tilt,” Acad. Radiol. 17(12), 1525–1534 (2010). 10.1016/j.acra.2010.08.005 [DOI] [PMC free article] [PubMed] [Google Scholar]
- 8.Hsieh J., “Analytical models for multi-slice helical CT performance parameters,” Med. Phys. 30, 169–178 (2003). 10.1118/1.1533750 [DOI] [PubMed] [Google Scholar]
- 9.Judy P. F. and Jacobson F. L., “Evaluation of segmentation using lung nodule phantom CT images,” Proc. SPIE 4322, 1393–1398 (2001). 10.1117/12.431020 [DOI] [Google Scholar]
- 10.Marin D., Nelson R. C., Schindera S. T., Richard S., Youngblood R. S., Yoshizumi T. T., and Samei E., “Low-tube-voltage, high-tube-current multidetector abdominal CT: Improved image quality and decreased radiation dose with adaptive statistical iterative reconstruction algorithm—Initial clinical experience,” Radiology 254(1), 145–153 (2010). 10.1148/radiol.09090094 [DOI] [PubMed] [Google Scholar]
- 11.McCollough C. H., Chen G. H., Kalender W., Leng S., Samei E., Taguchi K., and Pettigrew R. I., “Achieving routine submillisievert CT scanning: Report from the summit on management of radiation dose in CT,” Radiology 264(2), 567–580 (2012). 10.1148/radiol.12112265 [DOI] [PMC free article] [PubMed] [Google Scholar]
- 12.Aysola R. S., Hoffman E. A., Gierada D., Wenzel S., Cook-Granroth J., Tarsi J., and Castro M., “Airway remodeling measured by multidetector CT is increased in severe asthma and correlates with pathology,” Chest 134(6), 1183–1191 (2008). 10.1378/chest.07-2779 [DOI] [PMC free article] [PubMed] [Google Scholar]
- 13.Reinhardt J. M., D’Souza N., and Hoffman E. A., “Accurate measurement of intrathoracic airways,” IEEE Trans. Med. Imaging 16(6), 820–827 (1997). 10.1109/42.650878 [DOI] [PubMed] [Google Scholar]
- 14.Amirav I., Kramer S. S., Grunstein M. M., and Hoffman E. A., “Assessment of methacholine-induced airway constriction by ultrafast high-resolution computed tomography,” J. Appl. Physiol. 75(5), 2239–2250 (1993). [DOI] [PubMed] [Google Scholar]
- 15.Estépar R. S. J., Washko G. G., Silverman E. K., Reilly J. J., Kikinis R., and Westin C. F., “Accurate airway wall estimation using phase congruency,” in Medical Image Computing and Computer-Assisted Intervention–MICCAI 2006 (Springer, Berlin, Heidelberg, 2006), pp. 125–134. [DOI] [PubMed] [Google Scholar]
- 16.Sieren J. P., J. D. Newell, Jr., Judy P. F., Lynch D. A., Chan K. S., Guo J., and Hoffman E. A., “Reference standard and statistical model for intersite and temporal comparisons of CT attenuation in a multicenter quantitative lung study,” Med. Phys. 39(9), 5757–5767 (2012). 10.1118/1.4747342 [DOI] [PMC free article] [PubMed] [Google Scholar]
- 17.Kim W. J., Silverman E. K., Hoffman E., Criner G. J., Mosenifar Z., Sciurba F. C., and Washko G. R., “CT metrics of airway disease and emphysema in severe COPD,” Chest 136(2), 396–404 (2009). 10.1378/chest.08-2858 [DOI] [PMC free article] [PubMed] [Google Scholar]
- 18.Washko G. R., Dransfield M. T., Estépar R. S. J., Diaz A., Matsuoka S., Yamashiro T., and Reilly J. J., “Airway wall attenuation: A biomarker of airway disease in subjects with COPD,” J. Appl. Physiol. 107(1), 185–191 (2009). 10.1152/japplphysiol.00216.2009 [DOI] [PMC free article] [PubMed] [Google Scholar]
- 19.Tschirren J., Hoffman E. A., McLennan G., and Sonka M., “Intrathoracic airway trees: Segmentation and airway morphology analysis from low-dose CT scans,” IEEE Trans. Med. Imaging 24(12), 1529–1539 (2005). 10.1109/TMI.2005.857654 [DOI] [PMC free article] [PubMed] [Google Scholar]
- 20.King G. G., Muller N. L., Whittall K. P., Xiang Q. S., and Pare P. D., “An analysis algorithm for measuring airway lumen and wall areas from high-resolution computed tomographic data,” Am. J. Respir. Crit. Care Med. 161(2), 574–580 (2000). 10.1164/ajrccm.161.2.9812073 [DOI] [PubMed] [Google Scholar]
- 21.Estépar R. S. J., Ross J. C., Russian K., Schultz T., Washko G. R., and Kindlmann G. L., “Computational vascular morphometry for the assessment of pulmonary vascular disease based on scale-space particles,” in 9th IEEE International Symposium on Biomedical Imaging (ISBI), May, 2012 (IEEE, Piscataway, NJ, 2012), pp. 1479–1482. [DOI] [PMC free article] [PubMed] [Google Scholar]
- 22.Dattawadkar A., Samimi K., Jarjour N. N., Busse W. W., Fain S. B., and Peterson E. T., “Airway measures on MDCT in asthma at locations of ventilation defect identified by He-3 MRI,” Am. J. Respir. Crit. Care Med. 181 , A3958 (2010). 10.1164/ajrccm [DOI] [Google Scholar]
- 23.Solomon J. B., Christianson O., and Samei E., “Quantitative comparison of noise texture across CT scanners from different manufacturers,” Med. Phys. 39(10), 6048–6055 (2012). 10.1118/1.4752209 [DOI] [PubMed] [Google Scholar]
- 24.Silva A. C., Lawder H. J., Hara A., Kujak J., and Pavlicek W., “Innovations in CT dose reduction strategy: Application of the adaptive statistical iterative reconstruction algorithm,” Am. J. Roentgenol. 194(1), 191–199 (2010). 10.2214/AJR.09.2953 [DOI] [PubMed] [Google Scholar]


