Abstract
Purpose:
Motion artifacts are common in patient four-dimensional computed tomography (4DCT) images, leading to an ill-defined tumor volume with large variations for radiotherapy treatment and a poor foundation with low imaging fidelity for studying respiratory motion. The authors developed a method to estimate 4DCT image quality by establishing a correlation between the severity of motion artifacts in 4DCT images and the periodicity of the corresponding 1D respiratory waveform (1DRW) used for phase binning in 4DCT reconstruction.
Methods:
Discrete Fourier transformation (DFT) was applied to analyze 1DRW periodicity. The breathing periodicity index (BPI) was defined as the sum of the largest five Fourier coefficients, ranging from 0 to 1. Distortional motion artifacts (excluding blurring) of cine-scan 4DCT at the junctions of adjacent couch positions around the diaphragm were classified in three categories: incomplete, overlapping, and duplicate anatomies. To quantify these artifacts, discontinuity of the diaphragm at the junctions was measured in distance and averaged along six directions in three orthogonal views. Artifacts per junction (APJ) across the entire diaphragm were calculated in each breathing phase and phase-averaged , defined as motion-artifact severity (MAS), was obtained for each patient. To make MAS independent of patient-specific motion amplitude, two new MAS quantities were defined: MASD is normalized to the maximum diaphragmatic displacement and MASV is normalized to the mean diaphragmatic velocity (the breathing period was obtained from DFT analysis of 1DRW). Twenty-six patients’ free-breathing 4DCT images and corresponding 1DRW data were studied.
Results:
Higher APJ values were found around midventilation and full inhalation while the lowest APJ values were around full exhalation. The distribution of MAS is close to Poisson distribution with a mean of 2.2 mm. The BPI among the 26 patients was calculated with a value ranging from 0.25 to 0.93. The DFT calculation was within 3 s per 1DRW. Correlations were found between 1DRW periodicity and 4DCT artifact severity: −0.71 for MASD and −0.73 for MASV. A BPI greater than 0.85 in a 1DRW suggests minimal motion artifacts in the corresponding 4DCT images.
Conclusions:
The breathing periodicity index and motion-artifact severity index are introduced to assess the relationship between 1DRW and 4DCT. A correlation between 1DRW periodicity and 4DCT artifact severity has been established. The 1DRW periodicity provides a rapid means to estimate 4DCT image quality. The rapid 1DRW analysis and the correlative relationship can be applied prospectively to identify irregular breathers as candidates for breath coaching prior to 4DCT scan and retrospectively to select high-quality 4DCT images for clinical motion-management research.
Keywords: 4DCT image quality, motion artifacts, respiratory surrogate, radiotherapy
1. INTRODUCTION
Four-dimensional computed tomography (4DCT) based on respiratory correlation is widely applied in radiation oncology to define the internal tumor volume (ITV) for thoracic and abdominal lesions.1 The ITV approach is simple and effective in treating a moving target but often exposes normal tissue along the tumor motion path to the full prescribed dose. Tumor motion tracking or 4D radiotherapy (4DRT)2,3 is a solution that spares normal tissue by focusing the radiation beam on the target volume. However, due to the presence of motion artifacts in 4DCT, the delineated gross tumor volumes in different breathing phases can vary by up to 90%4 –110%,5,6 especially for small lesions with large motion ranges. This variation may affect the defined ITV, particularly if the artifact occurs at the extreme respiratory phases, such as the full inhalation phase that is known for irreproducibility.7 When considering 4DRT treatment planning,6,8 scan artifacts in all respiratory phases are expected to have similar impact on the planning target volume, leading to greater treatment uncertainties.
Motion artifacts in clinical 4DCT images were previously reported as common phenomena since patients rarely breathe reproducibly.7,9–12 These artifacts cause anatomical distortion, resulting from breathing irregularities during 4DCT scans. In a cine scan, breathing irregularity occurring within one bed position breathing may cause blurring artifacts, since image projections from a narrow range of time points are binned into phases based on a respiratory motion surrogate. From one bed scan to the next, breathing irregularities cause discontinuity of the 4DCT image at the junction, leading to such artifacts as incomplete, overlapping, and duplicate anatomies, which are much pronounced than motion blurring.13 A patient study consisting of 50 clinical 4DCT images of the thorax and abdomen showed that 90% of these images contained at least one motion artifact with a mean magnitude of 12 mm.13 Because breathing irregularities produce most of motion artifacts using the binning method, the motion artifacts in respiratory-correlated 4DCT are often referred as binning artifacts.14,15
As a result of recognizing the severity and frequency of motion artifacts and realizing the importance of artifact reduction for both current and future clinical needs, effort has been devoted to correcting or minimizing binning-associated artifacts. Such studies include the use of internal, feature-based, or multipoint motion surrogates for binning16–18 or of using direction-dependent displacement or the motion velocity for binning.19–21 Other studies correct motion artifacts by modeling respiratory motion with deformable image registration22–26 or probability density functions.15 More recently, advanced CT scanners, such as 64-slice fan-beam or 320-slice cone-beam CT scanners,15,22 have been developed; these circumvent some binning artifacts with a shorter rotation time and a longitudinally widened 4D scan volume. However, these methods are not yet implemented in most clinics.
In this study, we report a correlative relationship between motion artifacts and breathing irregularities. Two new indexes are introduced to quantify the motion-artifact severity (MAS) in 4DCT images and the breathing periodicity index (BPI) of the 1D respiratory waveform (1DRW), which is the respiratory surrogate used for retrospective binning. Twenty-six free-breathing 4DCT images and corresponding 1DRW curves were studied by manual measurement of the MAS and by using discrete Fourier transformation (DFT) method to calculate the BPI, respectively. The established correlation could be used as to anticipate image quality from a breathing trace acquired prior to 4DCT scanning or to further develop a gated 4DCT scanning to suspend image acquisition during periods of irregular breathing.
2. METHODS AND MATERIALS
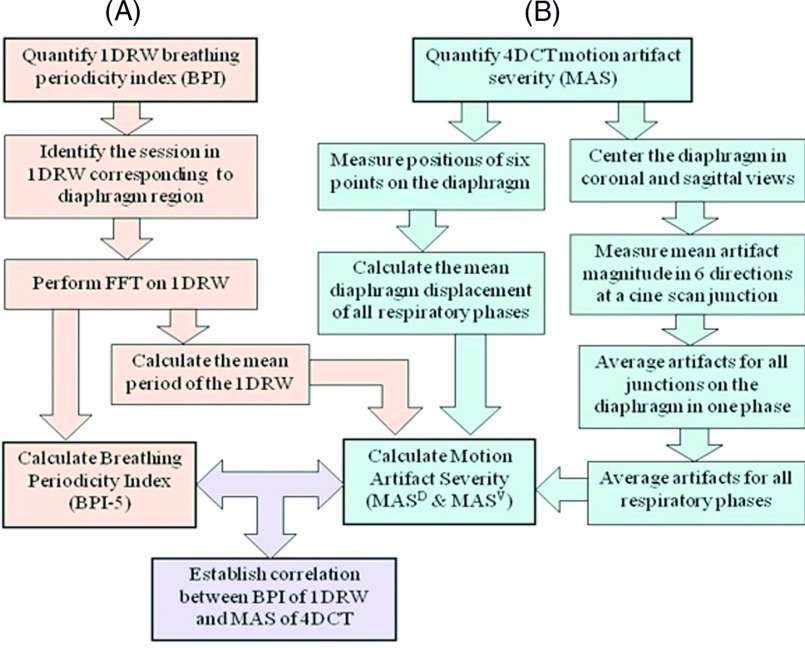
Twenty-six patients who had received a 4DCT during quiet unprompted breathing at simulation for radiotherapy of thoracic and abdominal lesions were selected for this study. The images were acquired in cine mode using an 8-slice CT scanner (Discovery, GE Healthcare, Milwaukee, WI) and using real-time position management system (RPM, Varian Oncology Systems, Palo Alto, CA) as an 1DRW surrogate. These images were binned into ten phases using proprietary software (GE Advantage PET/CT Simulator). In this study, only the motion artifacts around the diaphragm are reported. Figure 1 shows the workflow diagram used to quantify motion-artifact severity in the phase-binned images, the periodicity of the RPM breathing trace, and their correlation.
FIG. 1.
Workflow diagram quantifying BPI in the 1DRW (A) and MAS in the 4DCT (B): MASD is the MAS normalized to the maximum diaphragm displacement, and MASV is the MAS normalized to mean diaphragmatic velocity.
2.A. Fourier analysis for 1DRW (RPM) periodicity
The time range of the RPM (1DRW) curve was selected from the entire breathing trace to correspond to the bed positions, in which the diaphragm was scanned in all breathing phases. The superior–inferior locations of the diaphragm within 4DCT field of view were used to select the corresponding RPM time range. Fourier analysis on the selected breathing trace was used to obtain the BPI. Mathematically, a 1DRW was considered as a 1D n-element array v, which was processed to remove its constant component by subtracting its mean: v = v − mean(v). After Fourier transformation, the Fourier coefficients of v were sorted by absolute magnitude in a descending order as F(i), i = 1, 2, …, m. The BPI is defined as
| (1) |
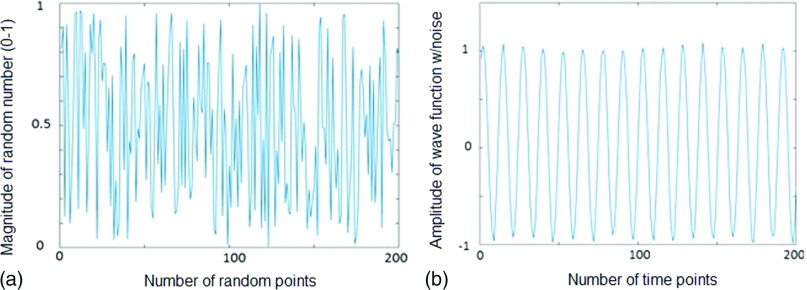
namely, it is defined as the ratio of the energy (F(i)2) of the largest five Fourier components (BPI-5) to the total Fourier energy. In this study, k was defaulted to five and BPI was defaulted to BPI-5. BPI value ranges from 0 to 1. Based on Parseval’s theorem, , as the energy of the zero-mean array v is conserved by Fourier transformation. Thus, BPI-5 quantifies how closely the first five Fourier components represent the original array v (1DRW). For a highly periodic function, the corresponding BPI is close to one. Conversely, the energies of a nonperiodic function are scattered over a far wider spectral domains and the associated BPI-5 should be small. Figure 2 illustrates the difference between a nonperiodic function (BPI-5 = 0.18) and a periodic sinusoidal function (BPI-5 = 0.95) with minor noise.
FIG. 2.
Demonstration of BPI-5 [the breathing periodicity index is defined in Eq. (1) with k = 5] for a nonperiodic and a periodic function. (a) A nonperiodic function composed of 200 random numbers (BPI-5 = 0.18). (b) A periodic sinusoidal wave function with minor noise (BPI-5 = 0.95).
In addition to BPI-5, other BPI-k (k = 2 to 8) were evaluated, including Pearson correlation among themselves and the trend of BPI-k values as a function of k. BPI-5 was used to study the correlation with the MAS from the phase-binned 4DCT.
From the Fourier analysis, the mean breathing period () was calculated as below.
| (2) |
where the total number of samples (N), sampling rate (fs), and the index of the dominant Fourier coefficient (cF) in Fourier frequency spectrum were used. The period was used to calculate the mean velocity of the diaphragm during respiration. The Fourier analysis program, which can process all 1DRW data files in batch mode, was implemented in matlab on a desktop computer (Windows XP, Core duo CPU E8500 at 3.1 GHz with 2 GB of RAM).
2.A.1. Estimation of mean diaphragmatic displacement and velocity
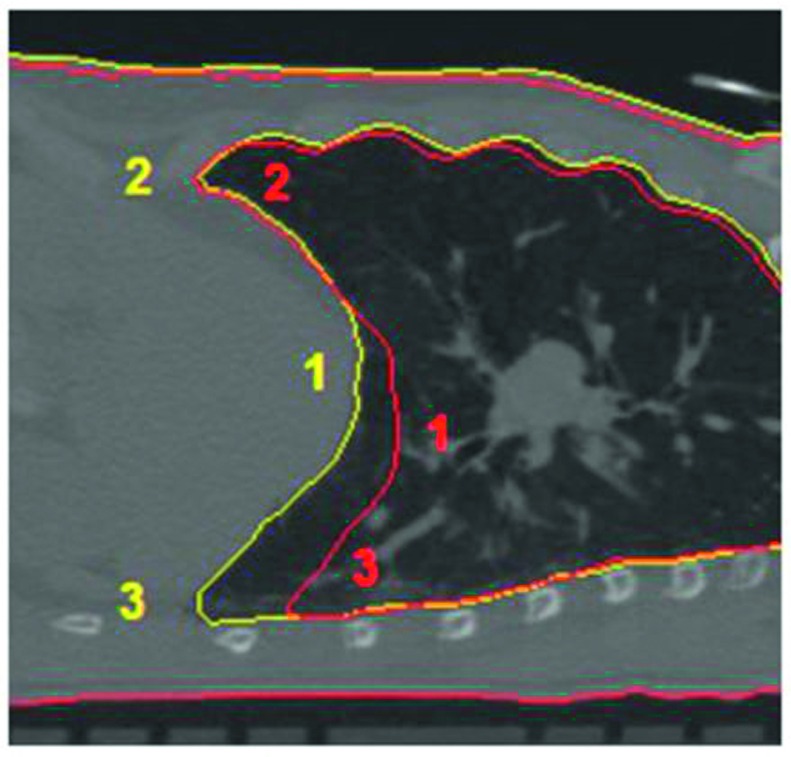
The mean diaphragm location was determined by using six pivot points on the diaphragm in each of the ten phases.27 Three points on the right and left sides of the diaphragm were measured; these points were chosen to be the most inferior points at the anterior and posterior sides of the diaphragm, and the most superior point at apex point of the diaphragmatic dome (Fig. 3). The maximum diaphragm displacement between the full exhalation (FE) and full inhalation (FI) phases was calculated () and the mean diaphragmatic velocity () was the divided by the mean period ()
| (3) |
| (4) |
where Z represents the superior–inferior position of the six points, FE is 50% phase and FI is averaged between 0% and 90% phases.
FIG. 3.
Illustration of three pivot points on one lateral side of the diaphragm. Six points in total on both sides of the diaphragms were measured to define the mean diaphragm position. This image shows a respiratory phase (yellow) and the full exhalation (red) as the reference phase.
These patient-specific motion parameters were used to “normalize” the MAS, which minimized patient specificity and allowed motion artifact comparability among patients.
2.B. Measurement of motion artifacts in 4DCT images
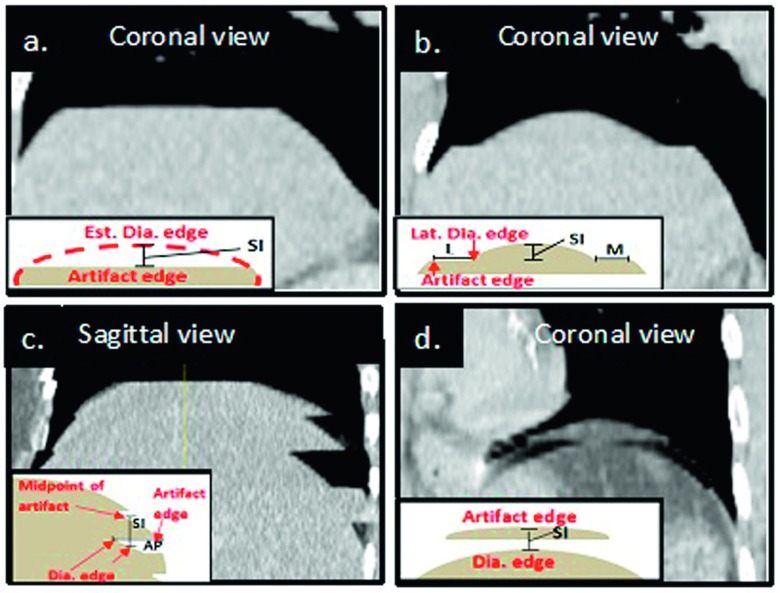
Motion artifacts in 4DCT were visually identified and manually quantified using an in-house treatment planning system (TPS) following the procedure in Fig. 1. In cine 4DCT images, motion artifacts that distort the diaphragmatic appearance at the junction between two bed positions were identified and categorized into three groups: incomplete [INC, Figs. 4(a) and 4(b)], overlapping [OVE, Fig. 4(c)], and duplicate [DUP, Fig. 4(d)]. Within images acquired at a single bed position, motion blurring was observed but not included in this study.
FIG. 4.
Three typical appearances of distortional motion artifacts in cine-scan 4DCT images: (a) and (b) INC, (c) OVE, and (d) DUP. Within each image, in the left lower quadrant, lies the associated method of measurement of each artifact (S = superior, P = posterior, L = lateral, and M = medial). Note that in an INC artifact, where the artifact edge is flat with no associated dome, only the S measurement was taken into account (a). When an INC artifact was associated with a dome the S, L, and M measurements were recorded (b). In an OVE artifact the S and P measurement were taken (c) and within duplicate artifacts only the superior measurement was recorded (d).
Starting with respiratory phase 0% (full inhalation), all motion artifacts were measured in three orthogonal planar images. At a 2-bed junction in the axial view, a crosshair was placed at the center of the diaphragm. Within the sagittal and coronal views, corresponding to the crosshair cuts, discontinuities due to the artifacts were clearly seen, as shown in Fig. 4. Within this fixed location, all artifact magnitudes were measured in the superior–inferior (SI), anterior–posterior (AP), and medial–lateral (ML) directions. Because of asymmetry of the diaphragm and its motion (Figs. 3 and 4), discontinuities measured may not be the maximum amplitude of the artifacts. This procedure was applied consistently to every junction in the diaphragmatic range on both sides of the diaphragm. If no artifact was observed at a particular scan junction, the artifact amplitude was set to zero in calculating the average artifact per junction (APJ). Upon completion of the 0% phase image, the process was repeated for the remaining phase (10%–90%) images.
The magnitudes of each artifact in the SI, AP, and ML directions were recorded as follows: For INC and DUP artifacts, the SI magnitude, or the distance between the actual edge of the artifact and visually estimated edge without artifact, was measured with the “ruler” tool of the TPS and recorded as distance (cm) [Figs. 4(a), 4(b), and 4(d)]. For OVE artifacts, the SI magnitude was measured as the distance from the midpoint of the artifact to the inferior diaphragmatic edge [Fig. 4(c)]. The AP and ML magnitudes were measured from the edge of the diaphragm to the end of the artifact [Figs. 4(b) and 4(c)].
2.C. Quantification of MAS
The magnitudes of artifacts in the SI, AP, and ML directions in coronal and sagittal images were averaged at each scan junction on both lateral sides of the diaphragm. Within the longitudinal scan range of the diaphragm, APJ were calculated for each respiratory phase. The MAS was defined as the averaged (in cm) among all respiratory phases (n = 10).
| (5) |
The MAS depends not only on breathing irregularity but also on patient-specific diaphragm motion amplitude. Therefore, to make MAS depend solely upon the breathing irregularity, two normalized MAS indexes were introduced to the maximum diaphragmatic displacement and the diaphragmatic velocity, defined in Eqs. (6) and (7).
-
(a)MASD is MAS normalized to maximum diaphragmatic displacement [Eq. (3)]
(6) -
(b)MASV is MAS normalized to mean diaphragmatic velocity [Eq. (4)]
(7)
These three motion-artifact severities (MAS, MASD, and MASV) were analyzed and correlated to the periodicity (BPI-5) of the corresponding 1DRW.
2.D. Correlation analysis between BPI in 1DRW and MAS in 4DCT
The Pearson correlation coefficient (r), defined as the covariance (cov) of two variables divided by individual standard deviation (σ), was used to quantify the linear relationship between BPI and MAS values, namely,
| (8) |
where MAS can also be MASD or MASV. This equation was also used to check the correlations among BPI-5, BPI-4, and BPI-3, and among MAS, MASD, and MASV.
For linear fitting of two variables (BPI, MAS), in which both variables contain non-negligible uncertainties, singular value decomposition (SVD) was applied to treat BPI and MAS equally in the total least-square linear regression.
3. RESULTS
3.A. Phase-dependent motion artifacts
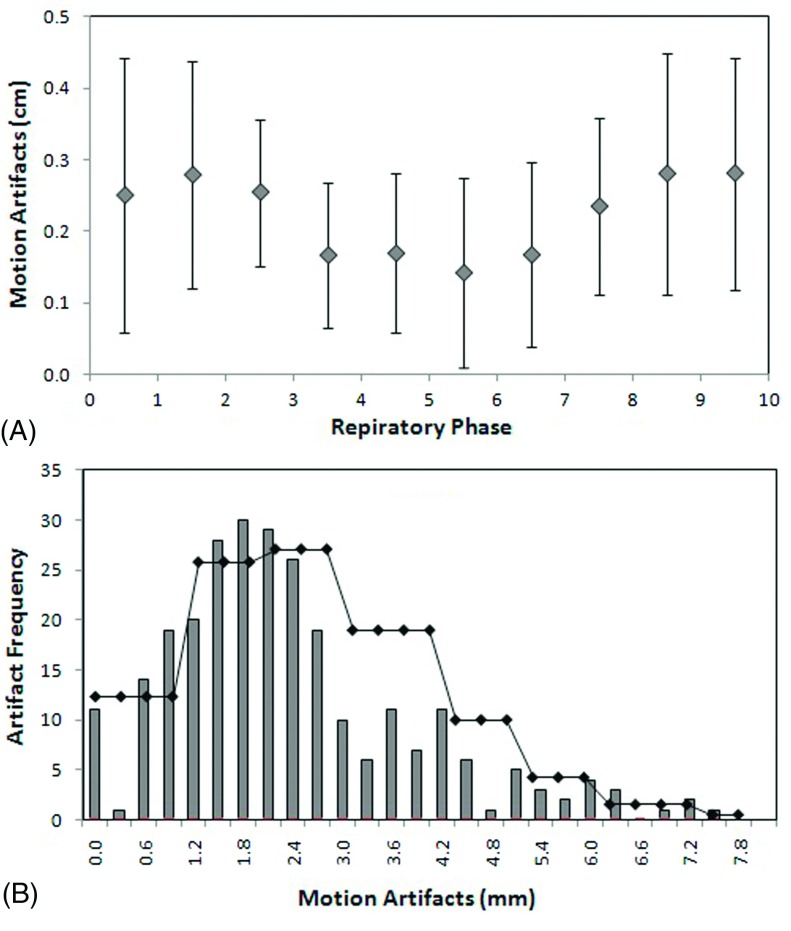
The amplitude of the motion artifacts is phase dependent, as shown in Fig. 5(A). The smallest artifact magnitude occurs around the full exhalation phase, while the largest magnitude with greatest variation happens at or near the full inhalation phase. The average motion artifact over all respiratory phases and all 26 patients is 2.2 ± 1.1 mm. The histogram of motion artifacts including all phases and all patients is shown in Fig. 5(B), illustrating the distribution of the amplitude of artifacts, which is similar to a Poisson process with a mean of 2.2 mm [Fig. 5(B)].
FIG. 5.
(A) Average motion artifacts per cine junction at the diaphragm of 26 patients as function of the breathing phase. (B) Histogram of the motion artifacts of all phases in 26 patients, overlaid with a Poisson distribution curve with the mean of motion artifacts (2.2 mm) to show the similarity. No Poisson fitting of the histogram was performed.
3.B. Periodicity and number of Fourier components
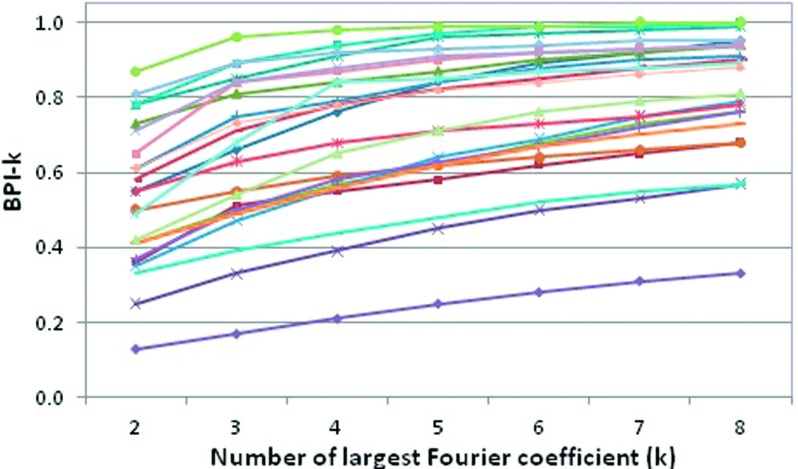
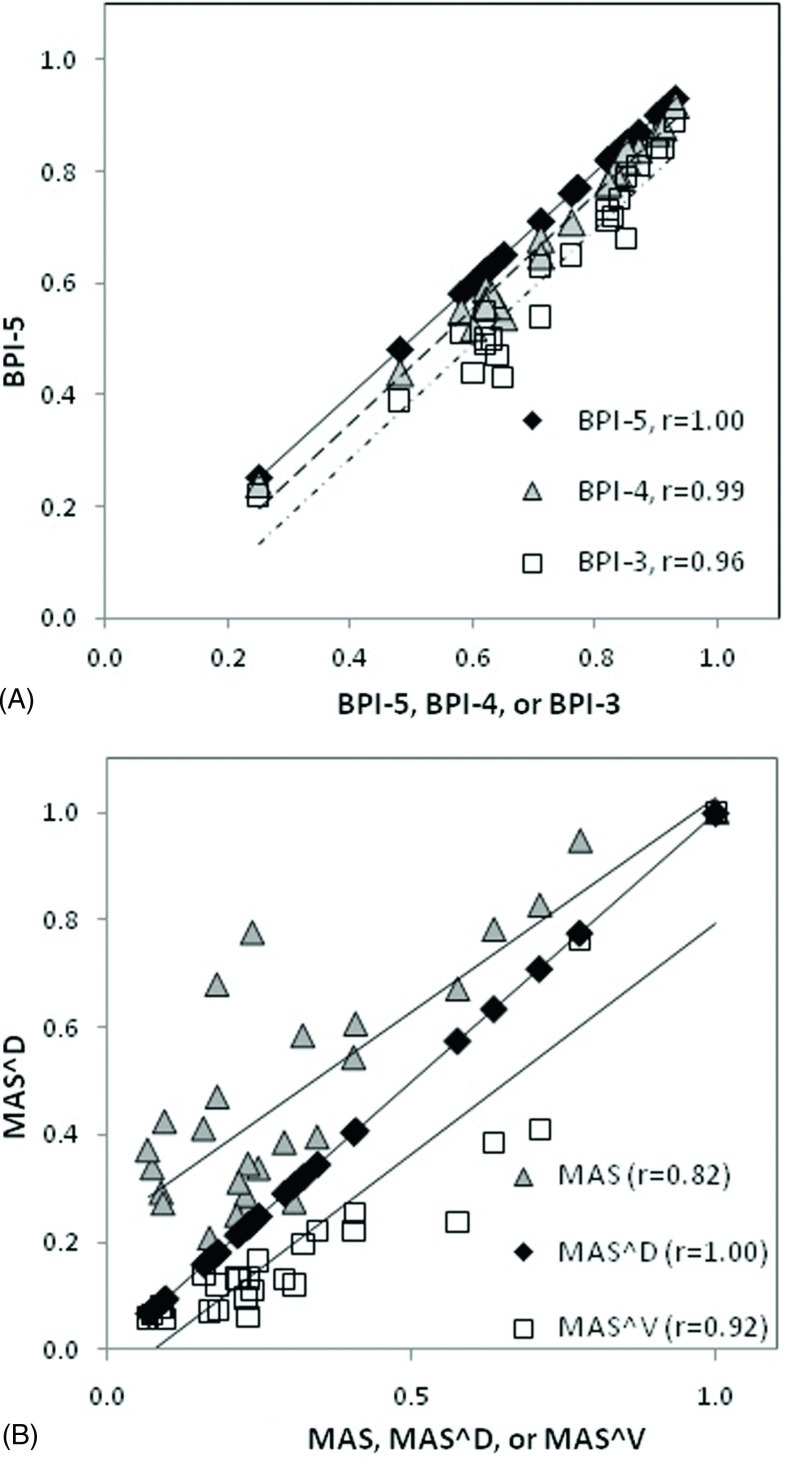
Among the 26 patients studied, the average BPI-5 is 0.75 ± 0.18, ranging from 0.25 to 0.93, as shown in Table I. Figure 6 shows BPI-k (k = 2–8) as a function of the number of largest Fourier coefficients in 26 patients. At k = 5, the slopes of the curves become steady, suggesting that BPI-5 is appropriate and effective. Figure 7(A) shows that the linear correlation increases slightly from (BPI-5 and BPI-3) to (BPI-5 and BPI-4), suggesting that k = 5 should be used even though their difference is small. For MAS, Fig. 7(B) depicts that MASD correlates with MASV (r = 0.92) better than with MAS (r = 0.82). The patient-averaged breathing period is 4.1 ± 1.3 s, ranging from 1.7 to 6.5 s. Table I shows the values of 26 patients, together with mean diaphragm displacement (0.8 ± 0.5 cm, ranging from 0.4 to 2.1 cm) and velocity (0.2 ± 0.1 cm/s, ranging from 0.1 to 0.4 cm/s). After patient-specific motion factor is removed from the MAS, the MASD and MASV should be primarily a result of breathing irregularities.
TABLE I.
Three motion-artifact severities (, MASD, and MASV) for the 4DCT images of 26 patients, whose maximum diaphragm displacement, mean motion period, and mean velocity are shown. Correlation is 0.82 for MAS–MASD and 0.92 for MASD–MASV.
| Patient | BPI-5 | MAS (cm) | St dev (cm) | MASD | Maximum displacement (cm) | MASV(s) | Period (s) | Velocity (cm/s) |
|---|---|---|---|---|---|---|---|---|
| 1 | 0.65 | 0.28 | 0.13 | 0.50 | 0.56 | 0.20 | 4.01 | 0.14 |
| 2 | 0.77 | 0.25 | 0.11 | 0.49 | 0.51 | 0.17 | 3.52 | 0.14 |
| 3 | 0.58 | 0.18 | 0.11 | 0.42 | 0.43 | 0.17 | 4.14 | 0.10 |
| 4 | 0.87 | 0.31 | 0.10 | 0.70 | 0.44 | 0.19 | 2.68 | 0.16 |
| 5 | 0.60 | 0.16 | 0.07 | 0.30 | 0.51 | 0.13 | 4.30 | 0.12 |
| 6 | 0.76 | 0.10 | 0.09 | 0.21 | 0.46 | 0.06 | 2.75 | 0.17 |
| 7 | 0.62 | 0.12 | 0.11 | 0.28 | 0.43 | 0.11 | 3.72 | 0.12 |
| 8 | 0.84 | 0.31 | 0.16 | 0.22 | 1.42 | 0.10 | 4.32 | 0.33 |
| 9 | 0.82 | 0.13 | 0.08 | 0.37 | 0.34 | 0.10 | 2.54 | 0.13 |
| 10 | 0.62 | 0.36 | 0.20 | 0.77 | 0.47 | 0.30 | 3.92 | 0.12 |
| 11 | 0.25 | 0.46 | 0.15 | 1.22 | 0.38 | 0.79 | 6.48 | 0.06 |
| 12 | 0.85 | 0.20 | 0.11 | 0.12 | 1.69 | 0.05 | 3.92 | 0.43 |
| 13 | 0.64 | 0.18 | 0.09 | 0.35 | 0.50 | 0.10 | 2.92 | 0.17 |
| 14 | 0.71 | 0.36 | 0.10 | 0.29 | 1.23 | 0.09 | 2.97 | 0.41 |
| 15 | 0.83 | 0.16 | 0.10 | 0.28 | 0.56 | 0.05 | 1.72 | 0.33 |
| 16 | 0.63 | 0.22 | 0.12 | 0.22 | 0.98 | 0.06 | 2.63 | 0.37 |
| 17 | 0.48 | 0.44 | 0.22 | 0.94 | 0.46 | 0.60 | 6.36 | 0.07 |
| 18 | 0.62 | 0.13 | 0.05 | 0.28 | 0.48 | 0.07 | 2.70 | 0.18 |
| 19 | 0.93 | 0.13 | 0.05 | 0.11 | 1.23 | 0.06 | 5.75 | 0.21 |
| 20 | 0.90 | 0.12 | 0.06 | 0.11 | 1.11 | 0.06 | 5.51 | 0.20 |
| 21 | 0.71 | 0.38 | 0.12 | 0.86 | 0.44 | 0.32 | 3.73 | 0.12 |
| 22 | 0.77 | 0.11 | 0.08 | 0.26 | 0.44 | 0.10 | 4.02 | 0.11 |
| 23 | 0.91 | 0.19 | 0.03 | 0.19 | 0.98 | 0.11 | 5.65 | 0.17 |
| 24 | 0.85 | 0.14 | 0.07 | 0.26 | 0.54 | 0.10 | 3.86 | 0.14 |
| 25 | 0.82 | 0.16 | 0.06 | 0.09 | 1.71 | 0.05 | 5.73 | 0.30 |
| 26 | 0.92 | 0.17 | 0.06 | 0.08 | 2.08 | 0.05 | 5.62 | 0.37 |
| Average | 0.73 | 0.22 | 0.10 | 0.38 | 0.78 | 0.16 | 4.05 | 0.20 |
| St dev | 0.16 | 0.11 | 0.04 | 0.28 | 0.48 | 0.17 | 1.28 | 0.11 |
FIG. 6.
Breathing periodicity index (BPI-k) changes as a function of number of largest Fourier coefficient (k) for 26 patients. Generally, after k = 5, the slopes become steady.
FIG. 7.
(A) Pearson correlation coefficients (r) of the breathing periodicity index with BPI-5, BPI-4, and BPI-3 (BPI-5, 4, 3 corresponds to the sum of the largest five, four, three Fourier coefficients). (B) Pearson correlation coefficient of MASD with MAS, MASD, and MASV, which are normalized to the largest value among all patients.
3.C. Motion-artifact severity and correlation with breathing periodicity
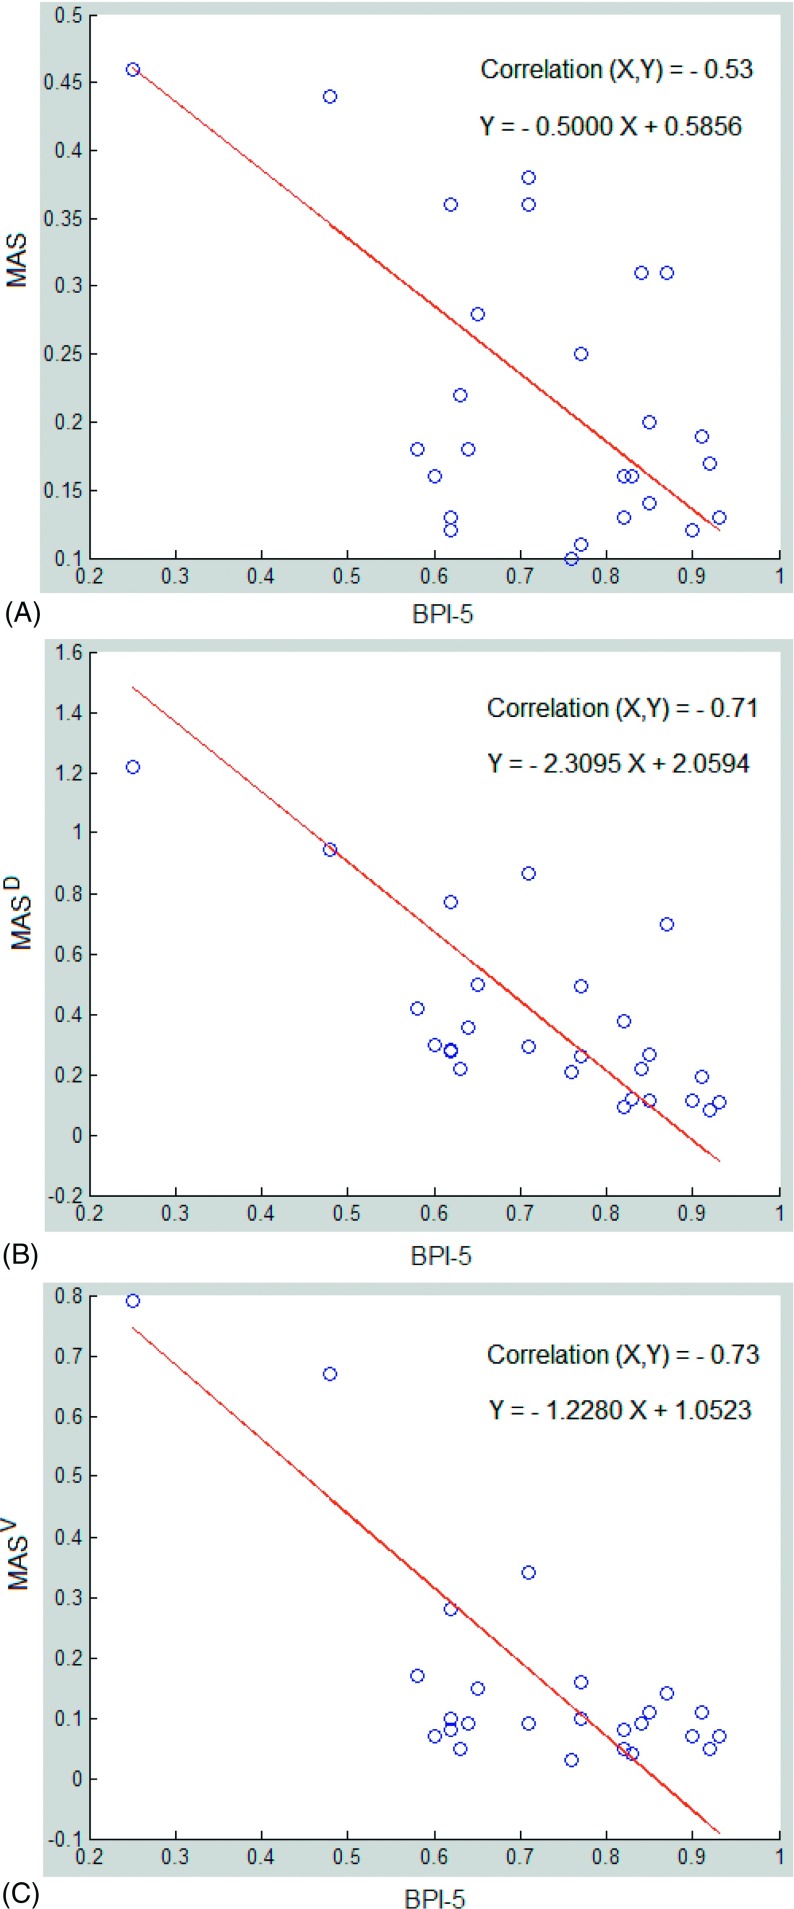
Figure 8 shows a negative correlation of −0.53 between the MAS and BPI-5. However, MASD and MASV, which were normalized to the displacement and velocity of the diaphragm, respectively, become comparable among patients, resulting in improvement in correlation with BPI-5 substantially to −0.71 and −0.73, respectively. One patient outlier (not shown) was removed from this study because of a possible mismatch between 4DCT images and 1DRW dataset.
FIG. 8.
Correlation between breathing periodicity index (BPI-5) and motion-artifact severity MAS (A), MASD (normalized to displacement) (B), and MASV (normalized to velocity) (C). As the uncertainties in BPI and MAS are similar, a linear regression treating BPI and MAS equally is applied using SVD (singular value decomposition). Nevertheless, the linear fitting does not affect the correlation between BPI and MAS.
3.D. Timing requirements for the 1DRW and 4DCT analyses
The averaged time for Fourier analysis was about 3 s per 1DRW, including the time for loading the data, displaying the 1DRW curve, and saving the result. However, it would take a trained researcher at least 2–3 h to process the ten phases for each patient’s 4DCT image set and record the data into an existing template.
4. DISCUSSION
4.A. Breathing irregularity as the primary source of motion artifacts
Breathing irregularities have long been recognized as the primary source of motion artifacts in respiratory-correlated 4DCT.2,13 For example, using a mobile phantom with aspherical ball and motion driven by real patient respiratory waveforms, the true volume of the sphere was estimated from 4DCT imaging and significant deviation from its true value was shown.7,11 However, in contrast to phantom studies, delineating the absolute volume variation in patients is nearly impossible since the initial tumor volume within patients is unknown; only relative variations of the tumor volume within a 4DCT image can be assessed.6,7
The impact of breathing irregularities on 4DCT image quality is not entirely predictable and varies depending upon the differences of breathing between two adjacent bed positions for cine scans. This suggested that statistical means would be effective in quantifying the severity of motion artifacts in 4DCT as well as its relationship with breathing irregularities observed in the 1DRW. Thus, we studied the 1DRW-4DCT relationship using the linear correlation approach. We found that MAS is lowest at full exhalation, while higher at other phases. In addition, the standard deviation around exhalation is the smallest since the passive relaxation process tends to be reproducible [Fig. 5(A)]. This is consistent with the general knowledge on reproducibility within the breathing cycle.2 However, as the artifact severity is also a function of other motion factors, such as displacement or velocity: generally the greater the motion, the larger the artifact. In other words, if an irregular breather has little diaphragm motion, the magnitude of artifacts will be limited by the motion amplitude. To remove the motion amplitude factor and make the irregularity the sole source of the artifacts, we introduced MASD and MASV. Our results (Fig. 8 and Table I) clearly depict a stronger correlation between BPI-5 (the cause) and MASD/MASV (the consequences) than between BPI-5 and MAS. The correlation is negative because periodicity is opposite to irregularity. This is the first time that a quantitative relationship is established, which not only links the two random phenomena but also quantifies the 1D-to-4D correlative relationship.
The artifact distribution from this 26-patient study shows artifacts are a common event (Figs. 5 and 7). All patients have nonzero APJ, ranging from 1 to 5 mm. This is consistent with the previous 50-patient study, in which 90% of patient 4DCTs contained motion artifacts.13 Note that APJ value is small because it averages with zero where motion artifact is not observable. We note that the RPM system contains a predictive filter, which is supposed to provide an assessment of breathing periodicity. However, this is a proprietary software tool that provides little information about its use of the RPM data. Therefore, this filter could not be utilized in a quantitative study.
4.B. Potential clinical and research applications
With the knowledge of the relatively high correlation between patient breathing irregularities and resulting motion artifacts, it becomes possible to predict the severity of motion artifacts in clinical 4DCT images. Two potential applications could be implemented in the clinic to improve 4DCT image quality with reduced motion artifacts. The BPI can be applied to predict artifact severity (1) prior to 4DCT scan or (2) during 4DCT scan. In both applications, appropriate actions can be taken when a patient’s BPI score is or becomes poor.
In the first scenario, a patient’s breathing regularity could be quantified after a short (<60 s) session of RPM monitoring and the BPI score can be calculated on-the-fly or at the end of the test. If BPI is lower than 0.85, then breath coaching may be an option. Breath coaching has been used clinically to reduce breathing irregularities.28 Three general breathing irregularities can affect 4DCT image quality: (A) frequency, (B) amplitude, and (C) breathing pattern [variation in chest (costal) and abdominal (diaphragmatic) muscles involvements]. Audio coaching regulates breathing frequency,29 but it often makes patients breathe deeper, resulting in greater tumor motion. Video coaching regulates both frequency and amplitude28 but has no control in maintaining the same breathing pattern. So far, no coaching method is known to regulate breathing pattern variations. In addition, breath coaching requires a patient’s voluntary effort, which introduces a new source of uncertainty including variations (learning curve) between 4DCT simulation and the course of treatment. Due to medical conditions, some patients may have difficulties in breathing regularly and/or following the coaching instructions.28 Therefore, although coaching may improve breathing regularity, it adds another layer of workload with associated uncertainty.
In the second scenario, on-the-fly DFT analysis of 1DRW can be performed to monitor the BPI variation using graphics processing unit (GPU)-based parallel computing. BPI as a function of time can potentially monitor patient breathing behavior in near-real time and identify sudden irregularities during the scan. A sudden change in the BPI curve between two adjacent bed positions could be used as a trigger to temporarily suspend 4D scanning and reassume the scan after BPI becomes normal. This could minimize breathing irregularity at the image acquisition level to gain improved 4DCT image quality.
From the clinical research perspective, 4DCT provides a rich dataset about respiratory motion for retrospective patient studies. However, image quality is of paramount importance to set a solid foundation for studying respiratory motion. Manual selection of patient 4DCT images is subjective, tedious, and labor-intensive. Our finding of a correlative relationship could serve as a rapid screening method to identify a large number of 4DCT images with minimal motion artifacts.
4.C. Limitations and future directions
The correlation between 1DRW breathing periodicity and 4DCT motion-artifact severity is established for cine-mode phase-binned 4DCT images and is useful for clinics that use similar 4DCT scanning protocols. For helical scan or amplitude-binned 4DCT, this result may not be directly applicable. Although the methodology is generally valid it has to be “recalibrated” for different types of 4DCT image sets.
In this study, we focused on the distortional artifacts but ignored motion blurring, which also contributes to overall motion artifacts. Motion blurring occurs within the same bed scan and is difficult to quantify without knowledge of the actual anatomy although it is feasible to scan the patient with breath holding as a control for some patients, or to create a theoretical model to account for the residual motion artifacts in 4DCT.11 A global Fourier analysis of 4DCT was also previously applied to assess overall motion artifacts, including the motion blurring, but only provide binary classification of image quality.30
The DFT-based periodicity definition uses sinusoidal functions to represent a 1DRW curve, and it is well-known that Fourier transformation produces multiple sine/cosine waves to mimic a curve with possible discontinuities. In rare circumstances, such as a periodic but discontinuous 1DRW, BPI may not fully represent periodicity, although it can catch principal components. In addition, in case a severe baseline drift in 1DRW occurs, which could result in large motion artifacts, the corresponding Fourier component (with a low frequency) should be excluded from BPI-5. In this study, we have not seen any case with severe baseline drift in the 26 patients. Nevertheless, it is worthwhile to perform a further investigation in the future.
In both clinical practice and clinical research, future application of this 1D–4D method could improve patient care and facilitate screening for high-quality images with minimal artifacts. The time saving in estimating 4DCT image quality is tremendous and the ability to differentiate regular breathers from irregular breathers prior to 4DCT scans would assist in making individualized decisions to fit patient respiration. We can take advantage of the periodicity of those with steady breathing cycles while providing help to those who need it. Moreover, the speed performance of Fourier analysis can be further improved using GPU for parallel computing to provide real-time results. This performance is essential in monitoring BPI on the fly during 4DCT scanning for a potential “gating” of the 4DCT scan using the BPI to set an irregularity threshold.
5. CONCLUSION
We have established a correlation between 1DRW breathing periodicity and 4DCT motion-artifact severity, by defining and quantifying these two quantities (BPI and MAS). We found that the correlation is about −0.70, which can be applied to predict the quality of 4DCT images based on 1DRW alone, before or during 4DCT scanning. This method can be useful in rapidly selecting high-quality 4DCT images for clinical research with a tremendous time saving factor. Further investigation is necessary to implement this method in the radiotherapy clinic to make an adaptive decision at the time of 4DCT simulation, and subsequent planning and treatment.
ACKNOWLEDGMENTS
This research was in part supported by the National Institutes of Health (U54CA00137788/U54CA132378). M.C. would like to thank MSKCC summer medical student research program supported by National Cancer Institute and hosted by the Department of Medical Physics at MSKCC. The authors thank Dr. Gikas Mageras and Dr. Joseph McNamara for sharing clinical imaging data used in this study.
REFERENCES
- 1.Korreman S. S., “Motion in radiotherapy: Photon therapy,” Phys. Med. Biol. 57, R161–R191 (2012). 10.1088/0031-9155/57/23/R161 [DOI] [PubMed] [Google Scholar]
- 2.Keall P. J., Mageras G. S., Balter J. M., Emery R. S., Forster K. M., Jiang S. B., Kapatoes J. M., Low D. A., Murphy M. J., Murray B. R., Ramsey C. R., Van Herk M. B., Vedam S. S., Wong J. W., and Yorke E., “The management of respiratory motion in radiation oncology report of AAPM Task Group 76,” Med. Phys. 33, 3874–3900 (2006). 10.1118/1.2349696 [DOI] [PubMed] [Google Scholar]
- 3.Li G., Citrin D., Camphausen K., Mueller B., Burman C., Mychalczak B., Miller R. W., and Song Y., “Advances in 4D medical imaging and 4D radiation therapy,” Technol. Cancer Res. Treat. 7, 67–81 (2008). 10.1177/153303460800700109 [DOI] [PubMed] [Google Scholar]
- 4.Persson G. F., Nygaard D. E., Brink C., Jahn J. W., af Rosenschold P. M., Specht L., and Korreman S. S., “Deviations in delineated GTV caused by artefacts in 4DCT,” Radiother. Oncol. 96, 61–66 (2010). 10.1016/j.radonc.2010.04.019 [DOI] [PubMed] [Google Scholar]
- 5.Persson G. F., Nygaard D. E., Af Rosenschold P. M., Richter Vogelius I., Josipovic M., Specht L., and Korreman S. S., “Artifacts in conventional computed tomography (CT) and free breathing four-dimensional CT induce uncertainty in gross tumor volume determination,” Int. J. Radiat. Oncol., Biol., Phys. 80, 1573–1580 (2011). 10.1016/j.ijrobp.2010.10.036 [DOI] [PubMed] [Google Scholar]
- 6.Li G., Cohen P., Xie H., Low D., Li D., and Rimner A., “A novel four-dimensional radiotherapy planning strategy from a tumor-tracking beam’s eye view,” Phys. Med. Biol. 57, 7579–7598 (2012). 10.1088/0031-9155/57/22/7579 [DOI] [PubMed] [Google Scholar]
- 7.Sarker J., Chu A., Mui K., Wolfgang J. A., Hirsch A. E., Chen G. T., and Sharp G. C., “Variations in tumor size and position due to irregular breathing in 4D-CT: A simulation study,” Med. Phys. 37, 1254–1260 (2010). 10.1118/1.3298007 [DOI] [PMC free article] [PubMed] [Google Scholar]
- 8.Shirato H., Onimaru R., Ishikawa M., Kaneko J., Takeshima T., Mochizuki K., Shimizu S., and Umegaki K., “Real-time 4-D radiotherapy for lung cancer,” Cancer Sci. 103, 1–6 (2012). 10.1111/j.1349-7006.2011.02114.x [DOI] [PMC free article] [PubMed] [Google Scholar]
- 9.Ruan D., Fessler J. A., Balter J. M., and Sonke J. J., “Exploring breathing pattern irregularity with projection-based method,” Med. Phys. 33, 2491–2499 (2006). 10.1118/1.2207253 [DOI] [PubMed] [Google Scholar]
- 10.Murphy M. J. and Dieterich S., “Comparative performance of linear and nonlinear neural networks to predict irregular breathing,” Phys. Med. Biol. 51, 5903–5914 (2006). 10.1088/0031-9155/51/22/012 [DOI] [PubMed] [Google Scholar]
- 11.Watkins W. T., Li R., Lewis J., Park J. C., Sandhu A., Jiang S. B., and Song W. Y., “Patient-specific motion artifacts in 4DCT,” Med. Phys. 37, 2855–2861 (2010). 10.1118/1.3432615 [DOI] [PubMed] [Google Scholar]
- 12.Rietzel E., Pan T., and Chen G. T., “Four-dimensional computed tomography: Image formation and clinical protocol,” Med. Phys. 32, 874–889 (2005). 10.1118/1.1869852 [DOI] [PubMed] [Google Scholar]
- 13.Yamamoto T., Langner U., B. W. Loo, Jr., Shen J., and Keall P. J., “Retrospective analysis of artifacts in four-dimensional CT images of 50 abdominal and thoracic radiotherapy patients,” Int. J. Radiat. Oncol., Biol., Phys. 72, 1250–1258 (2008). 10.1016/j.ijrobp.2008.06.1937 [DOI] [PMC free article] [PubMed] [Google Scholar]
- 14.Schreibmann E., Chen G. T., and Xing L., “Image interpolation in 4D CT using a BSpline deformable registration model,” Int. J. Radiat. Oncol., Biol., Phys. 64, 1537–1550 (2006). 10.1016/j.ijrobp.2005.11.018 [DOI] [PubMed] [Google Scholar]
- 15.Coolens C., Bracken J., Driscoll B., Hope A., and Jaffray D., “Dynamic volume vs respiratory correlated 4DCT for motion assessment in radiation therapy simulation,” Med. Phys. 39, 2669–2681 (2012). 10.1118/1.4704498 [DOI] [PubMed] [Google Scholar]
- 16.Li R., Lewis J. H., Cervino L. I., and Jiang S. B., “4D CT sorting based on patient internal anatomy,” Phys. Med. Biol. 54, 4821–4833 (2009). 10.1088/0031-9155/54/15/012 [DOI] [PubMed] [Google Scholar]
- 17.Gianoli C., Riboldi M., Spadea M. F., Travaini L. L., Ferrari M., Mei R., Orecchia R., and Baroni G., “A multiple points method for 4D CT image sorting,” Med. Phys. 38, 656–667 (2011). 10.1118/1.3538921 [DOI] [PubMed] [Google Scholar]
- 18.Han D., Bayouth J., Song Q., Bhatia S., Sonka M., and Wu X., “Feature Guided motion artifact reduction with structure-awareness in 4D CT images,” in Proceedings/CVPR, IEEE Computer Society Conference on Computer Vision and Pattern Recognition (IEEE Computer Society, Washington, DC, 2011), pp. 1057–1064. [DOI] [PMC free article] [PubMed] [Google Scholar]
- 19.Langner U. W. and Keall P. J., “Accuracy in the localization of thoracic and abdominal tumors using respiratory displacement, velocity, and phase,” Med. Phys. 36, 386–393 (2009). 10.1118/1.3049595 [DOI] [PMC free article] [PubMed] [Google Scholar]
- 20.Langner U. W. and Keall P. J., “Quantification of artifact reduction with real-time cine four-dimensional computed tomography acquisition methods,” Int. J. Radiat. Oncol., Biol., Phys. 76, 1242–1250 (2010). 10.1016/j.ijrobp.2009.07.013 [DOI] [PubMed] [Google Scholar]
- 21.Langner U. W. and Keall P. J., “Prospective displacement and velocity-based cine 4D CT,” Med. Phys. 35, 4501–4512 (2008). 10.1118/1.2977539 [DOI] [PMC free article] [PubMed] [Google Scholar]
- 22.Low D. A., White B. M., Lee P. P., Thomas D. H., Gaudio S., Jani S. S., Wu X., and Lamb J. M., “A novel CT acquisition and analysis technique for breathing motion modeling,” Phys. Med. Biol. 58, L31–L36 (2013). 10.1088/0031-9155/58/11/L31 [DOI] [PMC free article] [PubMed] [Google Scholar]
- 23.Zhang Q., Hu Y. C., Liu F., Goodman K., Rosenzweig K. E., and Mageras G. S., “Correction of motion artifacts in cone-beam CT using a patient-specific respiratory motion model,” Med. Phys. 37, 2901–2909 (2010). 10.1118/1.3397460 [DOI] [PMC free article] [PubMed] [Google Scholar]
- 24.Vandemeulebroucke J., Rit S., Kybic J., Clarysse P., and Sarrut D., “Spatiotemporal motion estimation for respiratory-correlated imaging of the lungs,” Med. Phys. 38, 166–178 (2011). 10.1118/1.3523619 [DOI] [PubMed] [Google Scholar]
- 25.Zhang Y., Yang J., Zhang L., Court L. E., Balter P. A., and Dong L., “Modeling respiratory motion for reducing motion artifacts in 4D CT images,” Med. Phys. 40, 041716 (13pp.) (2013). 10.1118/1.4795133 [DOI] [PubMed] [Google Scholar]
- 26.Hertanto A., Zhang Q., Hu Y. C., Dzyubak O., Rimner A., and Mageras G. S., “Reduction of irregular breathing artifacts in respiration-correlated CT images using a respiratory motion model,” Med. Phys. 39, 3070–3079 (2012). 10.1118/1.4711802 [DOI] [PMC free article] [PubMed] [Google Scholar]
- 27.Li G., Xie H., Ning H., Lu W., Low D., Citrin D., Kaushal A., Zach L., Camphausen K., and Miller R. W., “A novel analytical approach to the prediction of respiratory diaphragm motion based on external torso volume change,” Phys. Med. Biol. 54, 4113–4130 (2009). 10.1088/0031-9155/54/13/010 [DOI] [PMC free article] [PubMed] [Google Scholar]
- 28.Neicu T., Berbeco R., Wolfgang J., and Jiang S. B., “Synchronized moving aperture radiation therapy (SMART): Improvement of breathing pattern reproducibility using respiratory coaching,” Phys. Med. Biol. 51, 617–636 (2006). 10.1088/0031-9155/51/3/010 [DOI] [PubMed] [Google Scholar]
- 29.Erdi Y. E., Nehmeh S. A., Pan T., Pevsner A., Rosenzweig K. E., Mageras G., Yorke E. D., Schoder H., Hsiao W., Squire O. D., Vernon P., Ashman J. B., Mostafavi H., Larson S. M., and Humm J. L., “The CT motion quantitation of lung lesions and its impact on PET-measured SUVs,” J. Nucl. Med. 45, 1287–1292 (2004). [PubMed] [Google Scholar]
- 30.Wei J. and Li G., “Quantification of motion artifacts in 4DCT using Global Fourier Analysis,” in IEEE Signal Processing in Medicine and Biology Symposium (IEEE, New York, NY, 2012), pp. 1–5. [Google Scholar]


