Abstract
Purpose:
Compressed sensing (CS)-based iterative reconstruction (IR) techniques are able to reconstruct cone-beam CT (CBCT) images from undersampled noisy data, allowing for imaging dose reduction. However, there are a few practical concerns preventing the clinical implementation of these techniques. On the image quality side, data truncation along the superior–inferior direction under the cone-beam geometry produces severe cone artifacts in the reconstructed images. Ring artifacts are also seen in the half-fan scan mode. On the reconstruction efficiency side, the long computation time hinders clinical use in image-guided radiation therapy (IGRT).
Methods:
Image quality improvement methods are proposed to mitigate the cone and ring image artifacts in IR. The basic idea is to use weighting factors in the IR data fidelity term to improve projection data consistency with the reconstructed volume. In order to improve the computational efficiency, a multiple graphics processing units (GPUs)-based CS-IR system was developed. The parallelization scheme, detailed analyses of computation time at each step, their relationship with image resolution, and the acceleration factors were studied. The whole system was evaluated in various phantom and patient cases.
Results:
Ring artifacts can be mitigated by properly designing a weighting factor as a function of the spatial location on the detector. As for the cone artifact, without applying a correction method, it contaminated 13 out of 80 slices in a head-neck case (full-fan). Contamination was even more severe in a pelvis case under half-fan mode, where 36 out of 80 slices were affected, leading to poorer soft tissue delineation and reduced superior–inferior coverage. The proposed method effectively corrects those contaminated slices with mean intensity differences compared to FDK results decreasing from ∼497 and ∼293 HU to ∼39 and ∼27 HU for the full-fan and half-fan cases, respectively. In terms of efficiency boost, an overall 3.1 × speedup factor has been achieved with four GPU cards compared to a single GPU-based reconstruction. The total computation time is ∼30 s for typical clinical cases.
Conclusions:
The authors have developed a low-dose CBCT IR system for IGRT. By incorporating data consistency-based weighting factors in the IR model, cone/ring artifacts can be mitigated. A boost in computational efficiency is achieved by multi-GPU implementation.
Keywords: iterative reconstruction, low-dose, CBCT, artifact, GPU
1. INTRODUCTION
Cone-beam CT (CBCT)1,2 is widely used in image-guided radiation therapy (IGRT) for patient setup before treatment. CBCT reconstruction plays a vital role in the success of IGRT. Over the years, conventional FDK-type reconstruction algorithms3 have remained the mainstream in commercial systems, mainly due to their algorithmic simplicity, and hence acceptable computation time, as well as their robustness in different clinical contexts. However, an iterative reconstruction (IR) approach is still desired, particularly because it allows reducing radiation dose to patients. In IGRT, CBCT imaging is repeatedly applied to a patient during the treatment course, leading to a clinical concern of excessive imaging dose.4–6 IR algorithms, especially compressed sensing (CS)-based algorithms,7–27 have been shown to be capable of reconstructing CBCT images from noisy and undersampled x-ray projections, hence considerably reducing radiation dose during the CBCT scan.
However, a number of difficulties prevent CS-based IR from being applied clinically. First of all, even though impressive studies on CS-based IR involving real data have been reported,8,10,28,29 practical issues still exist leading to degraded image quality with severe artifacts. Specifically, two kinds of artifacts are often observed:
-
(1)
Cone artifacts. Due to the cone projection geometry, missing data at the superior–inferior (SI) ends cause artifacts, which are further propagated inward during regularization operations in CS-based IR approaches. Not only does this kind of artifact reduce the effective SI coverage of the reconstructed volume, it also hinders the IR algorithm convergence. Because this is a common problem for all types of IR algorithms under cone-beam geometry, solving it is of critical importance.
-
(2)
Ring artifacts. When a half-fan (HF) scan mode is used to enlarge the field of view, a discontinuity of data exists at the boundary of the field of view, causing a ringlike artifact. These artifacts deteriorate the utility of CBCT in IGRT, particularly for soft tissue-based patient positioning.
Computational inefficiency is another concern when implementing CS-based IR algorithms in the clinic. It results from the large problem size and the iterative nature of the algorithm. A CS-based IR algorithm usually reconstructs a CBCT image by solving an optimization problem using an iterative numerical algorithm. Inside each iteration step, a forward projection and a backward projection are typically computed, both of which have complexities similar to that of the FDK-type reconstruction algorithm. Considering that it usually requires a number of iterations to yield clinically acceptable image quality, the overall computation time is much longer than that of the typical FDK algorithm currently used in clinical practice. Moreover, the FDK algorithm sequentially back-projects each projection into the CBCT image domain, making it possible to conduct reconstruction immediately after data acquisition starts. In contrast, an IR method requires all the projections simultaneously, prohibiting concurrent execution of data acquisition and reconstruction. Recently, graphics processing units (GPUs) have been employed to accelerate the IR process.17,22,30–35 Nonetheless, it is still necessary to further boost efficiency for the time-critical IGRT environment.
This paper reports our recent progress toward solving the aforementioned problems. Regarding image quality, we have studied the underlying reasons for the two types of artifacts in an IR process. We found that it is the inconsistency between the measured and the calculated forward projection data that causes these artifacts. By incorporating weighting factors into the IR model, we can reduce the data inconsistency and therefore mitigate these problems to a satisfactory extent. On the efficiency side, a multi-GPU-based CBCT IR system was developed. While using multiple GPUs is a straightforward idea, inter-GPU parallelization is not a trivial problem. Specifically, since different GPUs only hold their own memory, communication among GPUs should be handled with care to achieve satisfactory efficiency. From a parallel computing point of view, conventional memory organization in a parallel processing task is either shared memory, where all processing units share a common memory space (e.g., a GPU), or distributed memory, where each unit holds its own memory space for conducting interunit data communication (e.g., a CPU cluster)36 CBCT reconstruction on a multi-GPU platform, however, attains a hybrid structure of shared and distributed memories. Careful design of the data allocation and communication among the GPUs is necessary to maximally exploit the potential of all the GPUs, as will be shown in this paper.
2. METHODS AND MATERIALS
2.A. Typical structure of an IR algorithm
IR essentially solves the linear equation Pf = g, where f is the image to be reconstructed, g is the projections measured at certain angles, and P is the projection operator corresponding to those angles. For image reconstruction from few projections, there are infinitely many solutions satisfying the above condition Pf = g. For such an ill-posed problem, regularization based on assumptions about the solution f has to be performed to discard those undesirable solutions. A more detailed description and review of IR algorithms can be found in the literature.28,37–41
In a typical CS-based IR algorithm, the following two steps are iteratively conducted. First, the forward projections of the reconstructed image f should match the measurements g. In our IR system, this fidelity condition is enforced by solving the least-square minimization problem using a conjugate gradient least-square (CGLS) algorithm.17,22,42
Second, a regularization step is performed to regularize the reconstructed CBCT image f. Examples of regularization methods include total variation (TV),7,9,17 which assumes that the solution is piecewise constant, and tight frame (TF),22 which assumes that the image has a sparse representation under the TF basis,43–46 an overcomplete wavelet basis. Another regularization step is used to enforce positivity of the solution. Since the reconstructed CBCT image f physically represents x-ray attenuation coefficients, those negative values in the reconstructed image f are truncated. In the rest of this paper, we will use the TF-based IR approach as an example to demonstrate the effectiveness of our system. For details of the TF method, interested readers can refer to literature.22,43–46
2.B. Image quality improvement
2.B.1. Ring artifact mitigation in half-fan reconstruction
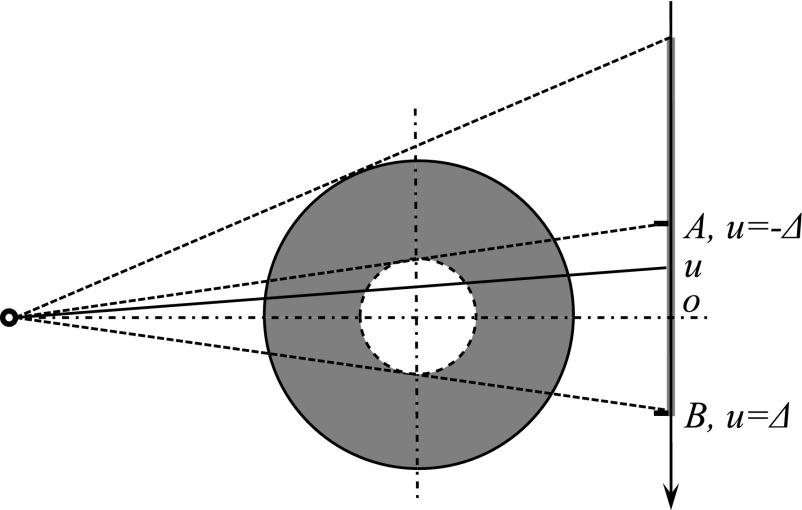
A half-fan scan is commonly used in the clinic to yield a large field of view. By shifting the x-ray detector laterally, an enlarged field of view is obtained, as illustrated by the solid circle in Fig. 1. In an analytical reconstruction approach for the half-fan mode, a necessary step before the reconstruction is to reweight the projection data47–49 to address data redundancy. Specifically, any x-ray that shoots toward the area between point A and B (Fig. 1) has a paired x-ray travelling through the same path (for the central slice) or similar path (for the off-central slices) when the source moves to the opposite side. As a result, the x-ray lines corresponding to the detector area between points A and B are doubly acquired. Hence, after backprojection, the image intensity inside the dashed circle region is overly counted, resulting in a bright zone with high intensities inside the dashed circle. To solve this problem, the projection data are reweighted by multiplying the projection g(u) with a properly designed factor w(u) to compensate for this effect. The term u indicates the coordinate along the imager, as indicated in Fig. 1. The requirements for the weighting factor are (1) unit total weight for redundant ray lines to avoid doubly counted projections and (2) continuity at the boundary point to allow a smooth transition.47–49
FIG. 1.
Top view of the half-fan projection geometry. Solid circle is the reconstruction field of view, and the dashed circle indicates where artifacts may appear.
In contrast to computing CBCT voxel values directly via a certain analytical formula, an IR method tries to adjust the voxel values of the reconstructed CBCT, such that its forward projections match the measurements. This is reflected by the presence of the fidelity term . This principle prevents the high-intensity artifacts seen in the analytical reconstruction approach, since such a solution apparently violates the projection condition. Yet, we found that a weighting factor is still necessary in the IR method. One reason is that there is a discontinuity in terms of the number of ray lines covering a given voxel when going from inside of the dashed circle in Fig. 1 to the outside. This discontinuity makes the area close to the smaller circle prone to reconstruction error. A ring artifact would develop in this area if no weighting factor was applied.
In order to mitigate the ring artifact, we have modified the data fidelity term in our objective function from into for the half-fan case, where u is the coordinate on the detector as illustrated in Fig. 1, and v is the perpendicular coordinate direction on the imager. For sim plicity, we have chosen w(u) as
| (1) |
We noticed that Bian et al. have used a similar weighting factor as [Eq. (1)] and ascribed the ring artifacts to discrete approximation in IR modeling.50 However, we independently conducted this study and presented it as well.51 In addition, we also chose to explore the condition regarding the smoothness of the weighting factors and its impact on ring artifacts. Our initial purpose for using this weighting factor was to prevent discontinuities in the projection domain,47–50,52 and therefore, it should be smooth in both sides near Δ and −Δ. In order to further test whether smoothness in both sides is necessary, we designed three other types of weighting factors (Table I). Among them, [Eq. (W1)] is nonsmooth in both sides while [Eqs. (W2) and (W3)] are only nonsmooth at either Δ or −Δ. We can reconstruct the CBCT using these weighting factors and compare the results.
TABLE I.
Three other weighting factors tested in the experiments.
| ||
| ||
|
2.B.2. Cone artifact mitigation in IR implementation
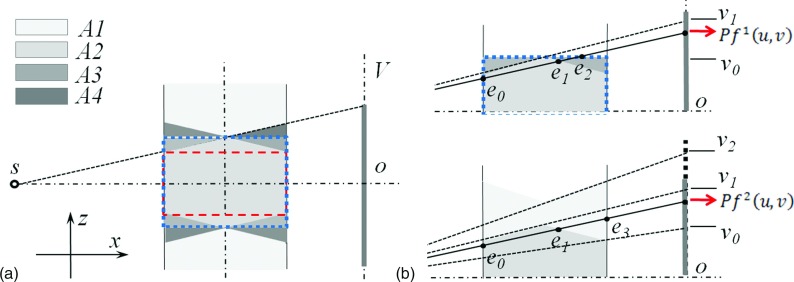
For circular CBCT geometry, cone artifacts exist under analytical reconstruction methods in the off-central slices far away from the central slice. Figure 2(a) shows the side view of the cone-beam geometry. The scanned object is usually long in the SI direction. Let us denote the volume not covered by any x-ray projections as A1. The volume within the projection area can be further divided into three parts A2–A4. A2 is covered by all projections while A3 and A4 are only seen in a few projections. In an analytical reconstruction, A2 is reconstructed with correct intensities, and A3 and A4 have low intensity, causing cone artifacts. Clinically, in order to avoid the artifacts, only the part in A2 indicated by the dashed box is used.
FIG. 2.
The side view of the cone-beam geometry. (a) A central sagittal slice illustrating the forward and backward operations. Dashed box and dotted box indicate the clinically used volume and the reconstruction volume, respectively. (b) Sagittal slides showing how the two forward projection terms in [Eq. (2)] are computed.
The cone artifacts are even more severe when using an IR approach. A typical reconstruction area using IR is shown by the dotted box in Fig. 2(a), which implicitly assumes zero voxel intensities in A4. Meanwhile, lower intensities are reconstructed in A3 since it is only covered by a few projections. As a result, inaccurate forward projection images are obtained at the detector region [v0, v1], deteriorating both regions A2 and A3 by a sequence of iterative backward and forward projections. Because an IR algorithm tends to adjust voxel values to match the calculated forward projection with the measured one, it incorrectly increases the voxel intensities in the cone area. Through multiple iterations, the cone artifacts are further magnified and propagated, since the aforementioned inconsistency and incorrect adjustments of voxel intensities exist in every cycle of iteration except for the first backprojection operation. In addition, the image processing in a regularization step is designed to remove artifacts using some type of smoothing operation. This at the same time further propagates the cone artifacts, polluting a large reconstruction volume. All these facts coupled together lead to more severe artifacts in a larger area compared to an analytical reconstruction approach.
Our approach for relieving this problem is to compensate for the missing data. To do this, we first enlarged the projection area to v2 to ensure A3 is fully covered by all the projections. The projection data in [v1, v2] are obtained by simply duplicating the measured value at v1. Second, a weighting factor w′(u, v) is embedded into the reconstruction model as to reduce the measured x-ray projection values from v0 to v2 and improve their consistency with the reconstructed volume. As such, w′(u, v) should be the ratio between the radiological length of the reconstructed object (i.e., inside A2 and A3) and that of the true object (i.e., in all the regions A1–A4). Note that it is not a trivial task to accurately estimate this ratio, as it depends on the specific patient anatomy and projection angle.
We propose a patient-specific approach to estimate the ratio w′(u, v) based on FDK reconstructed images
| (2) |
Here, f1 is the volume reconstructed by the FDK algorithm only in the dotted box in Fig. 2(a). Its forward projection is the radiographic length from e0 to e2, shown in Fig. 2(b). In contrast, f2 is the result of FDK using CBCT projections with extrapolation in the SI direction and is reconstructed in an extended volume along the same direction. Its forward projection is the radiographic length from e0 to e3. δ is a small constant to prevent dividing zero. After calculating w′(u, v) according to [Eq. (2)], we further use a 2D Gaussian filter to remove any discontinuities and ensure its smoothness across the u–v domain. The ratio between and essentially serves as a reasonable estimation of w′(u, v). By using this approach, we can calculate the weighting factor adaptively according to different patient anatomy and projection view angles.
2.C. Efficiency boost
2.C.1. Multi-GPU system setup and overall structure
To improve the computational efficiency, we have developed a multi-GPU IR system. The system is built on a desktop workstation with two Nvidia GTX590 GPU cards plugged into the motherboard. Each of the two cards contains two identical GPUs, so that there are four GPUs available. These GPUs are labeled as GPU 1 through 4 in the rest of this paper. For each GPU, there are 512 thread processors, each of which attains a clock speed of 1.2 GHz. All processors on a GPU share 1.5GB GDRR5 global memory at a 164 GB/s memory bandwidth. Among GPUs on different cards, data transfer is through the computer motherboard via PCIe-16 bus, while between GPUs on the same card, data transfer is accomplished directly through a PCI switch on the card, instead of through the motherboard. Our program is written in cuda 4.0,53 a c language extension that allows for the programming of each individual GPU, as well as inter-GPU communications.
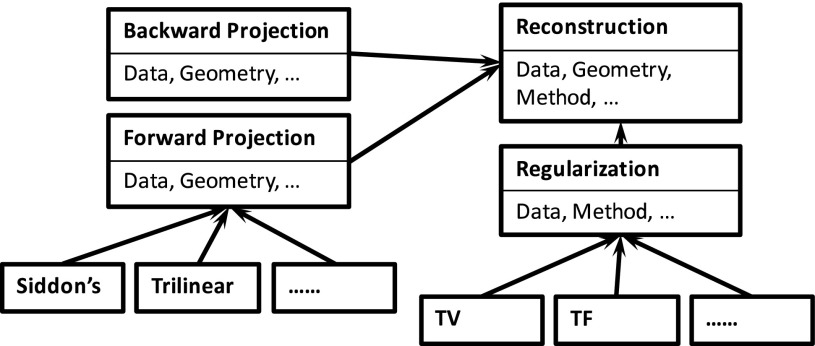
Typical CS-based CBCT reconstruction algorithms share a set of key operations in common. These operations are implemented in our system as individual modules, so that each specific algorithm can be used as a building block. The overall structure is schematically illustrated in Fig. 3. At the beginning of the reconstruction process, a user is asked to select an algorithm to perform reconstruction. After that, the reconstruction process launches in which the corresponding modules are invoked. For instance, forward x-ray projection is a key module in all IR algorithms, where the x-ray projections of the currently reconstructed images are computed. Siddon’s algorithm54 and a trilinear interpolation algorithm55 are currently available in our system for this purpose (with others to be supported in the future). Another example is a regularization module. Minimization of a TV term is conducted in a TV-based reconstruction algorithm7,17 to remove noise and any undesired streak artifacts, while preserving image edges. Shrinkage of TF coefficients is performed in TF-based approaches for the same purpose.22 These two modules are currently supported in our system, and other modules such as dictionary-based regularization56 will be incorporated in the future.
FIG. 3.
Illustration of the overall structure of our system.
2.C.2. General considerations about the parallelization scheme
Generally speaking, CBCT reconstruction involves two datasets residing in two different domains: one in the image domain and the other in the projection domain. When it comes to multi-GPU, at least one of the two, if not both, needs to be partitioned with each GPU storing one portion. Hence, inter-GPU communication is needed. Theoretically, there are an infinite number of ways to divide the data and it is for practical considerations that one is preferred over the others.
One possible partitioning method is to divide the CBCT volume into subvolumes. Each GPU holds one subvolume and all the projection data. Figure 4 illustrates two different ways of partitioning into subvolumes. Let the rotation axis be the z axis. The partition using planes that are parallel to the xoy plane is shown in Fig. 4(a), and the one using planes that contain the rotational axis is in Fig. 4(b). Each GPU performs forward and backward projection for its dedicated subvolume. Because of the prospective projection geometry in CBCT, the projections of different subvolumes overlap with each other on the detector. The overlapped part from different GPUs has to be added every time the forward projection operation is computed, causing a cumbersome computational burden. In contrast, the backward projection is straightforward.
FIG. 4.

Illustrations of projection overlap issue when partitioning the CBCT volume. (a) Side view of a partition with planes parallel to the xoy plane. (b) Top view of a partition with planes containing the rotational axis. Dashed lines and dashed–dotted lines are projection regions of two subvolumes and arrows indicate the overlap regions on the detector.
Another possible way to partition is to divide the data in the projection domain. Each GPU stores a subset of projections at certain projection angles, as well as the entire CBCT volume data. While each GPU can perform forward projection to its assigned angles, the backward projection to the image domain from different angles is to be accumulated from all GPUs, leading to extra cost of data communication.
As for the amount of data necessary to be communicated between GPUs, for a typical clinical case with an image resolution of 512 × 512 × 70 voxels and a projection resolution of 512 × 384 pixels with 120 projection angles, the data size in these two domains are similar. However the second approach, which partitions the projection domain, avoids the cumbersome treatment of overlapping projections and was therefore chosen for our multi-GPU parallelization.
2.C.3. Parallelization of CGLS step
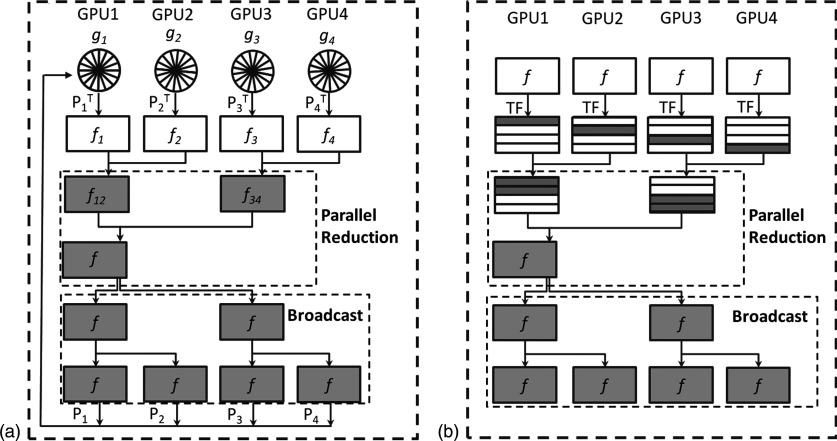
The CGLS step solves the least-square problem . There are three types of operations inside this algorithm, namely, the computation of forward projection Pf, backward projection PTg, and other vector–vector or scalar–vector operations. Under the partitioning in the projection domain, the backward projection operation requires special attention. This operation computes , where g is a vector in the projection domain and is divided into different parts gi, for i = 1, …, 4. Each of them corresponds to a set of projection angles assigned to a GPU. The backprojection operator can also be split into , and each submatrix represents the backprojection in the corresponding angles. Note that each GPU keeps different gi but the same CBCT volume data f. We first compute an intermediate variable at each GPU. This computation is achieved by employing the backprojection formula derived in Jia et al.,22 which efficiently calculates the backprojection results corresponding to projection angles at each GPU without any GPU memory writing conflict. After that, a parallel reduction among GPUs is conducted to compute the summation over all these intermediate variables. In this step, GPU 2 passes f2 to GPU 1 and the summation f12 = f1 + f2 is calculated at GPU 1. The same operation is performed simultaneously at GPU 3 and 4 leading to f34 = f3 + f4 at GPU 3. The reduction is then conducted one more time between GPU 1 and 3 to get the final backprojection result. Because each GPU requires the storage of the same CBCT volume data, the updated backprojection result f is immediately broadcasted to all GPUs for later usage. The broadcast is performed along the reverse path as in the parallel reduction, resulting in the same copy of f at all GPUs. This process is illustrated in Fig. 5(a).
FIG. 5.
Workflow for (a) backward projection and (b) regularization.
The forward projection operation, i.e., the computation of g = Pf, is straightforward. Each GPU computes the projections of the CBCT volume data according to its designated projection angles, namely, gi = Pif, for i = 1, …, 4. This task inside each GPU now becomes a standard forward x-ray digitally reconstructed radiograph calculation.57,58
All the remaining operations in the CGLS process are simply vector addition or scalar–vector multiplications, either in the CBCT image domain or in the CBCT projection domain. For instance, we compute the difference between the forward projection of current CBCT volume data and the measurement data. Tasks like this are highly parallelizable. For operations in the projection domain, each GPU computes a subset of the projections, and within a GPU, threads can independently process different pixels. For operations in the CBCT image domain, each GPU processes the whole CBCT volume data. There are apparently redundant computations here, as one can have a GPU only process a subvolume. However, it then requires inter-GPU communication to update the subvolume data, which leads to a relatively large overhead for this simple job.
2.C.4. Regularization
The image regularization step contains three operations in the TF reconstruction algorithm,22 namely, decomposing the current CBCT image into the TF space, performing a shrinkage operation on these coefficients, and reconstructing the CBCT image from the updated coefficients. The operations at different voxels are independent of each other. In the multi-GPU implementation, we have each GPU perform regularization on a subvolume data. Within a GPU, each thread is responsible for the computations at a voxel. Note that before the regularization step, each GPU already holds the same CBCT volume, and hence, no inter-GPU data transfer of the boundary layer between adjacent subvolumes is needed. However, after each GPU processes the designated subvolume, the reduction of the results to the first GPU as well as the posterior broadcasting of the entire volume to all GPUs are conducted in a way similar to the backward projection step, as shown in Fig. 5(b). The appropriate selection of regularization coefficients under the IR framework remains problematic. We have manually tuned regularization coefficients for each tested case to ensure a balance between removing streaking/noise artifacts and maintaining small fine structures.
2.C.5. Multiresolution (MR)
Multiresolution is another feature employed in our iterative CBCT reconstructions.17,22 To allow the freedom of handling reconstructions at different image resolutions, each of our modules takes relevant quantities as inputs, e.g., voxel size and voxel numbers. At the beginning of each resolution level, the program sets these quantities and feeds them into the modules. When switching from a low-resolution level to a high-resolution level, it is necessary to up-sample the reconstructed CBCT image to get a proper initial value for the next resolution level. This up-sampling is handled on only one GPU and the result is broadcasted to other GPUs. This is due to the fact that the up-sampling is a relatively simple job and is not frequently performed. It is thus not worthwhile to parallelize it.
2.D. Evaluation
Experimental data were collected from an on-board imaging (OBI) system integrated in a TrueBeam medical linear accelerator (Varian Medical System, Palo Alto, CA). A CatPhan 600 phantom (The Phantom Laboratory, Inc., Salem, NY) and a head-neck patient were scanned in a full-fan (FF) mode with 364 projections collected over a 200° arc. A thorax phantom, a thorax patient, and a pelvis patient were scanned in a half-fan mode with 656 projections collected over 360°. All projection data were resampled to 512 × 384 pixels with a resolution of 0.784 × 0.784 mm. In each case, reference images were reconstructed using FDK algorithm3 with all projections. Subsets of the projections were then extracted and sparse-view reconstruction was performed by the FDK algorithm and by the TF regularization-based IR algorithm, respectively. In accordance with recent studies regarding the optimal CS-based low-dose CBCT scan protocol,26,59 we have used 1/4 or 1/3 of the total projections in our sparse-view reconstruction to yield clinically acceptable image quality, i.e., 91 and 121 projections were evenly extracted from the total 364 projections for the Catphan and head-neck cases, respectively, while 164 projections were evenly extracted from the total 656 projections for the thorax phantom, thorax, and pelvis patient cases.
To evaluate the effectiveness of the cone artifact correction, TF results before and after cone artifact correction were compared to FDK results by calculating the mean intensity differences of each slice. To quantify the image quality improvement, line profiles were plotted to demonstrate the maintained spatial resolution. Contrast-noise-ratio (CNR) was used to evaluate soft tissue visibility. CNR = |μ(fF) − μ(fB)|/σ(fF) + σ(fB), where μ and σ represent the mean and standard deviation, and fF and fB represent the region of interest (ROI) image (foreground) and its background. For the Catphan 600 case, line pairs were used to evaluate high-contrast spatial resolution. For patient cases, transverse, coronal, and sagittal views are shown for visual inspection. In addition, line profiles crossing the prostate region (coronal view) of the pelvis patient case, as well as the CNR of that region, were used to quantify the low-contrast spatial resolution and soft tissue visibility in the coronal view.
3. RESULTS
3.A. Image quality
3.A.1. Ring artifacts mitigation
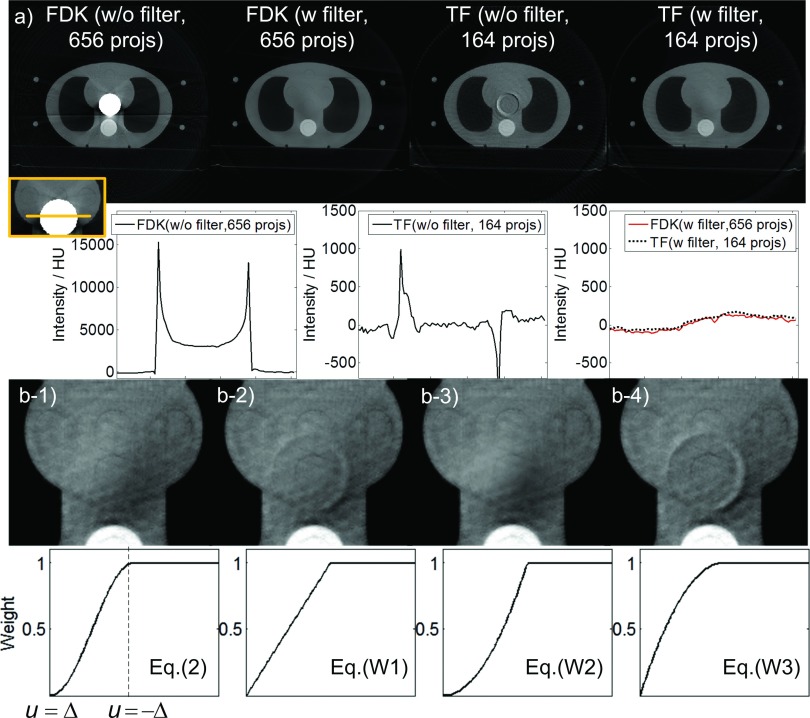
We used a thorax phantom to demonstrate the effectiveness of using a half-fan weighting factor to remove the ring artifacts, as shown in Fig. 6(a). In the absence of this factor, different types of ring artifacts appear. The FDK reconstructed image shows a bright zone in the center of the image. The intensity inside the bright zone is much higher than the intensity of the normal tissue. In addition, the boundary of this bright zone has even higher intensities due to the ramp filter, which amplifies the data discontinuity at the detector edge. As for the TF reconstructed image, the artifacts are less severe compared to FDK. The intensity inside the circular area is reasonable, but around this area ring artifacts appear. When the half-fan weighting factor is applied both FDK and TF algorithms yield reasonable images and comparable profiles.
FIG. 6.
(a) Upper row: reconstructed images of a thorax phantom (half-fan mode) using FDK and TF algorithms with and without weighting factors [Display window: (−900, 1775) HU]. “projs” is short for “projections” hereafter. Lower row: profiles crossing the ring-artifacts affected region. (b) Reconstructed images using TF algorithm [Upper row, display window: (−445, 675) HU] with different weighting factors (lower row).
We also found that the image artifacts depend on the smoothness property of the weighting factor at u = ± Δ. When the weighting factor is nonsmooth on both Δ side and −Δ side, ring artifacts appear [Fig. 6(b-2)], indicating discontinuity contributes to the artifacts. When the weighting function is not smooth only on the −Δ side, the ring artifacts disappear [Fig. 6(b-3)], indicating that the weighting function smoothness on the −Δ side is not the major reason for the ring artifacts. It is also notable that in this case, the weighting factor is different from that in Fig. 6(b-1), resulting in a slightly different image. For the case of Fig. 6(b-4), where w is not smooth only at u = Δ, the ring artifacts appear again with an even greater magnitude than in Fig. 6(b-2). These artifacts might be caused by the larger gradient of [Eq. (W3)] compared to [Eq. (W1)] at u = Δ. From these results, we hypothesize that the major source contributing to the ring artifacts is the relatively larger error around the detector edge at u = Δ. The error may be due to projection inconsistency induced by imperfect scanning geometry (such as gantry wobble), since we didnot observe any ring artifacts in the simulation case where perfect geometry alignment is guaranteed. A weighting factor used to suppress the artifacts should approach zero at the detector edge and should be smooth at this point.
3.A.2. Cone artifacts mitigation
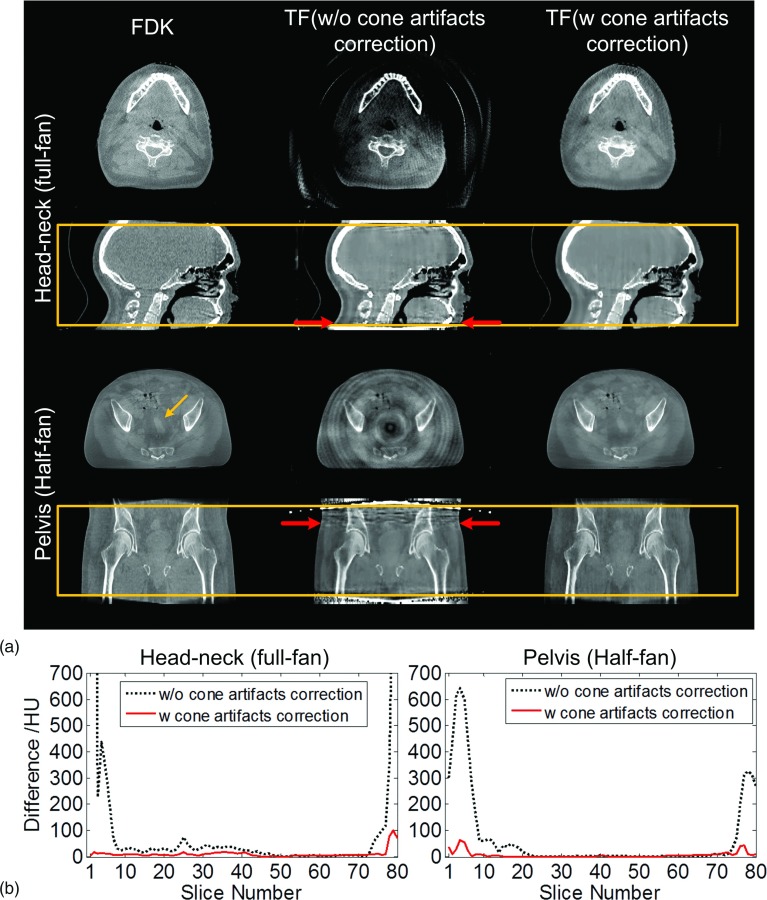
Figure 7 shows the results with and without cone artifact correction for a head-neck case and a pelvis patient case. In each case, a coronal/sagittal view and a transverse view are indicated by the horizontal arrows, and the average intensity differences of each slice between the FDK and TF results are shown to illustrate the impact of the artifacts.
FIG. 7.
Cone artifacts correction. (a) Transverse view and sagittal view of the reconstructed volume images: head-neck and pelvis cases. Boxes in second and fourth row indicate the range of the volume in SI direction in current clinical practice. Within the box, two transverse slices as indicated by horizontal arrows are shown. The number of projections used in FDK and TF is 364 and 121 (head-neck) and 656 and 164 (pelvis), respectively. (b) Mean intensity differences of each slice between FDK and TF results before and after cone artifacts correction.
Compared with the reference FDK results, if no correction strategy is applied, it can be seen that the TF results suffer from more severe bright/dark cone artifacts, leading to degraded overall image quality. For the head-neck patient case (full-fan) in this study 7 and 6 slices, out of a total of 80 slices, are visually affected by the artifacts at the superior and inferior ends, respectively. In half-fan mode with a larger patient, where the data inconsistency is more significant, the cone artifacts are even more severe. For the pelvis patient case, bright streaking artifacts can be observed in a wider range of slices in the coronal view. This causes deeper artifact penetration into the volume, leading to significantly reduced volume coverage in the SI direction in TF. 23 and 13 out of a total of 80 slices are affected in this prostate case on the superior and the inferior ends, respectively, accounting for over 1/3 of the total volume. As a result, even the volume inside the box that is used in clinical practice is polluted by cone artifacts. As shown in the transverse view, the visibility of the soft tissue indicated by the tilted arrow in the prostate region is heavily affected by the propagated cone artifacts.
When the cone correction method is applied, cone artifacts are mitigated to a large extent, yielding a much improved image quality as shown in the right column of Fig. 7(a). In particular, the visibility of the soft tissue indicated by the tilted arrow that was previously affected by the artifacts is restored.
Figure 7(b) shows the average intensity differences of each slice between FDK and TF results before and after cone artifact correction. It can be seen that the large intensity differences at the superior and the inferior ends have been mitigated significantly. Compared to the FDK results, the mean intensity differences for those slices are decreased from ∼497 and ∼293 HU to ∼39 and ∼27 HU for the head-neck and the pelvis cases, respectively.
In general, the reconstruction results after correction achieve SI coverage similar to that of the FDK algorithm. In the rest of this paper, we will only show the reconstructed volume images within the box, which is more clinically relevant since only that part of volume image is used in current clinical practice.
3.A.3. Phantom case
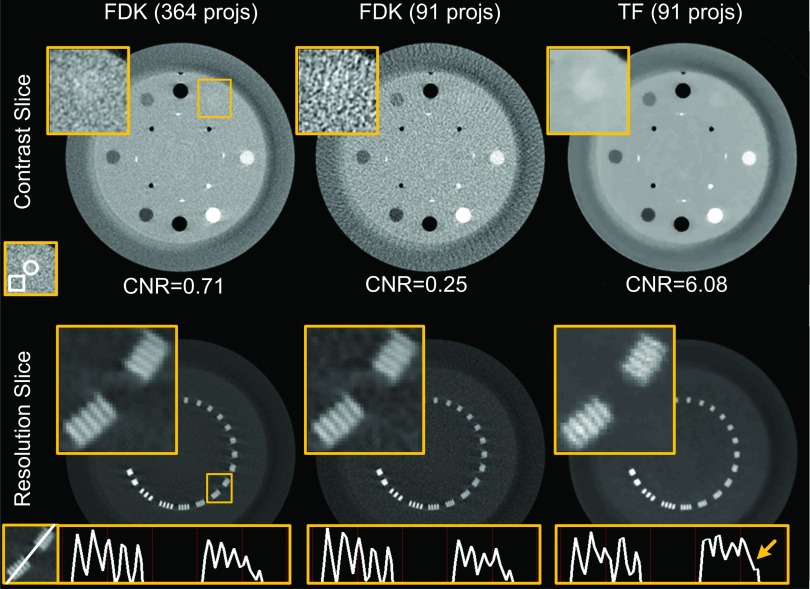
The reconstructed contrast and resolution slices of a CatPhan 600 phantom are shown in Fig. 8. For both the contrast and the resolution slices, zoomed-in ROIs are shown. By comparing with the reference image reconstructed by the FDK algorithm with a standard dose level (364 projections), we can see that the low-dose FDK results (91 projections) are degraded and the images suffer from streaking artifacts and increased noise. As indicated by the zoomed-in ROI of the contrast slice, the low-contrast acrylic insert is well distinguished in the standard-dose FDK results, but cannot be seen in the low-dose FDK results. CNR is also decreased from 0.71 to 0.25. With the same reduced number of projections, low-dose TF (91 projections) is able to eliminate the streaking artifacts and remove the noise to a satisfactory degree, offering comparable if not better low-contrast object visibility than the standard-dose FDK. Quantitatively, the CNR is increased to 6.08 due to the significantly suppressed noise level in the low-dose TF results.
FIG. 8.
Reconstructed images of CatPhan 600 phantom (full-fan mode). Top row: contrast slice shown with window (−300, 350) HU. A zoomed-in ROI within the box is shown in the upper-left corner. Below shows the CNR value, where the contents inside the circle and the box are regarded as foreground and background, respectively. Bottom row: resolution slice shown with window (−445, 1775) HU. A zoomed-in ROI within the box is shown in the upper-left corner. Below shows the profiles crossing the two groups of line pairs. From left to right: FDK reconstruction with 364 projections, FDK reconstruction with 91 projections, and TF with 91 projections.
By comparing the standard FDK results with the low-dose FDK results, we can see that high-contrast spatial resolution seems not to be significantly affected by the streaking artifacts and the amplified noise when the number of projections is reduced. In the TF approach, a parameter is finely tuned to balance the data fidelity and the regularization terms. Satisfactory high-contrast spatial resolution and low-contrast visibility can be maintained at the same time, as indicated by the zoomed-in ROI images in Fig. 8. To give a more detailed comparison, the profiles crossing those line pairs are also displayed. While the line pairs are distinguishable in both the FDK results and the TF results based on the images, the profiles reveal a degraded image resolution to a certain extent, as indicated by the arrow in Fig. 8. Considering that line pairs with the highest resolution have a spacing of a submillimeter scale (0.63 mm), and only one out of five lines is affected, as indicated by the arrow, the extent of this degradation is not likely to affect clinical image guidance.
3.A.4. Patient cases
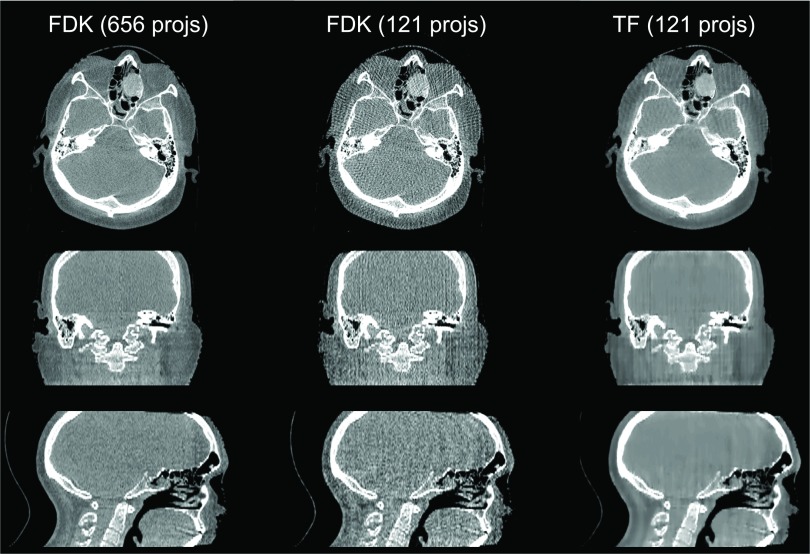
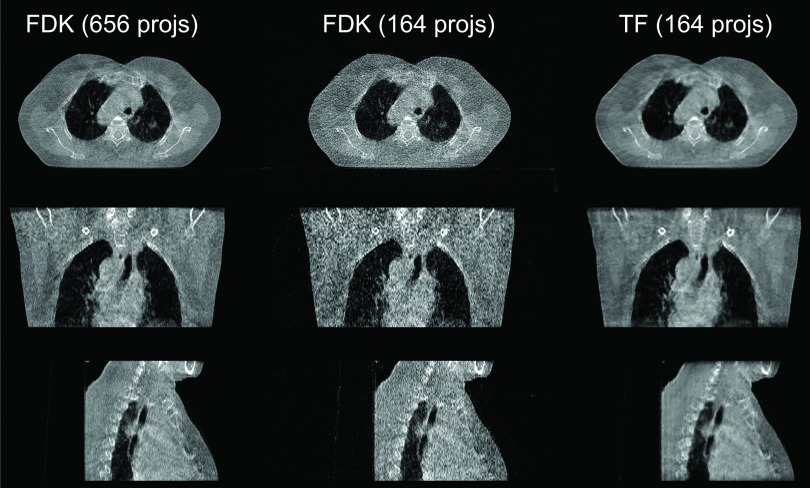
In Fig. 9, we can see that for the head-neck case when the projection number is decreased to 121, streaking artifacts are present in the whole FDK reconstructed volume, especially in the sagittal view. In contrast, the TF algorithm yields a better image quality. The thorax case is shown in Fig. 10. For this case, using 1/4 of the full number of projections, the FDK reconstructed result shows a large amount of amplified noise, especially in the coronal and sagittal views, but TF is still able to yield results comparable to the full projection number FDK results.
FIG. 9.
Reconstructed images of a head-neck patient [full-fan mode, display window: (−583, 385) HU]. Top to bottom: transverse, coronal, and sagittal views. From left to right: FDK reconstruction with 364 projections, FDK reconstruction with 121 projections, and TF with 121 projections.
FIG. 10.
Reconstructed images of a thorax case [half-fan mode, display window: (−722, 385) HU]. Top to bottom: transverse, coronal, and sagittal slices. From left to right: FDK reconstruction with 655 projections, FDK reconstruction with 164 projections, and TF with 164 projections.
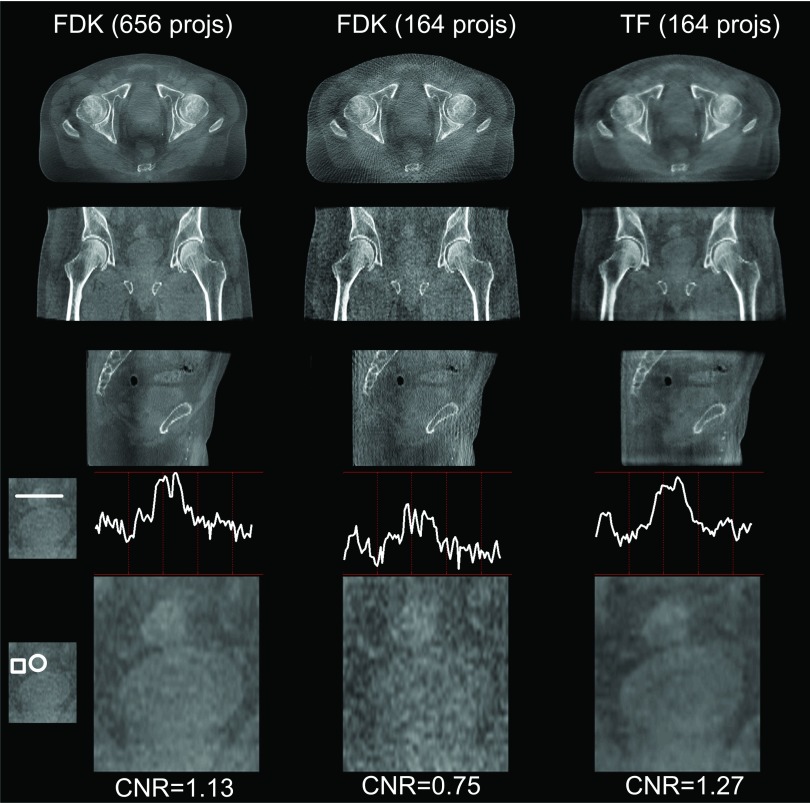
Figure 11 shows the reconstructions for the prostate case. To evaluate whether the image quality of the low-dose TF is sufficient for image guidance, we have shown the zoomed-in coronal ROIs and profiles crossing the soft tissue, as well as the associated CNRs. From the profile comparison, we can see that the contrast of the soft tissue in the low-dose TF result is similar to that in the standard-dose FDK result, both being much better than the low-dose FDK result. Similar observations can be made when visually inspecting the soft tissue area and comparing CNRs. Note that in this realistic patient case, the regularization factor of TF was carefully tuned to ensure a sufficient spatial resolution around the soft tissue region (as shown in the zoomed-in ROI images). In fact, this patient case is much more challenging than the Catphan phantom case due to many more detailed structures. The CNR value of the TF result is only slightly better than that of the standard-dose FDK result, if one would like to maintain image resolution.
FIG. 11.
Reconstructed images of a pelvis case. The settings of the first three rows are the same as in Fig. 10. The last two rows show a zoomed-in prostate region in the coronal view, with profiles crossing the soft tissue and its surroundings, and CNRs indicated. CNRs are calculated based on the intensity values inside the marked circle (soft tissue of interest, foreground) and box (surrounding tissues, background).
Note that tiny residual cone artifacts are still observable in the superior and inferior ends of the volumes for some of the above cases. The reason is w′(u, v) in [Eq. (2)] relies on f2, an approximation of the real object. This approximation itself is not perfectly accurate since the size and contents of the real object vary in the SI direction beyond the detector.
3.B. Reconstruction time
The computational time of TF-based CBCT reconstruction on our system with four GPUs is reported in Tables II and III for the CGLS step and the regularization step, respectively. A few points should be made about these tables. First, since the computational time depends on the number of projections and image resolution, we report here the computational time for full- and half-fan with a variety of resolutions separately. Only real patient cases, namely, the head-neck patients in the full-fan mode and the thorax/pelvis patients in the half-fan mode, which are of clinical interest, are included in this table. Second, the total reconstruction time linearly increases with the number of iterations, and depending on the requirement on the final image quality, the number of iterations may vary significantly. Hence, we report the time per iteration in these tables. Third, our reconstruction code has also been run on a single GPU in our system, to quantitatively demonstrate the efficiency gain provided by the multi-GPU system. Finally, the CGLS at each iteration step is also iterative by itself; we have fixed the number of iterations in the CGLS step to three in all the cases studied, as this choice was found to be sufficient to ensure the projection condition.
TABLE II.
Computation time (s) per iteration for the CGLS step in single and multiple GPU reconstructions.
| Protocol | Resolution | Single GPU | Multi-GPU | Speedup |
|---|---|---|---|---|
| Full-fan (121 projections) | 512 × 512 × 70 | 9.15 | 2.67 | 3.43 |
| 256 × 256 × 70 | 3.15 | 0.87 | 3.62 | |
| 128 × 128 × 70 | 1.26 | 0.36 | 3.50 | |
| Half-fan (164 projections) | 512 × 512 × 70 | 10.20 | 3.09 | 3.30 |
| 256 × 256 × 70 | 3.42 | 0.96 | 3.56 | |
| 128 × 128 × 70 | 1.32 | 0.36 | 3.67 |
TABLE III.
Computation time (s) per iteration for the regularization step in single and multiple GPU reconstructions.
| Protocol | Resolution | Single GPU | Multi-GPU | Speedup |
|---|---|---|---|---|
| Full-fan (121 projections) | 512 × 512 × 70 | 1.58 | 0.80 | 1.98 |
| 256 × 256 × 70 | 0.40 | 0.20 | 2.00 | |
| 128 × 128 × 70 | 0.10 | 0.06 | 1.67 | |
| Half-fan (164 projections) | 512 × 512 × 70 | 1.59 | 0.80 | 1.99 |
| 256 × 256 × 70 | 0.40 | 0.21 | 1.90 | |
| 128 × 128 × 70 | 0.10 | 0.06 | 1.67 |
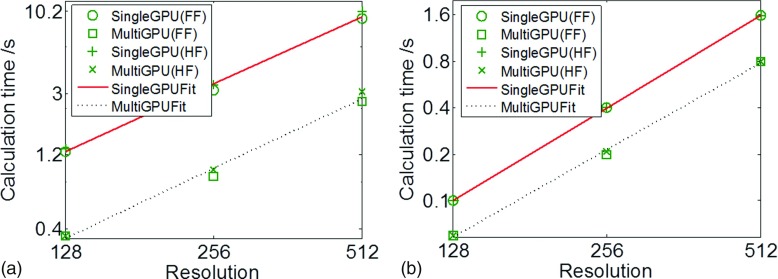
The dependence of computational time on image resolution allows us to analyze the overhead of parallel processing. Results are shown in Fig. 12. For calculation time in the CGLS step, plotted in a log–log scale in Fig. 12(a), the data points form straight lines for both the single-GPU and the multi-GPU cases, indicating that computation time scales with image resolution following a power law. A linear fit in this plot leads to tCGLS ∼ x1.46 for the single-GPU case and tCGLS ∼ x1.50 for the multi-GPU case, where t is the computation time and x is the transverse plane resolution. Note that the number of reconstructed transverse slices is fixed in all cases. The CGLS algorithm consists of mainly forward and backward projection operations. These operations scale linearly with the resolution x, as they are proportional to the number of voxels a ray line traverses. Yet, the observed scaling power ∼1.5 is mainly due to the overhead in multi-GPU parallelization. The small amount of s–vector operations in the CGLS algorithm also contributes to an increase of the scaling power. Moreover, it is also observed from Table II that the computation time is longer for the half-fan case, which is attributed to the larger number of projections. As for the acceleration ratio, it is found that a speedup of over three times is achieved in all cases using four GPUs.
FIG. 12.
Computation time in the CGLS and the regularization step are plotted as a function of CBCT image resolution in (a) and (b), respectively, for the single-GPU and multi-GPU cases. Both FF and HF cases are plotted. Lines correspond to the best fit.
For the regularization term, we performed the same analysis. Results are shown in Fig. 12(b). Again a power-law scaling of computation time is observed, yielding a best fit of treg ∼ x1.99 for the single-GPU implementation and treg ∼ x1.87 for multi-GPU. For regularization, the computation time should be proportional to the total number of voxels in the CBCT image, which is confirmed by the exponent of ∼2 (since the resolution along the third dimension is kept constant in all different cases). Additionally, because this step is a pure CBCT image domain processing, the computation time is independent of the number of projections, as shown in Table III. Yet, the acceleration ratio under the four GPUs is only up to 2. This is because processing in the image domain is a relatively small size problem. Under these circumstances, multi-GPU overhead is relatively large compared to the processing time, significantly impacting the speedup factor. This overhead effect is particularly severe for the case with the lowest CBCT image resolution, as indicated by the low speedup factors.
The total computation time per iteration is summarized in Table IV. The CGLS step dominates the overall computation due to its much more complicated operations. Hence, when combining the two steps, we still observe acceleration factors of 3.03 ∼ 3.38 under the multi-GPU implementation. From a parallel computing point of view, these acceleration factors are quite satisfactory considering the amount of data communication among the GPUs. The computation time for the half-fan case is slightly longer than that of the full-fan case, which is again due to the use of more projections. The total computation time, which is more clinically important, is also displayed in the second half of Table IV. In particular, the reconstruction time is controlled to be ∼25 s for the two cases, and acceleration factors of ∼3.1 have been achieved using the quad-GPU system.
TABLE IV.
Computation time (s) per step, total time with and without MR techniques in single and multiple GPU reconstructions. The total reconstruction time corresponds to the highest resolution case.
| Per-iteration | Total (without MR) | Total (with MR) | ||||||||
|---|---|---|---|---|---|---|---|---|---|---|
| Protocol | Resolution | Single | Multi | Factor | Single | Multi | Factor | Single | Multi | Factor |
| Full-fan (121 projections) | 512 × 512 × 70 | 10.73 | 3.47 | 3.09 | 107.3 | 34.7 | 3.09 | 78.2 | 24.8 | 3.15 |
| 256 × 256 × 70 | 3.55 | 1.07 | 3.32 | |||||||
| 128 × 128 × 70 | 1.36 | 0.42 | 3.24 | |||||||
| Half-fan (164 projections) | 512 × 512 × 70 | 11.79 | 3.89 | 3.03 | 117.9 | 38.9 | 3.03 | 85.2 | 24.7 | 3.11 |
| 256 × 256 × 70 | 3.82 | 1.17 | 3.26 | |||||||
4. DISCUSSION AND CONCLUSIONS
In this paper, we have presented our recent progress toward developing a CBCT reconstruction system for clinical application that focuses on improving both image quality and efficiency.
For image quality improvement, we have observed two typical artifacts in IR approaches, namely, cone artifacts and ring artifacts. The cause of the cone artifacts is data inconsistency, which is essentially associated with the “iterative forward matching” nature of IR algorithms. On this basis, we have proposed a practical and patient-specific solution to compensate for the data inconsistency and hence alleviate the artifacts and improve the image quality. The basic idea is to estimate the missing data using a FDK-type reconstruction algorithm. Such a weighting factor is adaptively defined specific to patient size/geometry and scan protocol, with no need of any empirical tuning. For the ring artifacts in half-fan mode, it was observed that one more weighting factor is needed to remove discontinuities in the ring area corresponding to the edge of the detector. Based on our experiments using different weighting factors, we found that the weighting factor should approach zero at the detector edge and should be smooth at this point. With these image quality improvements, our system has been validated in various cases under both full-fan and half-fan scanning protocols, and satisfactory reconstruction results compared to FDK reconstruction using full sets of data have been obtained.
While cone artifacts are mitigated to a satisfactory degree from a visual inspection point of view, quantitatively, there still exist residues up to tens of HUs in certain slices. The underlying reason is that the weighting factor is estimated based on the extrapolated volume images [the denominator in Eq. (2)], which is not exactly the same compared to the real long objects being scanned. Results may be improved by utilizing the planning CT, because the planning CT usually covers a larger volume than the CBCT in the SI direction. However, there are potential problems associated with this approach, such as the deformation-induced differences between the planning CT and the CBCT images. As for the ring artifacts, while we have conducted experiments and derived an empirical guideline to design the weighting factor, further exploration regarding the underlying mechanism of this artifact from a mathematical perspective is needed. We hypothesize that projection inconsistency induced by geometric inconsistency (such as gantry wobble) may be one cause of the ring artifacts. The reason is that the weighting factor is only found necessary in real experimental data, whereas in simulation studies where the projection data are generated under perfect scan geometry, we do not observe the ring artifact and the weighting factor seems unnecessary.
In all tested cases, regularization coefficients were manually tuned to ensure a balance between removing streaking/noise artifacts and maintaining small fine structures. As one of our major focuses is to maintain spatial resolution, which is extremely important in image guidance, the weight on regularization is not too large. As a result, tiny residual streaking can still be observed in the periphery of some reconstructed images, which may affect small-scale soft tissue visibility. This indicates that the current protocol may not be sufficient for certain advanced applications with diagnostic purposes. Meanwhile, more study is needed to establish optimal scan protocols (i.e., sufficient quality yet with lowest dose) for each clinical application. As such, it is not our intention to claim that the TF image quality using the current settings with reduced projection data is absolutely comparable to that of FDK with the full set of data. Instead, we aim to show that the image quality is significantly improved after cone/ring artifacts correction and becomes quite similar, if not equivalent, to that of the FDK results in the context of image guidance. This aspect has been validated through our illustrations. The TF results present a well-maintained spatial resolution, not only for the high-contrast objects in a standard CatPhan phantom (Fig. 8) but also for the low-contrast objects in the patient case (Fig. 11). It also yields satisfactory soft tissue visibility as indicated by both the visual inspection and the enhanced CNRs in those cases.
One focus of this study is to develop methods for cone/ring artifact correction. As such, we have directly used the raw projection data for simplicity and scatter/beam-hardening60–65 corrections have not been applied. As a result, shading artifacts can still be seen in all cases. From a perspective of applications where quantitative image quality is desired, such as CBCT-based dose calculation, comprehensive projection preprocessing including scatter and beam-hardening corrections are definitely necessary. We will include such models in our system in the near future.
For an efficiency boost to our algorithm, we developed a multi-GPU system. Inter-GPU parallelization was designed carefully to avoid cumbersome implementation and minimize communication overhead. Detailed analyses of computation time in each step, their relation to image resolution, and the acceleration factors were conducted. As for computational efficiency, a total speedup factor of ∼3.1 was achieved using four GPUs.
While all computational efficiency results were generated using the TF reconstruction algorithm, the conclusions are expected to hold for the TV algorithm as well because the structure of the TV-based CBCT reconstruction algorithm can be organized in a way similar to that of the TF algorithm.17 The only difference between the two algorithms lies in how the regularization is imposed, which is completely performed in the CBCT image domain and can be parallelized among GPUs in the same fashion as described in this paper. We also noticed that some single-GPU-based studies have reported comparably short time to that realized in our multi-GPU system. This can be mainly attributed to the following two reasons. (1) A small number of projections, e.g., 40 projections, were used in those studies,22,33 which reduced the reconstruction time. However, according to comprehensive studies under CS-based iterative CBCT reconstruction26 regarding the number/exposure of the projections versus image quality, an extremely few-projection protocol may not be clinical feasible. (2) A small number of iterations were used. In a typical IR process, the first few iteration steps outline the main CBCT image content while the posterior steps gradually improve image quality. Since it is the fine structures that are important for many clinical applications, a certain minimum number of iteration steps are indeed necessary to ensure an acceptable level of image quality.
In summary, this paper reports our recent development of a low-dose CBCT IR system to facilitate the use of low-dose IR in IGRT clinical practice. By incorporating data consistency-based weighting factors in the IR model, cone/ring artifacts can be mitigated and image quality is effectively improved. A boost in computational efficiency can be achieved by multi-GPU implementation.
ACKNOWLEDGMENTS
This work is supported in part by NIH (1R01CA154747-01 and 1R21 CA178787-01A1), the Master Research Agreement from Varian Medical Systems, Inc., The authors would like to thank David Staub and Dee Hill for the proofreading.
REFERENCES
- 1.Jaffray D. A. and Siewerdsen J. H., “Cone-beam computed tomography with a flat-panel imager: Initial performance characterization,” Med. Phys. 27, 1311–1323 (2000). 10.1118/1.599009 [DOI] [PubMed] [Google Scholar]
- 2.Jaffray D. A., Siewerdsen J. H., Wong J. W., and Martinez A. A., “Flat-panel cone-beam computed tomography for image-guided radiation therapy,” Int. J. Radiat. Oncol., Biol., Phys. 53, 1337–1349 (2002). 10.1016/S0360-3016(02)02884-5 [DOI] [PubMed] [Google Scholar]
- 3.Feldkamp L. A., Davis L. C., and Kress J. W., “Practical cone beam algorithm,” J. Opt. Soc. Am. A 1, 612–619 (1984). 10.1364/JOSAA.1.000612 [DOI] [Google Scholar]
- 4.Brenner D. J. and Elliston C. D., “Estimated radiation risks potentially associated with full-body CT screening,” Radiology 232, 735–738 (2004). 10.1148/radiol.2323031095 [DOI] [PubMed] [Google Scholar]
- 5.Hall E. J. and Brenner D. J., “Cancer risks from diagnostic radiology,” Br. J. Radiol. 81, 362–378 (2008). 10.1259/bjr/01948454 [DOI] [PubMed] [Google Scholar]
- 6.Brix G., Nissen-Meyer S., Lechel U., Nissen-Meyer J., Griebel J., Nekolla E. A., Becker C., and Reiser M., “Radiation exposures of cancer patients from medical x-rays: How relevant are they for individual patients and population exposure?,” Eur. J. Radiol. 72, 342–347 (2009). 10.1016/j.ejrad.2008.07.009 [DOI] [PubMed] [Google Scholar]
- 7.Sidky E. Y., Kao C. M., and Pan X., “Accurate image reconstruction from few-views and limited-angle data in divergent-beam CT,” J. X-ray Sci. Technol. 14, 119–139 (2006). [Google Scholar]
- 8.Song J., Liu Q. H., Johnson G. A., and Badea C. T., “Sparseness prior based iterative image reconstruction for retrospectively gated cardiac micro-CT,” Med. Phys. 34, 4476–4483 (2007). 10.1118/1.2795830 [DOI] [PMC free article] [PubMed] [Google Scholar]
- 9.Sidky E. Y. and Pan X. C., “Image reconstruction in circular cone-beam computed tomography by constrained, total-variation minimization,” Phys. Med. Biol. 53, 4777–4807 (2008). 10.1088/0031-9155/53/17/021 [DOI] [PMC free article] [PubMed] [Google Scholar]
- 10.Chen G. H., Tang J., and Leng S. H., “Prior image constrained compressed sensing (PICCS): A method to accurately reconstruct dynamic CT images from highly undersampled projection data sets,” Med. Phys. 35, 660–663 (2008). 10.1118/1.2836423 [DOI] [PMC free article] [PubMed] [Google Scholar]
- 11.Leng S., Tang J., Zambelli J., Nett B., Tolakanahalli R., and Chen G. H., “High temporal resolution and streak-free four-dimensional cone-beam computed tomography,” Phys. Med. Biol. 53, 5653–5673 (2008). 10.1088/0031-9155/53/20/006 [DOI] [PMC free article] [PubMed] [Google Scholar]
- 12.Wang J., Li T., Liang Z., and Xing L., “Dose reduction for kilovotage cone-beam computed tomography in radiation therapy,” Phys. Med. Biol. 53, 2897–2909 (2008). 10.1088/0031-9155/53/11/009 [DOI] [PMC free article] [PubMed] [Google Scholar]
- 13.Wang J., Li T., and Xing L., “Iterative image reconstruction for CBCT using edge-preserving prior,” Med. Phys. 36, 252–260 (2009). 10.1118/1.3036112 [DOI] [PMC free article] [PubMed] [Google Scholar]
- 14.Yu H. and Wang G., “Compressed sensing based interior tomography,” Phys. Med. Biol. 54, 2791–2805 (2009). 10.1088/0031-9155/54/9/014 [DOI] [PMC free article] [PubMed] [Google Scholar]
- 15.Yu H. and Wang G., “A soft-threshold filtering approach for reconstruction from a limited number of projections,” Phys. Med. Biol. 55, 3905–3916 (2010). 10.1088/0031-9155/55/13/022 [DOI] [PMC free article] [PubMed] [Google Scholar]
- 16.Choi K., Wang J., Zhu L., Suh T. S., Boyd S., and Xing L., “Compressed sensing based cone-beam computed tomography reconstruction with a first-order method,” Med. Phys. 37, 5113–5125 (2010). 10.1118/1.3481510 [DOI] [PMC free article] [PubMed] [Google Scholar]
- 17.Jia X., Lou Y., Li R., Song W. Y., and Jiang S. B., “GPU-based fast cone beam CT reconstruction from undersampled and noisy projection data via total variation,” Med. Phys. 37, 1757–1760 (2010). 10.1118/1.3371691 [DOI] [PubMed] [Google Scholar]
- 18.Yu H. and Wang G., “SART-type image reconstruction from a limited number of projections with the sparsity constraint,” Int. J. Biomed. Imaging 934847-1–934847-9 (2010). 10.1155/2010/934847 [DOI] [PMC free article] [PubMed] [Google Scholar]
- 19.Defrise M., Vanhove C., and Liu X., “An algorithm for total variation regularization in high-dimensional linear problems,” Inverse Probl. 27, 065002 (2011). 10.1088/0266-5611/27/6/065002 [DOI] [Google Scholar]
- 20.Ritschl L., Bergner F., Fleischmann C., and Kachelrieß M., “Improved total variation-based CT image reconstruction applied to clinical data,” Phys. Med. Biol. 56, 1545–1561 (2011). 10.1088/0031-9155/56/6/003 [DOI] [PubMed] [Google Scholar]
- 21.Tian Z., Jia X., Yuan K., Pan T., and Jiang S. B., “Low-dose CT reconstruction via edge-preserving total variation regularization,” Phys. Med. Biol. 56, 5949–5967 (2011). 10.1088/0031-9155/56/18/011 [DOI] [PMC free article] [PubMed] [Google Scholar]
- 22.Jia X., Dong B., Lou Y., and Jiang S. B., “GPU-based iterative cone-beam CT reconstruction using tight frame regularization,” Phys. Med. Biol. 56, 3787–3807 (2011). 10.1088/0031-9155/56/13/004 [DOI] [PubMed] [Google Scholar]
- 23.Fessler J. A., “Assessment of image quality for the new CT: Statistical reconstruction methods,” in 54th AAPM Annual Meeting (2012), http://web.eecs.umich.edu/~fessler/papers/files/talk/12/aapm-fessler-iq.pdf. [Google Scholar]
- 24.Xu Q., Yu H., Mou X., Zhang L., Hsieh J., and Wang G., “Low-dose x-ray CT reconstruction via dictionary learning,” IEEE Trans. Med. Imaging 31, 1682–1697 (2012). 10.1109/TMI.2012.2195669 [DOI] [PMC free article] [PubMed] [Google Scholar]
- 25.Lee H., Xing L., Davidi R., Li R., Qian J., and Lee R., “Improved compressed sensing-based cone-beam CT reconstruction using adaptive prior image constraints,” Phys. Med. Biol. 57, 2287–2307 (2012). 10.1088/0031-9155/57/8/2287 [DOI] [PMC free article] [PubMed] [Google Scholar]
- 26.Yan H., Cervino L., Jia X., and Jiang S. B., “A comprehensive study on the relationship between the image quality and imaging dose in low-dose cone beam CT,” Phys. Med. Biol. 57, 2063–2080 (2012). 10.1088/0031-9155/57/7/2063 [DOI] [PMC free article] [PubMed] [Google Scholar]
- 27.Niu T., Ye X., Fruhauf Q., Petrongolo M., and Zhu L., “Accelerated barrier optimization compressed sensing (ABOCS) for CT reconstruction with improved convergence,” Phys. Med. Biol. 59, 1801–1814 (2014). 10.1088/0031-9155/59/7/1801 [DOI] [PMC free article] [PubMed] [Google Scholar]
- 28.Tang J., Nett B. E., and Chen G. H., “Performance comparison between total variation (TV)-based compressed sensing and statistical iterative reconstruction algorithms,” Phys. Med. Biol. 54, 5781–5804 (2009). 10.1088/0031-9155/54/19/008 [DOI] [PMC free article] [PubMed] [Google Scholar]
- 29.Bian J., Siewerdsen J. H., Han X., Sidky E. Y., Prince J. L., Pelizzari C. A., and Pan X., “Evaluation of sparse-view reconstruction from flat-panel-detector cone-beam CT,” Phys. Med. Biol. 55, 6575–6599 (2010). 10.1088/0031-9155/55/22/001 [DOI] [PMC free article] [PubMed] [Google Scholar]
- 30.Pan Y. and Whitaker R., “Iterative helical cone-beam CT reconstruction using graphics hardware: A simulation study,” Proc. SPIE 7961, Medical Imaging 2011: Physics of Medical Imaging, 79612N (Lake Buena Vista, Florida, 2011). 10.1117/12.877201 [DOI] [Google Scholar]
- 31.Yan M., Chen J., Vese L., Villasenor J., Bui A., and Cong J., “EM+ TV based reconstruction for cone-beam CT with reduced radiation,” Adv. Visual Comput. 6938, 1–10 (2011). 10.1007/978-3-642-24028-7_1 [DOI] [Google Scholar]
- 32.Stsepankou D., Arns A., Ng S., Zygmanski P., and Hesser J., “Evaluation of robustness of maximum likelihood cone-beam CT reconstruction with total variation regularization,” Phys. Med. Biol. 57, 5955–5970 (2012). 10.1088/0031-9155/57/19/5955 [DOI] [PubMed] [Google Scholar]
- 33.Park J. C., Song B., Kim J. S., Park S. H., Kim H. K., Liu Z., Suh T. S., and Song W. Y., “Fast compressed sensing-based CBCT reconstruction using Barzilai–Borwein formulation for application to on-line IGRT,” Med. Phys. 39, 1207–1217 (2012). 10.1118/1.3679865 [DOI] [PubMed] [Google Scholar]
- 34.Cui J., Pratx G., Meng B., and Levin C., “Distributed MLEM: An iterative tomographic image reconstruction algorithm for distributed memory architectures,” IEEE Trans. Med. Imaging 32, 957–967 (2013). 10.1109/TMI.2013.2252913 [DOI] [PubMed] [Google Scholar]
- 35.Zheng Z., Papenhausen E., and Mueller K., “DQS advisor: A visual interface and knowledge-based system to balance dose, quality, and reconstruction speed in iterative CT reconstruction with application to NLM-regularization,” Phys. Med. Biol. 58, 7857–7873 (2013). 10.1088/0031-9155/58/21/7857 [DOI] [PubMed] [Google Scholar]
- 36.Hennessy J. L. and Patterson D. A., Computer Architecture, a Quantitative Approach, 4 ed. (Morgan Kaufmann, Boston, MA, 2006). [Google Scholar]
- 37.Herman G. T. and Lent A., “Iterative reconstruction algorithms,” Comput. Biol. Med. 6, 273–294 (1976). 10.1016/0010-4825(76)90066-4 [DOI] [PubMed] [Google Scholar]
- 38.Eggermont P. P. B., Herman G. T., and Lent A., “Iterative algorithms for large partitioned linear systems, with applications to image reconstruction,” Linear Algebra Appl. 40, 37–67 (1981). 10.1016/0024-3795(81)90139-7 [DOI] [Google Scholar]
- 39.Qi J. and Leahy R. M., “Iterative reconstruction techniques in emission computed tomography,” Phys. Med. Biol. 51, R541–R578 (2006). 10.1088/0031-9155/51/15/R01 [DOI] [PubMed] [Google Scholar]
- 40.Beister M., Kolditz D., and Kalender W. A., “Iterative reconstruction methods in X-ray CT,” Phys. Med. 28, 94–108 (2012). 10.1016/j.ejmp.2012.01.003 [DOI] [PubMed] [Google Scholar]
- 41.Nuyts J., De Man B., Fessler J. A., Zbijewski W., and Beekman F. J., “Modelling the physics in the iterative reconstruction for transmission computed tomography,” Phys. Med. Biol. 58, R63–R96 (2013). 10.1088/0031-9155/58/12/R63 [DOI] [PMC free article] [PubMed] [Google Scholar]
- 42.Hestenes M. R. and Stiefel E., “Methods of conjugate gradients for solving linear systems,” J. Res. Natl. Bur. Stand. 49, 409–436 (1952). 10.6028/jres.049.044 [DOI] [Google Scholar]
- 43.Cai J. F., Chan R. H., and Shen Z. W., “A framelet-based image inpainting algorithm,” Appl. Comput. Harmonic Anal. 24, 131–149 (2008). 10.1016/j.acha.2007.10.002 [DOI] [Google Scholar]
- 44.Cai J. F., Osher S., and Shen Z. W., “Split Bregman methods and frame based image restoration,” Multiscale Model. Simul. 8, 337–369 (2009). 10.1137/090753504 [DOI] [Google Scholar]
- 45.Cai J. F., Osher S., and Shen Z. W., “Linearized Bregman iteration for frame based image deblurring,” SIAM J. Imaging Sci. 2, 226–252 (2009). 10.1137/080733371 [DOI] [Google Scholar]
- 46.Cai J. F. and Shen Z. W., “Framelet based deconvolution,” J. Comput. Math. 28, 289–308 (2010). 10.4208/jcm.2009.10-m1009 [DOI] [Google Scholar]
- 47.Cho P. S., Rudd A. D., and Johnson R. H., “Cone-beam CT from width-truncated projections,” Comput. Med. Imaging Graphics 20, 49–57 (1996). 10.1016/0895-6111(96)00031-6 [DOI] [PubMed] [Google Scholar]
- 48.Cho P. S., Johnson R. H., and Griffin T. W., “Cone-beam CT for radiotherapy applications,” Phys. Med. Biol. 40, 1863–1883 (1999). 10.1088/0031-9155/40/11/007 [DOI] [PubMed] [Google Scholar]
- 49.Wang G., “X-ray micro-CT with a displaced detector array,” Med. Phys. 29, 1634–1636 (2002). 10.1118/1.1489043 [DOI] [PubMed] [Google Scholar]
- 50.Bian J., Wang J., Han X., Sidky E. Y., Shao L., and Pan X., “Optimization-based image reconstruction from sparse-view data in offset-detector CBCT,” Phys. Med. Biol. 58, 205–230 (2013). 10.1088/0031-9155/58/2/205 [DOI] [PMC free article] [PubMed] [Google Scholar]
- 51.Wang X., Yan H., Cervino L., Jiang S., and Jia X., “TH-C-103-07: Iterative cone beam CT reconstruction on a multi-GPU platform,” Med. Phys. 40(6), 543 (2013). 10.1118/1.4815787 [DOI] [Google Scholar]
- 52.Niu T. and Zhu L., “Scatter correction for full-fan volumetric CT using a stationary beam blocker in a single full scan,” Med. Phys. 38, 6027–6038 (2011). 10.1118/1.3651619 [DOI] [PMC free article] [PubMed] [Google Scholar]
- 53.NVIDIA, NVIDIA CUDA Compute Unified Device Architecture, Programming Guide, 4.0 (NVIDIA corporation, Santa Clara, California, 2011).
- 54.Siddon R. L., “Fast calculation of the exact radiological path for a three-dimensional CT array,” Med. Phys. 12, 252–255 (1985). 10.1118/1.595715 [DOI] [PubMed] [Google Scholar]
- 55.Watt A. and Watt M., Advanced Animation and Rendering Techniques: Theory and Practice (Addison-Wesley, Reading, Massachusetts, 1992). [Google Scholar]
- 56.Bai T., Yan H., Shi F., Jia X., Lou Y., Xu Q., Jiang S., and Mou X., “3D dictionary learning based iterative cone beam CT reconstruction,” Int. J. Cancer Ther. Oncol. 2, 020240 (2014). 10.14319/ijcto.0202.40 [DOI] [Google Scholar]
- 57.Folkerts M., Jia X., Choi D., Gu X., Majumdar A., and Jiang S., “SU-EI-35: A GPU optimized DRR algorithm,” Med. Phys. 38, 3403 (2011). 10.1118/1.3611608 [DOI] [Google Scholar]
- 58.Jia X., Yan H., Folkerts M., and Jiang S., “GDRR: A GPU tool for cone-beam CT projection simulations,” Med. Phys. 39, 3890 (2012). 10.1118/1.4735880 [DOI] [PMC free article] [PubMed] [Google Scholar]
- 59.Sidky E. Y., Jørgensen J. H., and Pan X., “Sampling conditions for gradient-magnitude sparsity based image reconstruction algorithms,” Proc. SPIE 8313, Medical Imaging 2012: Physics of Medical Imaging, 831337 (San Diego, California, 2012). 10.1117/12.913307 [DOI] [Google Scholar]
- 60.Hsieh J., Molthen R. C., Dawson C. A., and Johnson R. H., “An iterative approach to the beam hardening correction in cone beam CT,” Med. Phys. 27, 23–29 (2000). 10.1118/1.598853 [DOI] [PubMed] [Google Scholar]
- 61.Star-Lack J., Sun M., Kaestner A., Hassanein R., Virshup G., Berkus T., and Oelhafen M., “Efficient scatter correction using asymmetric kernels,” Proc. SPIE 7258, Medical Imaging 2009: Physics of Medical Imaging, 72581Z (Lake Buena Vista, Florida, 2009). 10.1117/12.811578 [DOI] [Google Scholar]
- 62.Sun M. and Star-Lack J., “Improved scatter correction using adaptive scatter kernel superposition,” Phys. Med. Biol. 55, 6695–6720 (2010). 10.1088/0031-9155/55/22/007 [DOI] [PubMed] [Google Scholar]
- 63.Yan H., Mou X., Tang S., Xu Q., and Zankl M., “Projection correlation based view interpolation for cone beam CT: Primary fluence restoration in scatter measurement with a moving beam stop array,” Phys. Med. Biol. 55, 6353–6375 (2010). 10.1088/0031-9155/55/21/002 [DOI] [PubMed] [Google Scholar]
- 64.Zhu L., Xie Y., Wang J., and Xing L., “Scatter correction for cone-beam CT in radiation therapy,” Med. Phys. 36, 2258–2268 (2009). 10.1118/1.3130047 [DOI] [PMC free article] [PubMed] [Google Scholar]
- 65.Niu T., Al-Basheer A., and Zhu L., “Quantitative cone-beam CT imaging in radiation therapy using planning CT as a prior: First patient studies,” Med. Phys. 39, 1991–2000 (2012). 10.1118/1.3693050 [DOI] [PMC free article] [PubMed] [Google Scholar]


