

Abstract
To investigate panitumumab-IRDye800 as an intraoperative optical imaging agent for epidermal growth factor receptor (EGFR)-expressing cancers, we developed clinical-quality panitumumab-IRDye800 and evaluated its specificity and sensitivity to visualize tumors by fluorescence imaging in a variety of mouse xenograft models with different levels of EGFR-expression. Panitumumab was chemically conjugated to NIR-dye (Li-COR 800CW) at well-defined and limited substitution ratio (1:1–2) for the characterization of fluorescence signals. Yield and purity of the conjugate was 80±5% and 95±2% respectively (n= 6). Quality control (QC) tests showed that product was suitable for clinical development. Female athymic nude xenograft tumor bearing mice (n=5 per tumor model) with very low (BT-474), moderate (MDA-MB-231), and high (MDA-MB-468) EGFR-expression levels were administered panitumumab-IRDye800 formulations (100 μg of mAb in 100 μL of 0.9% saline) via tail-vein injection. Animal imaging and biodistribution experiments were conducted on the FMT 2500 (Perkin Elmer) fluorescence scanner at 24, 48, 72, 96, and 144 hours post injection. Immuno-fluorescence images of panitumumab-IRDye conjugate recorded in mouse xenograft models showed a good correlation (R2 = 0.91) between EGFR-expression level and tumor uptake. Uptake of panitumumab labeled with IR-Dye or [89Zr] in different tumor xenografts with high, medium, and low EGFR expression, as measured by fluorescence or radioactive counts are highly correlated (r2= 0.99). This preclinical in-vivo study proved that panitumumab-IRDye800 is specific and optical imaging in conjunction with this probe is sensitive enough to detect EGFR-expressing tumors.
Introduction
Cancer treatment primarily relies on surgical removal of the primary tumor followed by adjuvant chemotherapy to destroy residual cancer cells in surrounding tissues.1 However, during surgery, it is very difficult to distinguish between malignant and healthy tissue, which can lead to incomplete resections or unnecessary removal of normal tissue. Therefore, in current surgical oncology, it is a normal practice to resect the primary and metastatic tumor with a `wide margin' of presumed normal tissue to eliminate the chance of residual, micro-invasive tumor. While this may be without complication for particular tumors, it is detrimental for tumors located in the sensitive and functional regions (e.g. brain, head and neck etc.) of the body where the surgical removal of normal tissue must be minimized.2,3 It would be advantageous to have an intraoperative diagnosis system capable to examine both the resected tissue and the walls of the tumor cavity for malignant tissue in real-time and at cellular resolutions (a few microns).2,3
Imaging modalities such as CT, PET, SPECT, and MRI have become very sensitive at detecting disease, however intraoperative techniques have not reached this resolution. Unfortunately the use of these imaging strategies does not translate well to the operating room. Surgical imaging requires a wide-field, real-time imaging to allow the surgeon to repeatedly view the wound bed. In addition to the obvious cost, work-flow and space challenges associated with translating anatomic imaging to the operating room, the CT and MRI modalities require repeated sectional images rather than access to the surgical view which is required for high resolution surgical imaging in a complex anatomic field. Optical imaging in conjunction with NIR-dye probes is a promising technique for intraoperative diagnosis.2,4–7 Although the imaging depth in this technique is very low (a few mm) due to random scattering and absorption of photons, there are numerous experimental and surgical scenarios where it is feasible to deliver the excitation beam (λex) close to the tissue of interest to visualize the surgical area at the cellular level.
Epidermal growth factor receptor (EGFR, erb1, HER1) is a glycoprotein belonging to the subclass I of the tyrosine kinase receptor super family.8 This receptor is dysregulated in a variety of cancers, including those of lung, colorectal, head and neck, prostate, breast, glioma, pancreatic and ovarian.9 Overexpression of this receptor is associated with disease progression and treatment resistance. The anti-EGFR mAb, panitumumab is a fully human mAb approved for the treatment of EGFR-expressing colorectal cancers. It is currently being evaluated in patients with other types of EGFR-expressing cancers, such as breast, lung, head and neck, renal and ovarian tumors.10,11
Current promising results12,13 in preclinical evaluation of this probe as an intraoperative diagnostic agent for head and neck squamous cell cancers (HNSCC) have prompted us to perform further evaluation of this probe in different cancer models. We anticipated that it is feasible to translate NIRDye800 labeled panitumumab for its potential clinical use as an intraoperative imaging agent for EGFR-expressing tumors. The use of FDA approved therapeutic antibodies as diagnostic agents for optical imaging leverages the extensive preclinical and clinical safety data of these agents to allow safe, efficient and rapid clinical translation.
Herein, we report the optimized synthesis of panitumumab-IRDye800 for potential clinical use and its tumor uptake in three human breast cancer xenografts expressing different levels of EGFR.
Materials and Methods
General
IR-Dye-800CW NHS ester (non-clinical) was purchased from Li-COR Biotechnology (Lincoln, Nebraska). NHS-ester of fluorescein dye (FITC) was purchased from Thermo-Fisher Scientific (Pittsburgh, PA). Formulated clinical drug panitumumab (100 mg/5 mL saline) was obtained from a licensed pharmacy, manufactured by Amgen, Inc. (Thousand Oaks, CA), and was used as such in the conjugation reaction without any further processing. Milli-Q water (> 18.2 MΩ.cm at 25 °C, Millipore, MA) has been used for reagent preparation. All other chemicals unless otherwise stated, were purchased from Sigma Aldrich (St. Louis, MO). Breast cancer cell lines BT-474, MDA-MB-231 and MDA-MB-468 were obtained from the Development Therapeutics Program/DCTD/NCI/NIH Tumor Repository (Frederick National Laboratory for Cancer Research, Frederick, MD). All cell lines were maintained in RPMI 1640 supplemented with 5% fetal bovine serum and 2 mM GlutaMAX™ (Life Technologies, Grand Island, NY).
All instruments were maintained and calibrated properly as per routine quality control methods. A Shimadzu HPLC system equipped with size exclusion column (TSKgel G3000SW, 7.5mm×30cm, 10um; Tosoh Bioscience, King of Prussia, PA) was used to analyze the sample. UV-Vis spectrophotometer (Thermo Scientific, Pittsburgh, PA) was used to determine the degree of labeling (DOL) i.e. dye to mAb ratio and mAb concentration after purification. Flow-cytometry experiments were performed on BD FACS Canto I instrument (Franklin Lakes, NJ) using excitation wave-length (λex) of 780 nm and 488 nm. Levels of bacterial endotoxin of the product after sterile filtration were tested using the portable test system (PTS) from Charles River Laboratories (Charleston, SC, USA). Filter integrity of sterile filter was measured in an in-house modified filter test instrument (Nalgene, Thermo Scientific, USA).
Synthesis of panitumumab-IRDye800 conjugate
All steps were performed under reduced light conditions (turned off most lights and used aluminum foil to cover columns and vials). 1.0 mg of IRDye800 was dissolved in 200 μL of water. 2.5 mL of panitumumab solution (50 mg, clinical drug, in saline) was transferred to a 15 mL Eppendorf tube and 2.5 mL of 1.0 M PBS (pH 8.5) was added to the tube for pH adjustment. To this solution approximately 2.3 equivalent of dye (192 μL) was added. The mixture was incubated with gentle shaking for 2 hrs at 20°C in a temperature controlled shaker (Multi-Therm, Thermo Scientific). The mixture was then purified over a Sephadex G25 glass column (2 cm ID and 25 cm long) using 0.9 % saline as mobile phase at 4°C (column was installed inside a refrigerator, 4°C).
The purified conjugate was collected in fractions (~ 1 mL per tube). The protein concentration and Degree of Labeling (DOL) (dye to antibody ratio) of each fraction was determined by measuring the absorption at 280 and 780 nm. Equations 1 and 2 were used to estimate the DOL and protein concentration of each fraction where molar extinction coefficient of panitumumab (εprotein) and IRDye (εdye) in 1:1 methanol and PBS are 200,000 and 270,000 M−1cm−1 respectively. An absorbance correction factor of 0.03 for IRDye 800CW at 280nm (equal to 3.0% of its absorbance at 780nm) was implemented in equations 1 and 2. MWprotein is the molecular weight of the protein (~147 kDa). Dilution factor is the dilution of the labeled conjugate prior to measurement by spectrophotometer.
| (eq.1) |
| (eq. 2) |
Fractions having protein concentration ≥ 2 mg/mL and DOL within the range of 1–2 were mixed together. Product was then filtered through a 0.22 micron sterile syringe filter (Acrodisc, PN4612, Pall Corp., Ann Arbor, MI) into a 20 mL sterile vial (Hollister-Stier Laboratories, Spokane, WA).
Synthesis of panitumumab-FITC and FITC-panitumumab-IRDye800 conjugates
2.0 mL of panitumumab solution (40 mg, clinical drug, in saline) was transferred to a 15 mL Eppendorf tube and 2.5 mL of 1.0 M PBS (pH 8.5) was added to the tube for pH adjustment (~ 8). To this solution approximately 3 equivalent of NHS-ester of fluorescein dye (FITC) solution in water was added. The mixture was incubated with gentle shaking for 2 hrs at 20°C in a temperature controlled shaker (Multi-Therm, Thermo Scientific). The mixture was then purified over a Sephadex G25 glass column (2 cm ID and 25 cm long) using 0.9 % saline as mobile phase at 4 °C (column was installed inside a refrigerator).
The conjugate was purified with the procedure detailed above for the dye-conjugate. DOL and protein concentration were determined using following equations (eq. 3 and 4) where 0.3 is the correction factor for the absorbance of FITC at 280 nm.
| (eq. 3) |
| (eq. 4) |
where εfluor. of FITC = 70,000 M−1 cm−1
A portion of panitumumab-FITC conjugate (~ 5 mg) was then conjugated with IRDye 800CW. Conjugation and purification was performed following above procedure. DOL and protein concentration were determined using following equations (eq. 5 and 6).
| (eq. 5) |
| (eq. 6) |
Quality Control Tests
The filter integrity of the sterilizing filter was tested in a bubble point procedure after completion of the sterile filtration step, whereby the sterilizing filter was placed on a gas line with a pressure gauge and the outlet of the filter was placed under water. The gas pressure on the inlet to the filter was increased slowly until a steady stream of bubbles was observed at the filter outlet. The pressure at which the bubble stream begins was recorded and compared with the manufacturer's pressure filter rating (from the manufacturer's specification).
The final product solution in the sterile vial was examined visually and required to be clear without any visible particulates.
A small amount (300 μL) of product was withdrawn for further QC tests. Chemical purity and identity of the product was determined by analytical HPLC analysis on a Shimadzu HPLC system (Columbia, MD) equipped with variable UV detector preset to 280 nm and 780 nm. 10 μL of diluted sample was injected on to an analytical size-exclusion column (TSK Gel, Tosoh Biosciences) which was eluted with a mobile phase of 0.05M PBS. The column flow rate was 0.5 mL/min and was kept at room temperature. The retention time of the conjugate is ~ 14 min.
The pH of the final product was measured using pH test strips. The test strips were calibrated by pipetting (~ 2.0 μL) standard pH 5 and pH 7-calibrated commercial solution onto the individual strips. The color of the strips must match the pH 5 and pH 7 on the color key supplied with the test strips. Then the sample was pipetted on to another test strip, the color checked against the color key, and the result was recorded.
Bacterial endotoxin in the product was quantified per USP guideline using the portable test system (PTS) from Charles River.
The USP sterility test was performed for three batches following USP general chapter <71>.
Storage stability
Panitumumab-IR-Dye conjugate was stored at 4 °C and at room temperature for 10 days in the dark. Purity was checked every 24 h by HPLC at 780 nm.
In-vitro studies
Receptor binding
In-vitro binding and target specificity of panitumumab-IRDye800 was assessed using methanol-fixed EGFR-expressing MDA-MB-468 cells. Panitumumab-IRDye800 was diluted in 20% BSA in PBS (~25 μg in 50 μL). Cells were fixed in six small test tubes (~1 million cells per tube). Cells in three test tubes were pretreated with a solution of pure (unlabeled) panitumumab (50 μg in 50 μL of 20% BSA in 1 X PBS) and incubated for 1 h at 37 °C in order to block the EGF receptors. Cells were then washed three times with PBS. All six tubes were then treated with 50 μL of panitumumab-IRDye800. After 1 h of incubation at 37 °C the cells were washed three times with 1X PBS and finally suspended in 0.5 mL PBS before collecting flow-cytometry data using excitation wave-length of 780 nm.
Impact of NIR-dye conjugation on receptor binding
Cells (MDA-MB-468) were fixed in six small test tubes (~1 million cells per tube). Cells in three test tubes were incubated with a FITC labeled panitumumab (25 μg in 50 μL of 20% BSA in 1 X PBS) and other three tubes were incubated with FITC-panitumumab-IRDye800 conjugate (25 μg/tube) at 37 °C. After 2 h of incubation at 37 °C the cells were washed three times with 1X PBS and finally suspended in 0.5 mL PBS before collecting comparative fluorescence data by flow-cytometry using 488 nm as an excitation wavelength.
Determination of HER1 expression by flow cytometry analysis
Breast cancer cells (BT-474, MDA-MB-231, and MDA-MB-468) were used to develop tumor models of different HER1 expression levels.14 All cell lines were received from the Development Therapeutics Program/DCTD/NCI/NIH Tumor Repository (Frederick National Laboratory for Cancer Research, Frederick, MD) and were grown as monolayers at 37 °C, in a humidified atmosphere of 5% CO2 and 95% air. Cells were cultured in RPMI 1640 medium supplemented with 10% fetal bovine serum (Hyclone) and 2mM glutamine (Life Technology, Grand Island, NY). Exponentially growing cells were washed twice with ice cold PBS. Cells were fixed in 9 small test tubes (~1 million per test tube, 3 tubes per cell line) and were incubated with FITC-panitumumab (25μg per test tube) for 2 h at 37 °C. Cells were washed three times with 1XPBS and finally suspended in 0.5 mL PBS before flow-cytometry analysis with an excitation wavelength (λex) of 488 nm.
Animal Studies
Animal Models
Animal studies were conducted in an approved protocol in accordance with the Frederick National Laboratory for Cancer Research (Frederick, MD) Animal Care and Use Committee guidelines. Female athymic nu/nu mice (n = 5 per cell line for imaging and n=2 per biodistribution time point) were obtained from Charles River Laboratories, Inc. (Frederick, MD) at 6 weeks of age. Breast cancer BT-474, MDA-MB-231, and MDA-MB-468 cells, which correspond to very low (HER1 negative), mid and high HER1 protein expression levels,14 were subcutaneously injected (1 × 10⁶ cells) on the right of the midline in the dorsal lumbar region. In vivo fluorescence imaging was performed when tumors reached approximately 5 mm in the longest diameter. Mice were provided an alfalfa free diet (AIN-93G, Harlan Laboratories, Indianapolis, IN) to reduce auto-fluorescence and the drinking water contained 2ml/L amoxicillin to reduce corynebacterium bovis (C. bovis; dermatitis). All animal procedures were performed under anesthesia by inhalation of 1% – 2% isoflurane (Abbott Laboratories, IL) with a 1 liter per minute oxygen flow.
In-vivo fluorescence imaging
The FMT-2500 scanner (PerkinElmer, Waltham, MA) was calibrated with IRDye800 according to the manufacturer's recommended procedure and quantification of the fluorescence data was performed with TrueQuant software (version 3.0, PerkinElmer, Waltham, MA). Mice were imaged in the prone position using the VISEN FMT 2500 (PerkinElmer, Waltham, MA) small animal scanner with a 790 ± 3 nm excitation and a 810 ± 30 nm emission filter. 2D epi and 3D trans-illumination acquisitions were performed at 24, 48, 72, 96, and 144 hours post intravenous injection of 100 μL panitumumab-IRDye800 (100 μg of panitumumab). Animals remained conscious and were allowed free access to food (alfalfa free) and water (2ml/L Amoxicillin) prior to and after IRDye800 injection. Animals were placed on a heated blanket for thirty minutes prior to injections and before and after imaging sessions to provide and maintain a constant animal internal temperature of 37°C. The scanner provides a heated environment to maintain the animal body internal temperature of 37°C.
Ultrasound 3D tumor volumes were acquired to correct for non-uniform uptake of the fluorescence imaging agent due to necrotic areas within the tumor. Animals were placed in the prone position on a heated stage which monitors the mouse cardiac and pulmonary functions. Tumor volumes were acquired in 3D-mode using the Vevo2100 ultrasound scanner (VisualSonics, Inc, Toronto, Canada), MS-550s transducer at 40 MHz with 0.076 mm step size (image thickness) and analyzed using the parallel ROI algorithm (Vevo2100 VisualSonics, version 1.2.1.0, Toronto, Canada).
ROI's were manually drawn on the tumor to obtain total 2D total fluorescence signal (counts/energy), normalized by the ROI area and averaged within each tumor group and pertinent post-injection time-point. Analysis of 3D images incorporated a manual 3D ROI and normalized by the ultrasound tumor volume.
Biodistribution Studies
Biodistribution studies were performed on BT-474 (low EGFR) tumor bearing athymic nude female mice (n = 2 per time point). 100 μL of panitumumab-IRDye800 was administered (IV tail-vein) to each mouse. Mice were euthanized (CO2 asphyxiation) at pre-determined time-points (24, 48, 72, 96, and 144 hour post-injection) and the pertinent organs (blood, spleen, gut, bladder, liver, kidney, ovaries, uterus, axial lymph nodes, heart, lung, salivary glands, thyroid, brain, skin, muscle, femur, and tumor) were excised, washed in PBS, weighed, and imaged using the previously described 2D in vivo image acquisition parameters. IRDye800 concentrations (%ID/g) were analyzed at each time point for the select solid organs. The total fluorescence signal within the gut included the stomach and small and large bowel which were used to compute the gastrointestinal system. The total whole body fluorescence signal, utilized to obtain the percent injected dose, was calculated as the sum of the ventral and dorsal whole body 2D fluorescence signals.
Results and Discussion
Bioconjugation and purification
In order to minimize possible photo bleaching reduced light condition is recommended during synthesis and purification. In the bioconjugation reaction the succinimidyl ester group of NIR-dye reacts with a lysine residue of the mAb to form a stable peptide linkage.15 After 2 h of reaction, the conjugate was purified on a G25 size exclusion column and the product was collected in fractions (Figure 1). Early-front and late-tail fractions from the column (Figure 1) were discarded due to low protein concentration and possible mixing of free dye into the conjugate. The purity of the product was determined by analytical HPLC using a size exclusion chromatography column.
Figure 1.

Panitumumab-IRDye800 elution profile from size exclusion column using 0.9% saline as mobile phase.
At basic pH, reacting ~ 2.3 equivalent of NIR-dye resulted in dye to mAb ratio, or DOL, of 1–2. A representative UV-spectrum of panitumumab-IRDye800 conjugate (DOL 1.1) is shown in Figure 2a. Yield and purity of the panitumumab-IRDye800 conjugate was > 80 ± 5% and > 95 ± 3% (n = 6), respectively.
Figure 2.

UV-Vis-NIR spectra of conjugates. (a) Panitumumab-IRDye800; (b) Panitumumab-FITC; (c) IRDye800-panitumumab-FITC (bi-color probe).
Panitumumab was conjugated with a very low molecular wt. dye FITC (pan-FITC, Figure 2b) and then also labeled with IR-Dye (IRDye-pan-FITC, Figure 2c) for in vitro studies to determine the impact of IRDye800 labeling on receptor affinity of panitumumab-IRDye800.
Product Quality
QC tests were performed on every batch to assure product quality for the in-vivo study and to assure the synthetic procedure is reproducible. QC tests included analysis of drug product in sterile vial for particulates, and integrity of the sterilizing filter. Approximately 300 μL of the product was withdrawn for the determination of pH, purity, identity, apyrogenicity, sterility, and storage stability of the product following the standard USP recommendations of clinical-grade imaging drugs. QC results of three batches are listed in Table 1.
Table 1.
QC results of three panitumumab-IRDye800 batches
| Quality Control Test | Description | Acceptance | PAN-IRDye-MBR-01 | PAN-IRDye-MBR-02 | PAN-IRDye-MBR-03 |
|---|---|---|---|---|---|
| Particulates | Visual inspection for particulates | clear | clear | clear | clear |
| Filter integrity | Bubble point test | > 46 psi | 55 | 62 | 56 |
| PH | pH using pH paper | pH must be between 6 and 8 | 7.0 | 7.0 | 7.0 |
| Chemical purity | HPLC at 780 nm | ≥ 90% | > 95 ± 2.0% | > 95 ± 2.0% | > 96 ± 2% |
| Degree of labeling (DOL) or d/p ratio | Calculation based on equation 1 | 0.8 to 2 | 1.4 ± 0.10 | 1.4 ± 0.05 | 1.3 ± 0.10 |
| Bacterial Endotoxin Levels | Limulus Amoebocyte Lysate (LAL) by PTS | < 175 EU per dose | < 2 | < 2 | < 2 |
| Sterility Test (14 days) | USP sterility test (USP <71>) | no growth | no growth | no growth | no growth |
Analytical HPLC is one of the most important QC experiments to determine the quality of the product including chemical purity and identity and the amount of impurities present in the final dose. The product was identified by the matching HPLC retention time (UV monitoring at 280 nm) of the conjugate (Figure 3b) with pure panitumumab (Figure 3a). Presence of free dye as impurity and it's quantity in the final product was also identified by comparing HPLC retention time (at 780 nm) of pure dye and conjugate (Figure 3c).
Figure 3.

HPLC chromatograms (HPLC column: TSK Gel, mobile phase: 0.05 M PBS, flow rate: 0.5 mL/min). (a) panitumumab at 280 nm; (b) IRDye at 780 nm; (c) panitumumab-IRDye800 conjugate at 780 nm. Arrow points to the trace amount of free dye impurity in purified conjugate.
The stability measurement observed that the conjugate is highly stable through 10 days in both room temperature and at 4 °C. These results indicate that the quality is sufficient to proceed to early human trials under an FDA Investigational New Drug filing.
In-vitro studies
Cell binding and blocking experiments were performed with MDA-MB-468 cells (1million) with a mean fluorescence intensity of 2640 ± 150 (n = 3). After blocking with 50 μg of pure panitumumab the fluorescence intensity was reduced to 490 ± 50 (n = 3), Figure 4(a), which demonstrates that the binding of panitumumab-IRDye800 was target specific. Background cell fluorescence (Pan only) intensity at 780 nm excitation wavelength was very low (~ 35 ± 5).
Figure 4.

In-vitro studies of panitumumab-IRDye800 using flow-cytometry technique. (a) ~ 85% reduction of cell binding affinity of the panitumumab-IRDye800 after blocking the cells (MDA-MB-468) with pure panitumumab; (b) the difference in binding between FITC-panitumumab (i.e. panitumumab) and FITC-pantumumab-IRDye800 (i.e. panitumumab-IRDye800) which is about ~ 20% reduction of receptor binding due to the conjugation of IRDye800 (DOL 1.62); (c) EGFR-expression of three cell lines stained with FITC-panitumumab.
Comparative cell binding study (Figure 4b) using bicolor probe (FITC-panitumumab-IRDye800) revealed impact of IRDye800 on receptor binding. It is anticipated that labeling of large mAb panitumumab with a very small FITC molecule in a very low molar ratio (1:1or DOL 1) may not alter the receptor binding affinity significantly. Therefore, FITC-panitumumab is used as a control to show the standard binding affinity of panitumumab to EGFR. This binding affinity was compared with FITC-panitumumab (1:1) labeled with NIRDye800 (DOL 1.62) using the cxcitation wavelength of FITC (488 nm). Here FITC is used as the only fluorescence signaling entity because IRDye800 doesn't fluoresce at the excitation wavelength of FITC. Figure 4(b) showed the difference in binding between FITC-panitumumab (i.e. panitumumab) and FITC-pantumumab-IRDye800 which is about ~ 20% reduction in fluorescence intensity i.e. receptor binding due to the conjugation of NIR-Dye to the panitumumab.
In-vitro flow-cytometry cell binding analysis using FITC-panitumumab confirmed the HER1 (EGFR) expression level of the cell lines BT-474, MDA-MB-231, and MDA-MB-468 implemented in the mice xenografts studies have very low, moderate, and very high HER1 expression respectively (Figure 4(c)).
Fluorescence imaging in xenografts
Immuno-fluorescence imaging of NIR-panitumumab was performed on tumor bearing athymic nude mice with breast cancer cell lines of predefined EGFR expression: BT-474, very low expression (negative control), MDA-MB-231 (moderate), and MDA-MB-468 (high). Confirmation studies of EGFR-expression levels for these three cell lines are shown in Figure 4(c).
Representative 2D fluorescence images performed at 24 h post-injection are presented in Figure 5. Quantification of the 2D analysis demonstrated that the 24 h time point is the maximum uptake of panitumumab-IRDye800 with 11 ± 1 fluorescence signal/area (n = 5 mice) for MDA-MB-231 tumors and 15 ± 1 fluorescence signal/area (n=5) for MDA-MB-468 tumors (Figure 6). Kinetics of the panitumumab-IRDye800 for 2D and 3D in vivo imaging is presented in Figure 6 and Figure 7, which correlates with HER1 protein expression (Figure 4(c)) of corresponding cell lines. 2D and 3D in vivo images of mice xenografts at various time points are shown in the supporting information (Figure S1 and Figure S2).
Figure 5.
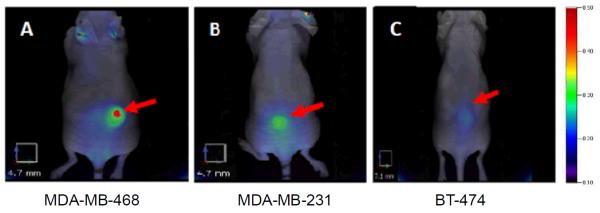
2D epi-fluorescence FMT images of panitumumab-IRDye800 of various HER1-expressing tumor (MDA-MB-468, MDA-MB-231, BT474) bearing athymic nude female mouse models at 24 h post injection (100 μL of 1mg/mL conjugate). Red arrows point to the representative HER1 tumors. All images have same color scale. Trace amount of tracer accumulated in ears probably due to the inflammation caused by ear punch.
Figure 6.

Tumor uptake kinetics 2D in-vivo analysis of panitumumab-IRDye800 for various HER1 expressing tumor models (n = 5 per tumor model).
Figure 7.

3D in-vivo analysis of panitumumab-IRDye800 uptake kinetics for various HER1 expressing tumor models (n = 5 per tumor model). The fluorescence tumor signal of BT474 (low HER1 expression) tumor was comparable to background (non-specific binding).
PET studies with 89Zr labeled panitumumab were previously reported14 with same tumor models. Uptake of panitumumab labeled with IRDye800 or [89Zr] in different tumor xenografts with high, medium, and low EGFR expression, as measured by radioactive counts or fluorescence are highly correlated (r2= 0.99), shown in Figure 8.
Figure 8.

Uptake of panitumumab labeled with IRDye800 or [89Zr] in different tumor xenografts with high, medium, and low EGFR expression, as measured by radioactive counts or fluorescence are highly correlated.
Panitumumab is a fully human antibody and it has no cross reactivity with mice EGFR.14 Presence of very high human EGFR-expressing tumor in mice would act as one and only `EGFR sink' and injected tracer would rapidly accumulate mainly to the tumor. Hence, it would be difficult to determine major organ uptake at different time points if highly EGFR-expressing human tumor xenograft model is used. Therefore, to assess the uptake of panitumumab-IRDye800 conjugate in selected organs with time, biodistribution studies were conducted in BT-474 xenograft (very low EGFR expression) tumor bearing athymic nude mice over one week. Biodistribution of panitumumab-IRDye800 is presented in Figure 9 for all excised organs by 2D ex-vivo imaging (Figure 10). As there is no cross-reactivity between human antibody panitumumab and mouse HER1, blood clearance through native `HER1 sink' is expected to be very slow in a mouse in comparison to a human. Mouse data showed very slow linear lymphatic clearance.14 Accumulation of the tracer was seen prominently in the axillary lymph nodes at all-time points.
Figure 9.

Biodistribution of panitumumab-IRDye800 (%ID/gm) in BT474 (very low HER1 expression) tumor bearing female athymic nude mice (n = 2 per time point) in various organs.
Figure 10.

Ex-vivo images of different organs of BT474 tumor bearing mice for biodistribution studies. 100 μL of panitumumab-IRDye800 was administered (tail vein) in each mice. At a particular time point organs are excised and placed on an imaging plate before 2D FMT imaging. Selected organs are labeled in this image.
This in-vivo study establishes that sensitivity of the optical imaging with panitumumab-IRDye800 is sufficient for detecting tumors with very low to high EGFR-expression levels.
Conclusions
IRDye800 labeled panitumumab has been reproducibly prepared with very high yield and purity. QC results demonstrate that product is sterile and pyrogen free as per USP specifications and therefore suitable to proceed to human trials. The immunoconjugate was found to be stable for > 10 days both at room temperature and at 4 °C. Preclinical studies with different levels of EGFR-expressing cell lines demonstrate that panitumumab-IRDye800 represents a promising optical imaging probe for EGFR-expressing carcinomas. The high sensitivity and high specificity of panitumumab-IRDye800 clearly suggest its suitability as an intraoperative diagnostic probe in image-guided surgery not only of head and neck but also of other types of EGFR-expressing cancers. Further works towards the clinical translation of panitumumab-IRDye800 for its potential use in surgery are underway. The synthesis methodology described here can be broadly applied to other antibodies in other cancer types.
Supplementary Material
Acknowledgements
Authors are thankful to Refika Turnier for collecting flow-cytometry data. This project has been funded in whole or in part with federal funds from the National Cancer Institute, National Institutes of Health, under Contract No. HHSN261200800001E. The content of this publication does not necessarily reflect the views or policies of the Department of Health and Human Services, nor does mention of trade names, commercial products, or organizations imply endorsement by the U. S. Government.
Footnotes
Supporting informations 2D and 3D in vivo images of mice xenografts at various time points are shown in Figure S1 and Figure S2.
Notes and References
- 1).Hickey R, Vouche M, Sze DY, et al. J. Vasc. Interv. Radiol. 2013;24:1167–1188. doi: 10.1016/j.jvir.2013.04.023. [DOI] [PMC free article] [PubMed] [Google Scholar]
- 2).Vahrmeijer AL, Hutteman M, Vorst JRVD, Velde CJHVD, Frangioni JV. Nature Reviews Clin. Oncol. 2013;10:507–518. doi: 10.1038/nrclinonc.2013.123. [DOI] [PMC free article] [PubMed] [Google Scholar]
- 3).Boppart SA, Luo W, Marks DL, Singletary KW. Breast Cancer Res. Treat. 2004;84:85–97. doi: 10.1023/B:BREA.0000018401.13609.54. [DOI] [PubMed] [Google Scholar]
- 4).Fuss L. Mol. Oncol. 2008;2(2):115e52. [Google Scholar]
- 5).Choy G, Choyke P, Libutti SK. Mol. Imag. 2003;2(4):303–312. doi: 10.1162/15353500200303142. [DOI] [PubMed] [Google Scholar]
- 6).Gioux S, Choi HS, Frangioni JV. Mol. Imag. 2010;9:237–255. [PMC free article] [PubMed] [Google Scholar]
- 7).Gioux S, Coutard JG, Berger M, Grateau H, Josserand V, Keramidas M, Righini C, Coll JL, Dinten JM. J. Biomed. Opt. 2012;17:106014. doi: 10.1117/1.JBO.17.10.106014. [DOI] [PubMed] [Google Scholar]
- 8).Burgess AW. Growth Factors. 2008;26:263–274. doi: 10.1080/08977190802312844. [DOI] [PubMed] [Google Scholar]
- 9).Ciardiello F, Tortora G. Expert Opin. Investig. Drugs. 2002;11:755–768. doi: 10.1517/13543784.11.6.755. [DOI] [PubMed] [Google Scholar]
- 10).Nayak TK, Germastani K, Baidoo KE, Milenic DE, Brechbiel MW. J. Nucl. Med. 2010;51:942–950. doi: 10.2967/jnumed.109.071290. [DOI] [PMC free article] [PubMed] [Google Scholar]
- 11).Wu M, Rivkin A, Pham T. Clin. Ther. 2008;30:14–30. doi: 10.1016/j.clinthera.2008.01.014. [DOI] [PubMed] [Google Scholar]
- 12).Heath CH, Deep NL, Sweeny L, Zinn KR, Rosenthal EL. Ann. Surg. Oncol. 2012;19(12):3879–87. doi: 10.1245/s10434-012-2435-y. [DOI] [PMC free article] [PubMed] [Google Scholar]
- 13).Day KE, Sweeny L, Kulbersh B, Zinn KR, Rosenthal EL. Mol. Imaging Biol. 2013;15(6):722–729. doi: 10.1007/s11307-013-0652-9. [DOI] [PMC free article] [PubMed] [Google Scholar]
- 14).Bhattacharyya S, Kurdziel K, Wei L, Riffle L, Kaur G, Hill GC, Jacobs PM, Tatum JL, Doroshow JH, Kalen JD. Nucl. Med. Biol. 2013;40:451–457. doi: 10.1016/j.nucmedbio.2013.01.007. [DOI] [PMC free article] [PubMed] [Google Scholar]
- 15).Bhattacharyya S, Wang S, Reinecke D, Kiser JK, Kruger RA, DeGrado TR. Biocon. Chem. 2008;19:1186–1193. doi: 10.1021/bc700482u. [DOI] [PMC free article] [PubMed] [Google Scholar]
Associated Data
This section collects any data citations, data availability statements, or supplementary materials included in this article.