

Abstract

We investigate the aerobic oxidation of high-pressure, high-temperature nanodiamonds (5–50 nm dimensions) using a combination of carbon and oxygen K-edge X-ray absorption, wavelength-dependent X-ray photoelectron, and vibrational spectroscopies. Oxidation at 575 °C for 2 h eliminates graphitic carbon contamination (>98%) and produces nanocrystals with hydroxyl functionalized surfaces as well as a minor component (<5%) of carboxylic anhydrides. The low graphitic carbon content and the high crystallinity of HPHT are evident from Raman spectra acquired using visible wavelength excitation (λexcit = 633 nm) as well as carbon K-edge X-ray absorption spectra where the signature of a core–hole exciton is observed. Both spectroscopic features are similar to those of chemical vapor deposited (CVD) diamond but differ significantly from the spectra of detonation nanodiamond. The importance of these findings to the functionalization of nanodiamond surfaces for biological labeling applications is discussed.
Introduction
Nitrogen vacancy centers (NVCs) in diamond have great promise for applications in quantum computing, fluorescence labeling, and electric and magnetic field sensing.1−10 Several exciting advances have been recently reported including nuclear magnetic resonance spectroscopy on nanometer length scales11,12 and fluorescence imaging with 20 nm spatial resolution.13 When NVCs are embedded in diamond nanocrystals (NDs), they can be dispersed on biological samples and their fluorescence tracked continuously over many hours.14−17 To transform fluorescent NDs into targeted biological probes, methods are needed to functionalize their surfaces with solubilizing ligands and biological tags that afford labeling specificity.
Most strategies to functionalize NDs have been developed using detonation nanodiamond (DND) that is prepared in a “bottom-up” explosion synthesis. However, DNDs generally do not support NVCs, and recent efforts to prepare soluble diamond probes have focused on NDs that are fabricated in a “top-down” fashion from bulk chemical vapor deposited (CVD) diamond18 or high-pressure, high-temperature diamond (HPHT) where less is known about surface structure (Figure 1). DND surfaces are known to be terminated by many types of functional groups including carboxylic acid moieties, which are abundant19−21 and can be used to form amide bonds21−23 or to graft layers of silicon dioxide after reduction.24 However, DND surface structure is distinct from oxidized bulk single crystal diamonds, where alcohol and ether functionalities are typically found.25 Thus, it remains an interesting and important question whether surfaces of oxidized HPHT NDs and other nanocrystals produced by “top-down” fabrication methods will have surface chemistry akin to bulk crystals or DND.
Figure 1.

Bulk HPHT diamond is type Ib and contains approximately 100–200 ppm of nitrogen that produces its yellow color. Ball milling and size fractionation yield a black powder composed of nanometer scale crystallites ranging in size from 5 to 50 nm. Graphitic and amorphous carbons can be removed from unoxidized HPHT NDs by aerobic oxidation, causing the powders to become progressively lighter in tone as the oxidation temperature increases to 575 °C.
Commercially available samples of DND and HPHT NDs are complex mixtures of diamond and graphitic carbons. High temperature oxidation of this mixture is typically performed prior to surface functionalization or photophysical investigations to selectively remove the graphitic carbons. The oxidation step produces a number of desirable properties: (1) reduction of background fluorescence, (2) termination of the ND surface with carbon–oxygen functionalities useful for derivatization, (3) increased solubility in aqueous environments afforded by readily ionized surface functionalities, and (4) in the case of HPHT NDs stabilization of the NV– charge state.22 Using a suite of spectroscopic techniques and transmission electron microscopy, we investigate the structure of HPHT NDs after aerobic oxidation and demonstrate that their surface structure is similar to chemical vapor deposited (CVD) single crystal diamond and distinct from DND. Hence, functionalization strategies that target alcohols would improve soluble magnetic resonance probes fabricated using “top-down” strategies.
Results and Discussion
HPHT NDs used in this study were aerobically oxidized at temperatures between 475 and 575 °C to remove graphitic carbons. At these temperatures the oxidation proceeds quickly (2–24 h) and selectively, preserving a high fraction of the starting diamond. Complete combustion is observed at higher temperatures and longer times. Diamonds were analyzed before and after oxidation using transmission electron microscopy (TEM) at accelerating voltages from 80 to 200 keV. Irregularly shaped crystallites are observed with a broad distribution of dimensions in the range of 5–50 nm (Figure 2 and Figure S4). A minor amount of amorphous carbon was visible that is eliminated by aerobic oxidation of the samples prior to imaging (2 h at 575 °C). Crystallite sizes used in this study were measured with TEM and found to center around 13 and 15 nm before and after aerobic oxidation (Figure S4).26 Figure 2A–C shows several crystallites where an abundance of [111] derived terraces, edges, and facets are visible. Using an environmental TEM, we monitored oxidative etching of the diamond in real time by introducing oxygen into the sample chamber (Figure 2D and Supporting Information). Etching of the diamond occurred in a layer by layer fashion that revealed a [111] facet, a pattern observed previously in studies of bulk diamond.27 Thus, we conclude that HPHT NDs are terminated by a significant fraction of [111] facets produced by crystallite cleavage during ball-milling and aerobic oxidation.28−30
Figure 2.

(A) TEM image (200 keV) of an oxidized HPHT ND with (111) and (111̅) facets at ∼70°, very near the theoretical angle of 70.5°. (B) A higher magnification image of a crystallite edge with (1̅11) termination. White lines highlight the (111) and (1̅11) planes that are indexed to θ = 70.5°. A lattice spacing of 0.210 nm is consistent with that predicted for 111 interplanar spacing. Amorphous carbon is also visible on the nanocrystals edge. (C) Aberration-corrected image taken with 80 keV accelerating voltage give enhanced atomic resolution. Inset shows electron diffraction with (200) and (111) reflections consistent with a zone axis along [110]. Lattice fringes of 0.182 and 0.217 nm are near that expected for the (200) and (111) lattice spacing. (D) One frame from a movie of in situ oxidation where etching occurs along the [111] and [001] facet directions (see Supporting Information for full movie).
Removal of graphitic carbon impurities after oxidation at temperatures from 475 to 575 °C is conveniently monitored using UV-Raman and visible-Raman spectroscopies (λexcit = 325 and 633 nm) (Figure 3). After 2 h of oxidation at 575 °C, the broad vibrational bands from graphitic carbons decrease in intensity, leaving a single sharp signal that is characteristic of cubic phase diamond (ν = 1332 cm–1, fwhm = 5.1 cm–1).31 This spectrum is nearly indistinguishable from that of bulk CVD diamond, except for a slightly broader line width (5.1 cm–1 vs 2.8 cm–1), implying that HPHT NDs have long-range crystallographic order. In comparison, the UV-Raman spectrum of DNDs oxidized for 5 h at 475 °C is broad and red-shifted (ν = 1327 cm–1, fwhm = 19.2 cm–1) and displays a tail on the low-energy side of the diamond vibration. These effects have been previously ascribed to lattice strain, defects, and phonon confinement (Figure 3).32 In addition, signals derived from graphitic carbons remain after oxidation (1500–1800 cm–1).
Figure 3.
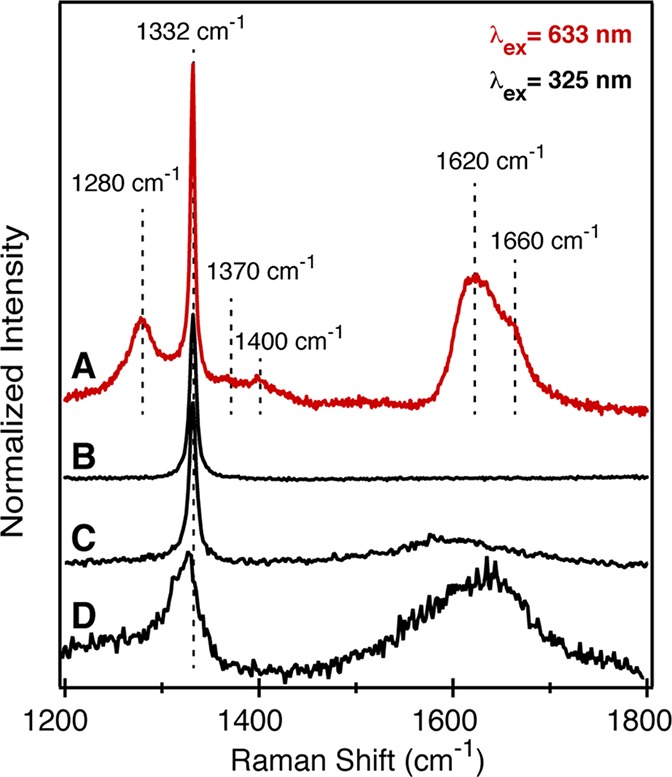
(A) Visible-Raman spectrum (λexcitation = 633 nm) of HPHT NDs aerobically oxidized at 575 °C for 2 h. (B) UV-Raman spectra (λexcitation = 325 nm) of HPHT NDs aerobically oxidized at 575 °C for 2 h, (C) unoxidized HPHT NDs, and (D) DNDs after 2 h of aerobic oxidation at 475 °C.
Raman spectroscopy at visible wavelengths is not typically used to analyze NDs because absorption, fluorescence, and resonance enhancement of disordered graphitic carbons obscure the signal from diamond. As a result, Raman spectra of DNDs have only been obtained in the UV where there is stronger resonance enhancement of the diamond signal.32 However, oxidized HPHT NDs produced in this study showed a sharp signal from diamond at visible wavelengths (λexcit = 633 nm). Several vibrational modes from graphitic carbons are also visible including signals at 1280, 1370, 1400, 1620, and 1660 cm–1. These features are distinct in line width and energy from the broader band of graphitic carbons prior to oxidation as well as those found in DND samples (Figure 3).33,34 We attribute these signals to olefinic species formed at ND surfaces during the ball-milling and/or aerobic oxidation processes. Undercoordinated atoms on diamond surfaces are known to reorganize producing chains of sp2-hybridzed carbons known as a Pandey reconstruction.35−37 A theoretical study predicts the vibrational modes of the C(111)-(2 × 1) and C(110)-(2 × 1) reconstructions to appear in the range of 1100–1500 cm–1, consistent with the signals in our Raman data.38 However, these reconstructions typically occur above 900 °C on bulk diamond facets and requires an effect such as the surface tension of the nanocrystallite to lower the barrier if these signals are to be explained by a C(111)-(2 × 1) reconstruction.35
Raman bands at 1620 and 1660 cm–1 are near the frequency of the E2g mode of olefinic carbons that result from in-plane motion of pairs of sp2 atoms. In diamond-like carbons this band shifts from the frequency of crystalline graphite (1581 cm–1) toward the frequency of isolated sp2 dimers (1630 cm–1) as the graphitic domains shrink and the sp3 content increases.39 The frequency of this band in our oxidized samples suggests that the graphitic carbons do not cluster to form extended domains. Similarly, the lack of a D band (1370 cm–1) arising from the A1g breathing mode argues against the presence of complete six-membered rings. These bands are therefore most consistent with sp2 centers that form chains.40 A previous study of DND concluded that Raman bands at 1620 and 1660 cm–1 can arise from O–H stretching modes of surface alcohols or acids, but deuterium exchange reactions (−OH → −OD) on our samples did not affect the Raman spectrum, arguing against this assignment.41 Despite the relatively large intensity of these bands in the visible-Raman spectrum, X-ray absorption and photoelectron spectroscopy indicate that graphitic carbons are found in low abundance compared to other oxygen containing functional groups (see below).
To investigate both the graphitic and oxygen containing functionalities in greater detail, we turned to K-edge NEXAFS spectroscopy (Figure 4A,B). Carbon and oxygen K-edge NEXAFS probe the unoccupied density of states with p-orbital character. At these energies and in total electron yield mode, the technique has a 5–10 nm probe depth and can be used to measure the types and ratios of functional groups.42 For example, carbon K-edge spectra of unoxidized and oxidized HPHT NDs show several pre-edge features including π*(C=C) (∼285.0 eV) and π*(C=O) (286.7 and 288.3 eV) resonances (Figure 4A). The energies of the π*(C=O) resonances (286.7 and 288.3 eV) are consistent with those expected for carboxylic acids or acid anhydrides rather than other carbonyls.43,44 A signal of low intensity (530.0 eV) in the oxygen K-edge spectra is distinct from the σ*(C–O) and σ*(C=O) shape resonances and at an energy expected for carbonyl species (π*(C=O)) including ketones, acids, and acid anhydrides (Figure 4B).43−45 While in principle the (C–O):(C=O) functional group ratio can be measured by integrating the peak areas in this spectrum, it is complicated by overlap of σ*(C–O) and σ*(C=O) shape resonances in the 536–540 eV range. However, the much weaker intensity of the π*(C=O) signal compared to the σ*(C–O) and σ*(C=O) resonances supports a surface primarily terminated by singly bonded C–O bonded functional groups such as alcohols and ethers and minor amounts of carbonyls and graphitic carbons.
Figure 4.

Carbon (A) and oxygen (B) K-edge NEXAFS spectra of HPHT NDs oxidized at 575 and 475 °C (red) compared with unoxidized HPHT nanocrystals and aerobically oxidized DND. The sharp signal from a core–hole exciton is visible at 289.0 eV in samples of HPHT and absent in samples of DND. Signals from π*(C=C) and π*(C=O) (∼285.0, 286.7, and 288.3 eV) decrease as the oxidation temperature is increased. Oxygen K-edge spectra show a decrease in the π*(C=O) resonances at 530 and 534.3 eV as the oxidation temperature increases. (C) Wavelength-dependent XPS spectra of a partially oxidized sample (500 °C, 2 h) showing the expected change in the ratio of signals from bulk (C–C) and surface (C=C, C–O, C=O) species as the excitation energy increases (410 → 950 eV) and the electron mean free path of the photoelectrons increases. (D) XPS spectra of HPHT nanocrystals oxidized at 575 °C. The spectra are dominated by signals from bulk diamond (C–C) and alcohol and ether functional groups (C–O). A minor signal from (C=O) is visible, while signals from (C=C) were not detected.
Two signatures of crystalline diamond are also clearly visible in the carbon K-edge spectra including the sharp signal of a core–hole exciton (289.0 eV) as well the second bandgap in the diamond band structure (302.1 eV) (Figure 4A). The excitonic feature, in particular, is characteristic of high quality diamond and a fingerprint of its periodic electronic structure.46,47 While this signal has been observed in nanocrystalline diamond films (2–100 nm grain size), this is the first observation in colloidal diamond nanocrystals.48 This signature is absent from previous NEXAFS studies of DND nanocrystals as well as our own measurements (Figure 4A) because of its more defected lattice.19,49 This observation together with the Raman features clearly demonstrates the higher crystallinity of HPHT ND compared to DND.
NEXAFS can be used to monitor the amount of graphitic carbon present before and after aerobic oxidation.50 By integrating the π*(C=C) (284.0–286.0 eV) and σ*(C–C) resonances (293.0–302.0 eV) and comparing it with the analogous ratio from a reference spectrum of highly oriented pyrolytic graphite (HOPG), the ratio of graphitic and sp3-hybridized carbons can be estimated (see Supporting Information).42,50,51 For example, as the oxidation temperature is increased (475 → 575 °C) and progressively greater amounts of graphitic carbons are removed, the π*(C=C) resonance decreases compared to the σ*(C–C) resonance.43−45 Integrating the spectra shows that HPHT NDs are composed of 87% sp3-hybridized carbon that increases to 95% after 2 h of aerobic oxidation at 575 °C. However, this estimate is a lower limit because the NEXAFS measurement is surface-sensitive; the probe depth is estimated at 5–10 nm and may not include all bulk diamond signal.52 This high diamond content is on par with other highly purified nanodiamond samples.19
To obtain a quantitative measure of the relative abundances of the C–O, C=O, and C=C functional groups, we turned to X-ray photoelectron spectroscopy. By tuning the excitation wavelength, we influence the photoelectron kinetic energy and its escape depth. For example, using 410 eV synchrotron radiation, photoelectrons derived from the carbon 1s orbitals escape with 125 eV of kinetic energy and have a mean free path of ∼0.5 nm, enough to escape from the first few lattice planes (2–3 lattice planes along the [111] direction). Photoelectrons generated with 910 eV photons, on the other hand, have increased mean free paths (∼1.0 nm) such that changes in signal intensity as a function of photon energy can be used to distinguish signals from the surface functional groups and the signal from the bulk diamond lattice. Typical spectra after oxidation at 500 °C contain signals from graphitic carbons (282.5 eV), C–O (286.0 eV), and C=O (289.0 eV) functional groups as well as bulk diamond (284.5–285.0 eV) (Figure 4C).53 The signal from graphitic carbon and C–O and C=O functional groups smoothly increase in intensity as the photoexcitation energy is lowered, as is expected from a surface species (Figure 4C). The signal from graphitic carbons is not detectable in samples oxidized at 575 °C, and instead the spectrum is dominated by bulk diamond and oxygenated functional groups (Figure 4D). Spectral deconvolution indicates that carboxyl carbons make up a small fraction of surface functionalities (∼2%), while the majority of the signal derives from functional groups with single C–O bonds. While the precise amounts of each signal will be influenced by the sample roughness,54 the lack of signal from graphitic carbons and carboxyls unambiguously demonstrates that they are not the dominant surface functionality on HPHT NDs after 2 h of oxidation at 575 °C.
After 2 h of aerobic oxidation at 575 °C singly bonded oxygen containing functional groups are the dominant surface species; however, differentiating between carboxylic acids and anhydrides or ethers and alcohols was not possible using the binding energies alone. Diffuse reflectance infrared Fourier transform spectroscopy (DRIFTS), on the other hand, provides a complementary method to assign the types of functional groups and adsorbates present. DRIFTS spectra clearly showed a number of signals that derive from O–H and C–O vibrations, including (1) the stretching vibrations of adsorbed water and hydroxyls (νO–H = 3000–3700 cm–1), (2) the bending mode of water (δO–H = 1630 cm–1), (3) a dominant signal from C–O single bonds in the fingerprint region (νC–O = 1050–1150 cm–1), and (4) a weak signal from a carbonyl (νC–O = 1790 cm–1) (Figure 5). The νO–H stretching band is similar in intensity to previously studied diamond powders and is primarily due to adsorbed water.55 Water was desorbed in situ by heating the sample in an infrared cell under a flowing N2 atmosphere (Figure 5, inset) leaving remaining O–H signal that we assign to surface hydroxyls (νO–H ∼ 3650–3700 cm–1). Beyond 400 °C surface functional groups begin to desorb as CO and CO2 in line with previous reports (see Supporting Information).56 In addition to the intense signals from surface bound hydroxyls, a weak carbonyl vibration at 1790 cm–1 falls within the range expected for acid anhydrides (1750–1800 cm–1),24,41,56 although strained ketones such as cyclobutanone can also appear at this frequency.57 The strong bands in the O–H and fingerprint regions clearly indicate that the dominant surface functionality is a hydroxyl group—a conclusion that is consistent with the XPS and NEXAFS analysis. However, we cannot rule out the presence of ethers, which may also contribute to the band in the fingerprint region as has been proposed by others.58−61
Figure 5.

DRIFTS spectra of HPHT NDs oxidized at 575 °C (top), 475 °C (middle), and prior to oxidation (bottom). Reflectance intensities have been modified by the Kubelka–Munk relation to make them proportional to concentration. Inset shows spectra acquired at different temperatures under flowing nitrogen, where desorption of water from the nanodiamond surface is responsible for the decrease in intensity of the stretching v(O–H) = 3000–3700 cm–1 and bending δ(O–H) = 1630 cm–1 modes. Remaining signal near v(O–H) = 3000–3400 cm–1 is consistent with remaining surface bound hydroxyl functionalities and adsorbed water.
Previous studies of DND attribute vibrational bands in the carbonyl region to carboxylic acids and conclude they are the dominant surface functionality. However, in our case, the relatively weak signal in this region is likely due to carboxylic anhydrides. In addition to the carbonyl vibration at 1790 cm–1, other stretching modes consistent with acid anhydrides are observed at 940, 1290, and 1370 cm–1, the intensity of which correlates with the signal at 1790 cm–1. For example, if HPHT NDs are oxidized with persulfuric acid prior to aerobic oxidation at 575 °C, both sets of signals are nearly eliminated, leaving only vibrational signatures from alcohols (Figure S8). Using the relative extinction of the C–O vibrational transition from tertiary alcohols and the symmetric stretch of carboxylic anhydrides, we estimate that the (C–O):(C=O) ratio is ∼30:1 after 2 h of aerobic oxidation at 575 °C and ∼90:1 after persulfuric acid treatment and aerobic oxidation.62 These estimates are consistent with the low carbonyl content measured by XPS above (Figure 4). The low abundance of acid anhydrides maybe due to the high oxidation temperature used in our study, which is known to cause decarboxylation from diamond surfaces in the range of 400–700 °C.56 Indeed, the signals from carbonyls decrease in the carbon and oxygen NEXAFS, XPS, and DRIFTS spectra when the temperature of oxidation is increased from 475 to 575 °C (Figures 4 and 5 and Figure S6). However, carboxyls are minor functional groups on unoxidized HPHT NDs as well as those oxidized at lower temperatures, while DND maintains a higher carboxylate coverage under similar oxidation conditions.
The distinct surface termination of DND and HPHT NDs may stem from different underlying crystallinity or crystallite size. While the Raman and NEXAFS spectra of HPHT NDs display a sharp diamond vibration and a core–hole exciton, the same spectra of DND are broad and red-shifted and lack the signal from a core–hole exciton. Both observations imply that DND has a more defected structure. These observations may explain why DNDs generally do not support NVCs, while oxidized HPHT NDs, including those prepared in this study, support NVCs in the NV– state that can be manipulated with optical electron spin resonance methods (see Supporting Information). HPHT NDs used in this study are also larger (13–16 nm) than typical DNDs (∼5 nm) and have larger area facets and fewer edge and vertex atoms that may influence the functional group types.
Together the NEXAFS, XPS, and DRIFTS measurements support a consistent picture; aerobically oxidized HPHT NDs are primarily terminated with hydroxyls, rather than carboxylic anhydrides which are present in <5% abundance; olefinic functionalities are the smallest component despite the intensity of their vibrational bands in the visible-Raman spectrum. The abundance of alcohols is consistent with studies of (111)-terminated single crystals oxidized in the presence of H2O where hydroxyl termination has been observed experimentally and predicted by computational models.25,27 The surfaces of HPHT NDs are similar to bulk diamond surfaces, and efforts to functionalize HPHT NDs and other diamond nanostructures fabricated from bulk material using “top-down” approaches must address the hydroxyl termination to append a high coverage of surface ligands. Among possible methods silanization of ND surfaces has been reported and may be facilitated by the hydroxylated surface.63,64
Conclusions
The highly crystalline structure of HPHT NDs is apparent from the energy and line width of the Raman spectrum, high resolution TEM images, and the signature of a core–hole exciton in carbon NEXAFS spectra. Moreover, we show that their surfaces are terminated with oxygenated functional groups analogous to those found on single crystal [111], [100], and [110] facets. Both observations indicate that after 2 h of aerobic oxidation at 575 °C the surface structure of HPHT NDs is very similar to bulk single crystals where hydroxyl and possibly ethers are the dominant functional groups. Graphitic carbons are present in very low quantities compared to the oxygenated functional groups (<2%), leaving a sample whose Raman spectrum could be measured using visible wavelength excitation. Each of these observations support a structure that is distinct from DND and indicate that new functionalization strategies are needed that target the singly bonded C–O–H functional groups. Advances along these lines will aid in the transformation of HPHT NDs and CVD derived nanostructures into versatile biological labeling agents and particularly those that utilize NVCs for magnetic and electric field sensing.
Experimental Section
Materials and Methods
HPHT ND powders (monocrystalline diamond powder MSY 0–0.05 μm, Microdiamant AG) and detonation nanodiamond powders (cluster diamond XP 0.25–1 μm, Microdiamant AG), bulk HPHT diamond crystals (Van Moppes, FRD-A 40/50 and SK-90 20/25), and deuterium oxide (Cambridge Isotope Laboratories (99.9% CAS 7889-20-0)) were used as received. Highly ordered pyrolitic graphite (Ted Pella Inc. #626-2) was freshly cleaved with Scotch tape prior to analysis. Single crystal type IIa CVD diamond terminated at a (100) facet (Element Six, Frankfurt, Germany) was submerged in persulfuric acid solution (3:1 sulfuric acid and hydrogen peroxide) for 10 min, rinsed with 18 MΩ water, dried under stream of nitrogen, and stored in a closed container in air prior to analysis. Silicon wafers with a native SiO2 oxide layer (P-type; 1 Ω·cm, SQI, San Jose, CA) were washed with persulfuric acid solution prior to use.
Oxidation of Diamond Nanocrystals
Nanodiamond powder was placed in a ceramic boat, loaded into a tube furnace, left open to the air, and heated to the desired temperature (475–575 °C) for 2 h. After cooling to room temperature, oxidized HPHT NDs could be dispersed in water, methanol, or ethanol (0.1–1.0 mg/mL) with sonication for 5 min at 10% power using a tip sonicator (Branson Sonifier 450). In some cases, nanodiamond powders were first oxidized in persulfuric acid (100 mg of HPHT NDs per 60 mL of 3:1, H2SO4:H2O2) by heating the suspension to 80 °C for 12 h in a round-bottom flask equipped with a reflux condensror. Vigorous bubbling was observed for 30 min and then gradually subsided. ND solids were separated via centrifugation and rinsed with 18 MΩ water three times prior to aerobic oxidation as described above.
HRTEM Characterization and in Situ Oxidation of HPHT Nanodiamonds
Colloidal dispersions of nanodiamonds in water or methanol were drop-cast onto ultrathin holey carbon grids (Ted Pella #08124). Standard HRTEM was performed on a JEOL JEM2100F at the Center for Functional Nanomaterials at Brookhaven National Laboratory. The accelerating voltage was 200 keV, and the sample was at 0° tilt during imaging. In situ oxidation of HPHT NDs was performed on an environmental HRTEM microscope (FEI Titan 80-300) at an accelerating voltage of 80 keV with aberration correction. Oxygen was introduced into the imaging chamber at a pressure of 1 × 10⁻⁶ Torr and then sealed. Images were collected at a rate of 4 frames/s with continuous manual focusing.
UV- and Visible-Raman Spectroscopy of Oxidized Diamond Nanocrystals and Control Samples
Samples were prepared by placing 3 mg of HPHT ND powder between two glass slides and lightly pressing the slides together to flatten the sample for normal spectral aquisition. Visible-Raman scattering spectroscopy was performed on a Renishaw inVia microscope with a diode laser at 633 nm and a 1800/mm grating and a spectral range of 900–2100 cm–1. UV-Raman at 325 nm and visible-Raman scattering at 633 nm were performed on a Horiba Jobin Yvon LabRam Aramis microscope with UV and visible objectives of 20×. Spectra were collected by averaging 20–40 spectra from 5 s exposures at 1–20 μW/cm2 with using a 20× Olympus objective. Sample location and focus were manually controlled, and Raman scattering calibration was performed on an internal Si wafer. Raman spectra background were subtracted and then normalized to the diamond peak intensity.
Deuterium Exchange and Vacuum Annealing of HPHT NDs
ND powders (50 mg) were placed into a 25 mL three-neck flask and dried under vacuum (5 mTorr) at room temperature. 10 mL of D2O was then injected into the three-neck flask under Ar, and the mixture was sonicated for 3 min, stirred for an additional 10 min, and then dried under vacuum. This procedure was repeated three times, and the dry powder was brought into an inert atmosphere glovebox where it was immediately sealed under nitrogen in a Linkham THMS600 stage. The stage was continuously purged with N2 during the acquisition of Raman spectra.
NEXAFS and Wavelength-Dependent XPS
Samples were prepared on gold-coated Si wafers with a native oxide layer (#720–204; P-type; 1 Ω·cm) by drop-casting an aqueous dispersion of nanodiamonds (1 mg/mL) and then drying the sample at 80 °C under flowing argon. Samples were covered by a glass dish and stored in clean Teflon containers prior to spectroscopic investigations. Samples were fixed on a machined Al sample bar with Cu tape. NEXAFS and XPS measurements were performed at beamline 10-1 at the Stanford Synchrotron Radiation Lightsource, SLAC National Accelerator Laboratory, and at beamline U7A at the National Synchrotron Light Source using spot sizes of <1 mm2 and ∼1.5 mm2, respectively. At 10-1, carbon K-edge XAS was measured in total electron yield (TEY) mode using 30 × 50 um slits. TEY mode probes approximately 5–10 nm of sample depth. All experiments were conducted under ultrahigh-vacuum conditions (∼5 × 10⁻⁹ Torr). After focusing the optics, the reference absorption intensity of the incoming X-ray beam was measured using a sample of gold coated mesh and used to correct for beam instability. Carbon K-edge NEXAFS spectra were collected at U7A in partial electron yield (PEY) mode using a grid bias of −200 V. Oxygen K-edge was also performed in partial electron yield mode with a grid bias of −300 V. NEXAFS data were collected at an incident electric field vector of 54.7°. Spectra were treated with a linear pre-edge background subtraction from a region before the absorption edge of carbon and oxygen at 260–280 and 510–530 eV, respectively. A post-edge normalization was also performed in the continuum region at 340 eV for carbon and 580 eV for oxygen. XPS spectra were measured at beamline 10-1 with a hemispherical electron spectrometer (SES-R3000, VG-Scienta) using a total energy resolution better than 100 meV. Incident X-rays were selected at 410, 520, 650, and 950 eV with a spherical grating monochromator. Energy calibration was performed using the signal from the gold substrate (Au 4f5/2 = 85.0 eV) after argon ion sputtering under ultrahigh-vacuum conditions (5 × 10⁻⁸ Torr) within a commercial 5700 PHI electronics X-ray photoelectron spectrometer using identical samples. Samples were prepared on substrates freshly cleaned in persulfuric acid solution and deposited from 18 MΩ water to minimize contamination from adventitious hydrocarbons. Details of escape depth estimations and peak fitting are described in the Supporting Information.
Temperature-Dependent DRIFTS
Nanodiamond powder (10 mg) and anhydrous KBr (500 mg) were ground in a mortar and pestle and loaded in the reflectance cup and leveled with a spatula. DRIFTS was performed on a Thermo-Nicolet 7800 FTIR equipped with a liquid nitrogen cooled MCT detector, a KBr beamsplitter, and a Praying Mantis diffuse reflectance apparatus that can be heated under vacuum or flowing gas. Variable temperature spectra (25–700 °C) were acquired after allowing the temperature to equilibrate for 20 min. Spectra of a KBr blank were acquired at each temperature and used to correct the data. A linear background correction was applied, and the data transformed to be linear with respect to concentration of the analyte according to Kubelka and Munk (see Supporting Information for more detail).
Thermogravimetric Mass Spectroscopy (TGA-MS)
Temperature-programmed desorption (TPD) studies were performed on a TG 209 F1 IRIS from Netzsch with an Ar carrier gas from 25 to 1000 °C at ambient pressure. TPD was carried out at a ramp rate of 10 °C/min and tracked by a thermocouple attached to the aluminum carrier. 10 mg of highly purified HPHT ND powder (575 °C for 2 h) was loaded into an alumina sample carrier and introduced into the TGA-MS. Mass spectroscopy of the ionized products was tracked at mass–charge values of 1 (H), 2 (H2), 12 (C), 18 (H2O), 28 (CO), 32 (O2), and 44 (CO2). These measurements were carried out at the analytical and diagnostics laboratory at SUNY Binghamton.
Acknowledgments
This research was supported by the W.M. Keck Foundation, Medical Sciences Research Program, and the Department of Defense, Multidisciplinary Research Initiative under Contract W911NF-12-1-0594. NEXAFS and wavelength-dependent XPS (TS) were supported by the EFRC Center for Re-Defining Photovoltaic Efficiency through Molecule Scale Control under Contract DE-SC0001085 and performed at beamline 10-1 at the Stanford Synchrotron Radiation Lightsource, SLAC National Accelerator Laboratory, a national user facility operated by Stanford University on behalf of the U.S. Department of Energy, Office of Basic Energy Sciences, and at beamline U7A at the National Synchrotron Light Source, Brookhaven National Laboratory, which is supported by the U.S. Department of Energy, Office of Basic Energy Sciences, under Contract DE-AC02-98CH10886. Research carried out (in whole or in part) at the Center for Functional Nanomaterials, Brookhaven National Laboratory, which is supported by the U.S. Department of Energy, Office of Basic Energy Sciences, under Contract DE-AC02-98CH10886. Nitrogen vacancy center photophysical measurements performed by M.T. were supported by the Defense Threat Reduction Agency, Basic Research Award #HDTRA1-11-1-0022 to Columbia University. E.H.C. was supported by the NASA Office of the Chief Technologist’s Space Technology Research Fellowship. Diamond Nanotechnologies Inc. acknowledges support through DARPA Awards #HR0011-14-C-0018 and #D14PC00121 and through the NIH Award #1R43MH102942-01.
Supporting Information Available
Analysis of NEXAFS, DRIFTS, and wavelength-dependent XPS; experimental setup and single-emitter spectroscopy of nitrogen vacancy centers in aerobically oxidized nanodiamond; additional Raman spectra, DRIFTS spectra, XRD, TGA-MS, TEM, and in situ oxidation movie taken with TEM. This material is available free of charge via the Internet at http://pubs.acs.org.
The authors declare no competing financial interest.
Funding Statement
National Institutes of Health, United States
Supplementary Material
References
- Neumann P.; Kolesov R.; Naydenov B.; Beck J.; Rempp F.; Steiner M.; Jacques V.; Balasubramanian G.; Markham M. L.; Twitchen; et al. Quantum Register Based on Coupled Electron Spins in a Room-Temperature Solid. Nat. Phys. 2010, 6, 249–253. [Google Scholar]
- Balasubramanian G.; Chan I. Y.; Kolesov R.; Al-Hmoud M.; Tisler J.; Shin C.; Kim C.; Wojcik A.; Hemmer P. R.; Krueger A.; Hanke T.; et al. Nanoscale Imaging Magnetometry with Diamond Spins under Ambient Conditions. Nature 2008, 455, 648–U646. [DOI] [PubMed] [Google Scholar]
- Balasubramanian G.; Neumann P.; Twitchen D.; Markham M.; Kolesov R.; Mizuochi N.; Isoya J.; Achard J.; Beck J.; Tissler J.; et al. Ultralong Spin Coherence Time in Isotopically Engineered Diamond. Nat. Mater. 2009, 8, 383–387. [DOI] [PubMed] [Google Scholar]
- Maze J. R.; Stanwix P. L.; Hodges J. S.; Hong S.; Taylor J. M.; Cappellaro P.; Jiang L.; Dutt M. V. G.; Togan E.; Zibrov N.; et al. Nanoscale Magnetic Sensing with an Individual Electronic Spin in Diamond. Nature 2008, 455, 644–U641. [DOI] [PubMed] [Google Scholar]
- Taylor J. M.; Cappellaro P.; Childress L.; Jiang L.; Budker D.; Hemmer P. R.; Yacoby A.; Walsworth R.; Lukin M. D. High-Sensitivity Diamond Magnetometer with Nanoscale Resolution. Nat. Phys. 2008, 4, 810–816. [Google Scholar]
- Dolde F.; Fedder H.; Doherty M. W.; Nobauer T.; Rempp F.; Balasubramanian G.; Wolf T.; Reinhard F.; Hollenberg L. C. L.; Jelezko F.; et al. Electric-Field Sensing Using Single Diamond Spins. Nat. Phys. 2011, 7, 459–463. [Google Scholar]
- Chang Y. R.; Lee H. Y.; Chen K.; Chang C. C.; Tsai D. S.; Fu C. C.; Lim T. S.; Tzeng Y. K.; Fang C. Y.; Han C. C.; et al. Mass Production and Dynamic Imaging of Fluorescent Nanodiamonds. Nat. Nanotechnol. 2008, 3, 284–288. [DOI] [PubMed] [Google Scholar]
- Grinolds M. S.; Hong S.; Maletinsky P.; Luan L.; Lukin M. D.; Walsworth R. L.; Yacoby A. Nanoscale Magnetic Imaging of a Single Electron Spin under Ambient Conditions. Nat. Phys. 2013, 9, 215–219. [Google Scholar]
- Hall L. T.; Beart G. C. G.; Thomas E. A.; Simpson D. A.; McGuinness L. P.; Cole J. H.; Manton J. H.; Scholten R. E.; Jelezko F.; Wrachtrup J.; et al. High Spatial and Temporal Resolution Wide-Field Imaging of Neuron Activity Using Quantum NV-Diamond. Sci. Rep. 2012, 2, 1–9. [DOI] [PMC free article] [PubMed] [Google Scholar]
- Maletinsky P.; Hong S.; Grinolds M. S.; Hausmann B.; Lukin M. D.; Walsworth R. L.; Loncar M.; Yacoby A. A Robust Scanning Diamond Sensor for Nanoscale Imaging with Single Nitrogen-Vacancy Centres. Nat. Nanotechnol. 2012, 7, 320–324. [DOI] [PubMed] [Google Scholar]
- Staudacher T.; Shi F.; Pezzagna S.; Meijer J.; Du J.; Meriles C. A.; Reinhard F.; Wrachtrup J. Nuclear Magnetic Resonance Spectroscopy on a (5-nanometer)3 Sample Volume. Science 2013, 339, 561–563. [DOI] [PubMed] [Google Scholar]
- Mamin H. J.; Kim M.; Sherwood M. H.; Rettner C. T.; Ohno K.; Awschalom D. D.; Rugar D. Nanoscale Nuclear Magnetic Resonance with a Nitrogen-Vacancy Spin Sensor. Science 2013, 339, 557–560. [DOI] [PubMed] [Google Scholar]
- Chen E. H.; Gaathon O.; Trusheim M. E.; Englund D. Wide-Field Multispectral Super-Resolution Imaging Using Spin-Dependent Fluorescence in Nanodiamonds. Nano Lett. 2013, 13, 2073–2077. [DOI] [PubMed] [Google Scholar]
- McGuinness L. P.; Yan Y.; Stacey A.; Simpson D. A.; Hall L. T.; Maclaurin D.; Prawer S.; Mulvaney P.; Wrachtrup J.; Caruso F.; Scholten R. E.; Hollenberg L. C. L. Quantum Measurement and Orientation Tracking of Fluorescent Nanodiamonds Inside Living Cells. Nat. Nanotechnol. 2011, 6, 358–363. [DOI] [PubMed] [Google Scholar]
- Igarashi R.; Yoshinari Y.; Yokota H.; Sugi T.; Sugihara F.; Ikeda K.; Sumiya H.; Tsuji S.; Mori I.; Tochio H.; Harada Y.; Shirakawa M. Real-Time Background-Free Selective Imaging of Fluorescent Nanodiamonds in Vivo. Nano Lett. 2012, 12, 5726–5732. [DOI] [PubMed] [Google Scholar]
- Baranov P. G.; Soltamova A. A.; Tolmachev D. O.; Romanov N. G.; Babunts R. A.; Shakhov F. M.; Kidalov S. V.; Vul A. Y.; Mamin G. V.; et al. Enormously High Concentrations of Fluorescent Nitrogen-Vacancy Centers Fabricated by Sintering of Detonation Nanodiamonds. Small 2011, 7, 1533–1537. [DOI] [PubMed] [Google Scholar]
- Tisler J.; Balasubramanian G.; Naydenov B.; Kolesov R.; Grotz B.; Reuter R.; Boudou J.-P.; Curmi P. A.; Sennour M.; Thorel A.; et al. Fluorescence and Spin Properties of Defects in Single Digit Nanodiamonds. ACS Nano 2009, 3, 1959–1965. [DOI] [PubMed] [Google Scholar]
- Trusheim M. E.; Li L.; Laraoui A.; Chen E. H.; Gaathon O.; Bakhru H.; Meriles C. A.; Englund D. R.Scalable Fabrication of High Purity Diamond Nanocrystals with Long-Spin-Coherence Nitrogen Vacancy Centers. Nano Lett. 2013, 14, 1959–1965. [DOI] [PubMed] [Google Scholar]
- Osswald S.; Yushin G.; Mochalin V.; Kucheyev S. O.; Gogotsi Y. Control of sp2/sp3 Carbon Ratio and Surface Chemistry of Nanodiamond Powders by Selective Oxidation in Air. J. Am. Chem. Soc. 2006, 128, 11635–11642. [DOI] [PubMed] [Google Scholar]
- Mochalin V. N.; Shenderova O.; Ho D.; Gogotsi Y. The Properties and Applications of Nanodiamonds. Nat. Nanotechnol. 2012, 7, 11–23. [DOI] [PubMed] [Google Scholar]
- Krueger A.; Lang D. Functionality is Key: Recent Progress in the Surface Modification of Nanodiamond. Adv. Funct. Mater. 2012, 22, 890–906. [Google Scholar]
- Mochalin V. N.; Gogotsi Y. Wet Chemistry Route to Hydrophobic Blue Fluorescent Nanodiamond. J. Am. Chem. Soc. 2009, 131, 4594–4595. [DOI] [PubMed] [Google Scholar]
- Zhang Q. W.; Mochalin V. N.; Neitzel I.; Knoke I. Y.; Han J. J.; Klug C. A.; Zhou J. G.; Lelkes P. I.; Gogotsi Y. Fluorescent PLLA-Nanodiamond Composites for Bone Tissue Engineering. Biomaterials 2011, 32, 87–94. [DOI] [PubMed] [Google Scholar]
- Krueger A.; Stegk J.; Liang Y.; Lu L.; Jarre G. Biotinylated Nanodiamond: Simple and Efficient Functionalization of Detonation Diamond. Langmuir 2008, 24, 4200–4204. [DOI] [PubMed] [Google Scholar]
- Loh K. P.; Xie X. N.; Yang S. W.; Zheng J. C. Oxygen Adsorption on (111)-Oriented Diamond: A Study with Ultraviolet Photoelectron Spectroscopy, Temperature-Programmed Desorption, and Periodic Density Functional Theory. J. Phys. Chem. B 2002, 106, 5230–5240. [Google Scholar]
- Gaebel T.; Bradac C.; Chen J.; Say J. M.; Brown L.; Hemmer P.; Rabeau J. R. Size-Reduction of Nanodiamonds via Air Oxidation. Diamond Relat. Mater. 2012, 21, 28–32. [Google Scholar]
- de Theije F. K.; van Veenendaal E.; van Enckevort W. J. P.; Vlieg E. Oxidative Etching of Cleaved Synthetic Diamond {111} Surfaces. Surf. Sci. 2001, 492, 91–105. [Google Scholar]
- Aizawa T.; Ando T.; Kamo M.; Sato Y. High-Resolution Electron-Energy-Loss Spectroscopic Study of Epitaxially Grown Diamond (111) and (100) Surfaces. Phys. Rev. B 1993, 48, 18348–18351. [DOI] [PubMed] [Google Scholar]
- Boudou J. P.; Curmi P. A.; Jelezko F.; Wrachtrup J.; Aubert P.; Sennour M.; Balasubramanian G.; Reuter R.; Thorel A.; Gaffet E. High Yield Fabrication of Fluorescent Nanodiamonds. Nanotechnology 2009, 20, 1–11. [DOI] [PMC free article] [PubMed] [Google Scholar]
- Telling R. H.; Pickard C. J.; Payne M. C.; Field J. E. Theoretical Strength and Cleavage of Diamond. Phys. Rev. Lett. 2000, 84, 5160–5163. [DOI] [PubMed] [Google Scholar]
- Ownby P. D.; Yang X.; Liu J. Calculated X-Ray-Diffraction Data for Diamond Polytypes. J. Am. Ceram. Soc. 1992, 75, 1876–1883. [Google Scholar]
- Osswald S.; Mochalin V. N.; Havel M.; Yushin G.; Gogotsi Y. Phonon Confinement Effects in the Raman Spectrum of Nanodiamond. Phys. Rev. B 2009, 80, 075419–075428. [Google Scholar]
- Malard L. M.; Pimenta M. A.; Dresselhaus G.; Dresselhaus M. S. Raman Spectroscopy in Graphene. Phys. Rep.: Rev. Sect. Phys. Lett. 2009, 473, 51–87. [Google Scholar]
- Ferrari A. C.; Meyer J. C.; Scardaci V.; Casiraghi C.; Lazzeri M.; Mauri F.; Piscanec S.; Jiang D.; Novoselov K. S.; Roth S.; Geim A. K. Raman Spectrum of Graphene and Graphene Layers. Phys. Rev. Lett. 2006, 97, 187401–18740–4. [DOI] [PubMed] [Google Scholar]
- Frauenheim T.; Stephan U.; Blaudeck P.; Porezag D.; Busmann H. G.; Zimmermannedling W.; Lauer S. Stability, Reconstruction, and Electronic-Properties of Diamond (100) and (111) Surfaces. Phys. Rev. B 1993, 48, 18189–18202. [DOI] [PubMed] [Google Scholar]
- Sowa E. C.; Kubiak G. D.; Stulen R. H.; Vanhove M. A. Structural-Analysis of the Diamond C(111)-(2 × 1) Reconstructed Surface by Low-Energy Electron-Diffraction. J. Vac. Sci. Technol., A 1998, 6, 832–833. [Google Scholar]
- Pandey K. C. New Dimerized-Chain Model for the Reconstruction of the Diamond (111)-(2 × 1) Surface. Phys. Rev. B 1982, 25, 4338–4341. [Google Scholar]
- Alfonso D. R.; Drabold D. A.; Ulloa S. E. Structural, Electronic, and Vibrational Properties of Diamond (100), Diamond (111), and Diamond (110) Surfaces from Ab-Initio Calculations. Phys. Rev. B 1995, 51, 14669–14685. [DOI] [PubMed] [Google Scholar]
- Ferrari A. C.; Robertson J. Raman Spectroscopy of Amorphous, Nanostructured, Diamond-Like Carbon, and Nanodiamond. Philos. Trans. R. Soc., A 2004, 362, 2477–2512. [DOI] [PubMed] [Google Scholar]
- Ferrari A. C.; Robertson J. Interpretation of Raman Spectra of Disordered and Amorphous Carbon. Phys. Rev. B 2000, 61, 14095–14107. [Google Scholar]
- Mochalin V.; Osswald S.; Gogotsi Y. Contribution of Functional Groups to the Raman Spectrum of Nanodiamond Powders. Chem. Mater. 2009, 21, 273–279. [Google Scholar]
- Stohr J.NEXAFS Spectroscopy; Springer-Verlag: Berlin, 1992. [Google Scholar]
- Outka D. A.; Stohr J.; Madix R. J.; Rotermund H. H.; Hermsmeier B.; Solomon J. NEXAFS Studies of Complex Alcohols and Carboxylic-Acids on the Si(111)(7 × 7) Surface. Surf. Sci. 1987, 185, 53–74. [Google Scholar]
- Ishii I.; Hitchcook A. P. The Oscillator Strengths for C1s and O1s Excitation of Some Saturated and Unsaturated Organic Alcohols, Acids and Esters. J. Electron Spectrosc. Relat. Phenom. 1998, 46, 55–84. [Google Scholar]
- Hitchcock A. P.; Brion C. E. Inner-shell Excitation of Formaldehyde, Acetaldehyde and Acetone Studied by Electron-Impact. J. Electron Spectrosc. Relat. Phenom. 1980, 19, 231–250. [Google Scholar]
- Morar J. F.; Himpsel F. J.; Hollinger G.; Hughes G.; Jordan J. L. C 1s Excitation Studies of Diamond (111). 2. Unoccupied Surface-States. Phys. Rev. B 1986, 33, 1346–1349. [DOI] [PubMed] [Google Scholar]
- Morar J. F.; Himpsel F. J.; Hollinger G.; Hughes G.; Jordan J. L. Observation of a C-1s Core Exciton in Diamond. Phys. Rev. Lett. 1985, 54, 1960–1963. [DOI] [PubMed] [Google Scholar]
- Gruen D. M.; Krauss A. R.; Zuiker C. D.; Csencsits R.; Terminello L. J.; Carlisle J. A.; Jimenez I.; Sutherland D. G. J.; Shuh D. K.; Tong W.; et al. Characterization of Nanocrystalline Diamond Films by Core-Level Photoabsorption. Appl. Phys. Lett. 1996, 68, 1640–1642. [Google Scholar]
- Raty J. Y.; Galli G.; Bostedt C.; van Buuren T. W.; Terminello L. J. Quantum Confinement and Fullerenelike Surface Reconstructions in Nanodiamonds. Phys. Rev. Lett. 2003, 90, 037401–037404. [DOI] [PubMed] [Google Scholar]
- Kulik J.; Lempert G. D.; Grossman E.; Marton D.; Rabalais J. W.; Lifshitz Y. sp3 Content of Mass-Selected Ion-Beam-Deposited Carbon Films Determined by Inelastic and Elastic Electron Scattering. Phys. Rev. B 1995, 52, 15812–15822. [DOI] [PubMed] [Google Scholar]
- Gago R.; Jimenez I.; Albella J. M.; Climent-Font A.; Caceres D.; Vergara I.; Banks J. C.; Doyle B. L.; Terminello L. J. Bonding and Hardness in Nonhydrogenated Carbon Films with Moderate sp3 Content. J. Appl. Phys. 2000, 87, 8174–8180. [Google Scholar]
- Zharnikov M.; Frey S.; Heister K.; Grunze M. An Extension of the Mean Free Path Approach to X-ray Absorption Spectroscopy. J. Electron Spectrosc. Relat. Phenom. 2002, 124, 15–24. [Google Scholar]
- Makau N. W.; Derry T. E. Study of Oxygen on the Three Low Index Diamond Surfaces by XPS. Surf. Rev. Lett. 2003, 10, 295–301. [Google Scholar]
- Artemenko A.; Choukourov A.; Slavinska D.; Biederman H. Influence of Surface Roughness on Results of XPS Measurements. WDS Proc. Contr. Pap. 2009, 3, 175–181. [Google Scholar]
- Ando T.; Ishii M.; Kamo M.; Sato Y. Diffuse-Reflectance Fourier-Transform Infrared Study of the Plasma-Fluorination of Diamond Surfaces Using a Microwave-Discharge in CF4. J. Chem. Soc., Faraday Trans. 1993, 89, 3105–3109. [Google Scholar]
- Ando T.; Ishii M.; Kamo M.; Sato Y. Thermal Hydrogenation of Diamond Surfaces Studied by Diffuse Reflectance Fourier-Transform Infrared, Temperature-Programmed Desorption and Laser Raman-Spectroscopy. J. Chem. Soc., Faraday Trans. 1993, 89, 1783–1789. [Google Scholar]
- John P.; Polwart N.; Troupe C. E.; Wilson J. I. B. The Oxidation of Diamond: The Geometry and Stretching Frequency of Carbonyl on the (100) Surface. J. Am. Chem. Soc. 2003, 125, 6600–6601. [DOI] [PubMed] [Google Scholar]
- Struck L. M.; Develyn M. P. Interaction of Hydrogen and Water with Diamond-Infrared Spectroscopy (100). J. Vac. Sci. Technol., A 1993, 11, 1992–1997. [Google Scholar]
- Tamura H.; Zhou H.; Hirano Y.; Takami S.; Kubo M.; Belosludov R. V.; Miyamoto A.; Imamura A.; Gamo M. N.; Ando T. First-Principle Study on Reactions of Diamond (100) Surfaces with Hydrogen and Methyl Radicals. Phys. Rev. B 2000, 62, 16995–17003. [Google Scholar]
- Pehrsson P. E.; Mercer T. W. Oxidation of the Hydrogenated Diamond (100) Surface. Surf. Sci. 2000, 460, 49–66. [Google Scholar]
- Pehrsson P. E.; Mercer T. W.; Chaney J. A. Thermal Oxidation of the Hydrogenated Diamond (100) Surface. Surf. Sci. 2002, 497, 13–28. [Google Scholar]
- Chu P. M.; Guenther F. R.; Rhoderick G. C.; Lafferty W. J. The NIST Quantitative Infrared Database. J. Res. Natl. Inst. Stand. Technol. 1999, 104, 59–81. [Google Scholar]
- Rehor I.; Slegerova J.; Kucka J.; Proks V.; Petrakova V.; Adam M.-P.; Treussart F.; Turner S.; Bals S.; Sacha P.; et al. Fluorescent Nanodiamonds Embedded in Biocompatible Translucent Shells. Small 2014, 10, 1106–1115. [DOI] [PMC free article] [PubMed] [Google Scholar]
- Bumb A.; Sarkar S. K.; Billington N.; Brechbiel M. W.; Neuman K. C. Silica Encapsulation of Fluorescent Nanodiamonds for Colloidal Stability and Facile Surface Functionalization. J. Am. Chem. Soc. 2013, 135, 7815–7818. [DOI] [PMC free article] [PubMed] [Google Scholar]
Associated Data
This section collects any data citations, data availability statements, or supplementary materials included in this article.