Abstract
In this work, we investigated how bulk motion degraded the quality of optical coherence tomography (OCT) angiography that was obtained through calculating interframe signal variation, i.e., interframe signal variation based optical coherence angiography (isvOCA). We demonstrated theoretically and experimentally that the spatial average of isvOCA signal had an explicit functional dependency on bulk motion. Our result suggested that the bulk motion could lead to an increased background in angiography image. Based on our motion analysis, we proposed to reduce image artifact induced by transient bulk motion in isvOCA through adaptive thresholding. The motion artifact reduced angiography was demonstrated in a 1.3μm spectral domain OCT system. We implemented signal processing using graphic processing unit for real-time imaging and conducted in vivo microvasculature imaging on human skin. Our results clearly showed that the adaptive thresholding method was highly effective in the motion artifact removal for OCT angiography.
OCIS codes: (110.4500) Optical coherence tomography, (170.2655) Functional monitoring and imaging, (100.2000) Digital image processing
1. Introduction
Various OCT techniques have been developed for blood vessel imaging, such as optical Doppler tomography (ODT), optical angiography (OMAG), speckle variance OCT (svOCT) and etc [1–23]. All these techniques detect blood flow by comparing OCT signals (phase or amplitude) acquired at different time points (between Ascans or between Bscans) to sense particles in motion (flowing blood cells). OCT based blood vessel imaging does not require exogenous contrast agent, which makes it favorable for in vivo imaging. In particular, OCT angiography can be used to image subcutaneous microvasculature in situ and non-invasively; and is considered to have great potential for the diagnosis of skin diseases [13]. Blood flows within the dermis of skin are usually very slow (in the range of 0.1-0.9μm/s) [14], therefore have to be imaged by high sensitivity angiography that compares OCT signal acquired with larger time interval. For example, subcutaneous microvasculature image can be obtained by calculating interframe instead of inter-Ascan variation of OCT signal.
One of the major challenges for high sensitivity in vivo microvasculature imaging is bulk motion (BM) that comes from sample. BM inevitably exists during the imaging of living animal or human and can significantly degrade image quantity of OCT angiography. This is because motion signal due to BM contributes to every pixel in an angiography image, while motion signal caused by blood flow contributes to a limited number of pixels corresponding to vessels. In this study, we investigate high sensitivity, interframe signal variation based OCT angiography (isvOCA) for subcutaneous microvasculature imaging. isvOCA signal is obtained by calculating pixelwise interframe signal variation between Bscans. According to our theoretical derivation, isvOCA signal has an explicit functional dependency on the magnitude of motion in x, y and z directions. For the visualization of microvasculature, signal of isvOCA is predominantly derived from individual particle’s random motion rather than ensemble directional motion that is quantified by blood flow. isvOCA is particularly vulnerable to BM, because the time interval between the acquisition of subsequent Bscans is long enough for BM to induce detectable changes in OCT signal. Therefore, it is essential to reduce motion artifact to obtain high sensitivity isvOCA.
To remove motion artifact in Doppler OCT angiography, it was usually assumed that the sample movement induced a constant phase term for each Ascan and motion artifact could be removed by subtracting this phase term [15–19]. However, this phase correction method for Doppler OCT cannot be directly applied to isvOCA, because of different contrast mechanisms for blood vessel imaging in these two techniques. isvOCA is sensitive to motion in three dimensions while Doppler OCT signal is only sensitive to motion in the axial direction. The artifact due to BM in speckle variance OCT could be corrected through image registration [23]. Similar to phase correction in Doppler OCT, this method tracked bulk motion by analyzing OCT signal and could only be valid when motion was constrained to one or two dimensions. However, BM is generally a 3D vector with x, y and z components to be determined by three independent variables at any time instant. The quantitative tracking of BM with high accuracy is extremely challenging due to its 3D nature. Nevertheless, when motion gradient over time is small within the interval between Bscans, BM induces the same displacement for every scatterer within the sample. Therefore, BM results in the same change in OCT signal for a collection of pixels. As a result, it is possible to estimate and remove image artifact caused by BM via appreciating its global nature.
For isvOCA, BM results in motion artifact because the non-blood pixel has non-zero signal. On the other hand, angiography signal corresponding to blood flow does not change significantly with BM. It was demonstrated that the high sensitivity of OCT angiography based on interframe signal variation was due to the random motion of scatterers rather than directional flow [7]. Therefore, if the background level associated with BM can be estimated and subtracted, BM induced image artifact should be removed from OCT angiography.
In this study, we analyzed isvOCA signal and conducted systematic motion analysis for isvOCA. We further proposed to quantify the BM induced motion artifact through 2D spatial averaging on isvOCA signal. As the magnitude of BM inevitably varies as time, an adaptive threshold corresponding to instantaneous magnitude of BM was applied to reduce motion artifact. To the best of our knowledge, systematic motion analysis and motion artifact removal through adaptive thresholding have not been investigated before for intensity variation based OCT angiography.
To perform motion analysis, we considered OCT signal at each pixel as a random variable and demonstrated theoretically and experimentally that the expected value of isvOCA signal had an explicit functional dependency on motion. Our results indicated that isvOCA signal at non-vessel pixels had the same expected value <vBM> due to global BM. Assuming most pixels in an OCT image do not correspond to blood vessels, <vBM> could be simply assessed through spatial averaging of the entire 2D isvOCA image. Using <vBM> as an adaptive threshold value, motion artifact reduction could be achieved by thresholding the original cross-sectional isvOCA images. We demonstrated the principle of the proposed motion artifact removal method and evaluated its effectiveness on phantoms. We implemented the algorithm for angiography reconstruction with the proposed motion artifact reduction in real-time using graphic processing unit (GPU) [8, 23, 24] and conducted in vivo imaging of subcutaneous blood vessel network on human subject. It is worth mentioning that the isvOCA is used to provide high sensitivity microscopic visualization of blood vessel network. The quantification of blood flow is beyond the scope of this work.
2. Principle
In the following analysis, a Cartesian coordinate system (x,y,z) is used (x: Bscan direction; y: Cscan direction; z: Ascan direction). I(x,y,z,t) indicates OCT signal obtained at spatial location (x,y,z) and time t. I(x,y,z,t) can be considered as a random variable with expected value I0. v(x,y,z,t), the temporal variation of signal, is calculated to generate motion image for OCT angiography (isvOCA), as shown in Eq. (1). It is essential to normalize the right hand side of Eq. (1) using I02. Otherwise, the magnitude of motion image also depends on the strength of scattering.
| (1) |
The expected value of v(x,y,z,t) is calculated in Eq. (2), where < > indicates taking the expected value of a random variable.
| (2) |
To find the functional relationship between motion and <v(x,y,z,t))>, we consider I(x,y,z,t-δt) = I(x-δx,y-δy,z-δz,t), assuming that scatterers at (x,y,z) displace for (δx, δy, δz) within the time interval from t-δt to t. In other words, the following conditions are equivalent: (1) OCT measurement performed at different time points from a moving sample with the beam at the same spatial coordinate; (2) OCT measurement performed with the beam at different spatial locations from a static sample “frozen” at a time point. Such equivalency is shown in Eq. (3)
| (3) |
Equivalence shown in Eq. (3) allows us to apply speckle tracking developed for motion analysis in ultrasound as well as OCT to investigate BM in isvOCA [25–29]. Based on previous studies, we can further writhe Eq. (3) as Eq. (4) where S(x,y,z) is the 3D convolution of scattering distribution function a(x,y,z) with OCT system’s 3D point spread function (PSF) h(x,y,z).
| (4) |
| (5) |
Plugging the expression of S(x,y,z) and S(x-δx,y-δy,z-δz) into Eq. (4) and taking the fact that h(x,y,z) is a deterministic rather than random function, we can re-write Eq. (4) as:
| (6) |
Assuming that the speckle is fully developed and thus scatterers in different spatial location are described by identical but independent random variables, we have Eq. (7) in which a0 is a constant representing the scattering strength.
| (7) |
Taking the sifting property of delta function, Eq. (6) can be simplified.
| (8) |
A simplified model for OCT system allows us to express h(x,y,z) as a Gaussian function (Eq. (9): ωx, ωy and ωz are the 1/e width of the PSF in x, y and z directions; B is a constant factor taking account of system efficiency and responsivity) [30].
| (9) |
Using Eq. (8) and (9), we can express <v(x,y,z,t)> in Eq. (10) where A = (a02B2/I0).
| (10) |
As shown in Eq. (10), the expected value of v(x,y,z,t) has an explicit functional dependency on motion. When δx = δy = δz = 0, <v(x,y,z,t)> = 0. Otherwise, <v(x,y,z,t)> takes a positive value. δx, δy and δz generally depend on spatial and temporal coordinates, x, y, z and t; therefore, <v(x,y,z,t)> varies as spatial and temporal coordinates. According to Eq. (10), the contrast mechanism of isvOCA is significantly different from Doppler OCT. First, Doppler OCT is only sensitive to motion in axial direction (δz) while isvOCA is sensitive to motion with arbitrary projection in δx, δy and δz directions. Second, Doppler phase shift is proportional to δz, therefore motion in opposite directions cancels each other out when contributing to Doppler signal. This does not happen in isvOCA, as image contrast essentially derives from the square of motion in x, y and z directions.
If the only source of motion within a sample is the motion of particles in liquid blood, δx, δy and δz are non-zero only for scatterers within liquid blood. According to Eq. (10), <v(x,y,z,t)> has a small value at pixels corresponding to static solid tissue but has a large value at pixels corresponding to flowing blood. Therefore, temporal variation of structural OCT signal can provide contrast for microvasculature visualization. It is worth mentioning that within flowing blood, particles have random motion as well as directional flow. The magnitude of random motion is significantly different from the ensemble directional motion that is quantified by blood flow. The random motion can be quantitatively evaluated using mean square displacement (MSD) between subsequent Bscans denoted as , , and . When signal decorrelation is primarily due to random motion within liquid blood and any one of , , and is significantly larger than the spatial resolution in respective direction, <v(x,y,z,t)> approximately equals 2A2 that is independent of flow speed. This was demonstrated experimentally in previous work by H. Ren et al [7].
On the other hand, when BM induces identical spatial displacement δx = δxBM(t), δy = δyBM(t), δz = δzBM(t) to all pixels, <v(x,y,z,t)> is no longer zero for solid tissue and the angiography image suffers from motion artifact. If δxBM(t), δyBM(t), δzBM(t) can be quantitatively extracted to restore OCT image, motion artifact in angiography image can be removed. However, simultaneous tracking of δxBM(t), δyBM(t), δzBM(t) is extremely challenging due to the 3D nature of BM. Here we propose a method to reduce motion artifact without quantitative tracking of 3D motion.
It is noted that v(x,y,z,t) has non-zero expected value due to BM. However, this expected value denoted as <vBM(t)> is the same for solid tissue at different spatial locations, because δxBM(t), δyBM(t), δzBM(t) do not depend on spatial coordinate. Therefore, BM effectively results in an increased background noise level for non-vessel tissue. On the other hand, signal corresponding to blood derives from random motion of particles within flowing blood and would remain the same magnitude when the sample is interrupted by bulk motion. Therefore, we can reduce motion artifact in isvOCA, by assessing the increased background level due to BM (<vBM(t)>) and apply <vBM(t)> as an adaptive threshold value to isvOCA image. As the value of <vBM(t)> is independent of spatial location, we can estimate <vBM(t)> through spatial averaging if the sample volume does not contain blood vessels. For sample volume containing blood vessels, spatial averaging of v(x,y,z,t) also approximately equals <vBM(t)>, because only a few pixels within the volume are corresponding to flowing blood and signal variation from blood flow plays a much less significant role compared to bulk motion in spatial averaged signal.
For angiography imaging, we acquire multiple structural 2D images (N frames of Bscan) at the same plane in the elevation direction (the same y coordinate: y = y0) and calculate the normalized signal variation for the same pixel in different frames, as shown in Eq. (11).
| (11) |
Here discrete signal is related to continuous signal as: Iij,n = I(x0 + idx,y0,z0 + jdz, t0 + nΔt) with dx and dz indicating spatial domain sampling interval.
To quantitatively evaluate BM induced artifact, we calculate the spatial average of each frame of signal variation obtained from Eq. (12) (Nx: number of Ascans in a Bscan; Nz: number of pixels in an Ascan).
| (12) |
Equation (12) indicates taking spatial average over the entire 2D isvOCA image. Such extensive average can provide a reliable approximation of BM induced increase in image background. If spatial average is performed using a smaller amount of pixels, the estimation of BM can have a higher spatial resolution. However, with fewer pixels involved in the averaging, motion signal from blood vessel might contribute substantially in and cannot be used to quantify artifact due to BM.
According to our previous discussion, n that is the spatial average of vij,n can be used to approximate <vBM>, the expected value of v(x,y,z,t) induced by BM in non-blood tissue, assuming most pixels in OCT image do not correspond to blood vessels. Therefore, we can use n as an adaptive threshold value to threshold vij,n and reduce motion artifact, as shown in Eq. (13).
| (13) |
Afterwards, we perform temporal average on thresholded OCT signal variation to generate cross-sectional microvasculature image at the given y coordinate, as shown in Eq. (14).
| (14) |
The reconstruction of cross-sectional OCT angiography with motion artifact reduction is summarized in Fig. 1 . 3D microvasculature visualization can thus be obtained from a series of cross-sectional angiography images acquired at different y locations.
Fig. 1.
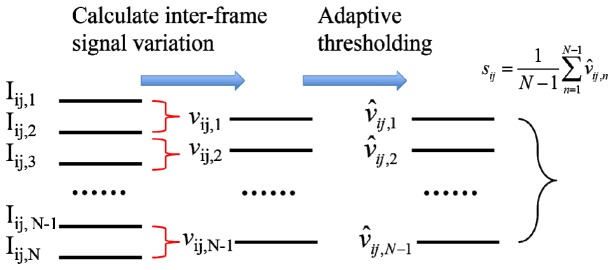
Reconstruction of motion artifact reduced OCT angiography.
3. OCT system configuration and signal processing
We used a spectral domain OCT (SD OCT) system at 1.3μm wavelength range for this study. The broadband light source (superluminescent diode, SLD1325 Thorlabs, 100nm bandwidth, corresponding to a 7.4 μm axial resolution) illuminates the reference and sample arm of a fiber-optic Michelson interferometer through a fiber-optic coupler. In the sample arm, a 3X scanning lens (SLM04, Thorlabs) is used in front of the specimen to focus the probing beam and collect back scattered photons. Light returned from sample and reference arms is routed by the fiber-optic coupler to the spectrometer where interference signal is detected by a CMOS InGaAs camera (SUI1024LDH2, Goodrich). A frame grabber (PCIe-1433, National Instrument) takes the interferometric signal from the camera and the signal is further processed. The system synchronization is achieved by triggering the camera exposure and controlling the galvanometer using the same data acquisition card (NI DAQ USB-6212 BNC, National Instrument) with the same time base. Two galvanometers scan the light beam in x and y directions to cover the transverse plane for 3D imaging. All the device controls and signal processing were performed using a host computer (Dell Precision T7600) with software developed in C + + (Microsoft Visual Studio, 2012).
Signal processing for motion artifact reduced angiography is illustrated in Fig. 2(a) . In brief, N frames of OCT Bscans are obtained at the same y plane; afterwards, interframe signal variation is calculated to obtain motion image according to Eq. (11); motion artifact is then assessed through spatial averaging according to Eq. (12); adaptive thresholding is applied to each frame of motion image to reduce BM induced artifact as in Eq. (13); multiple frames of artifact reduced motion image is averaged to generate cross-sectional angiography image using Eq. (14). Signal processing was implemented in real-time using computer unified device architecture (CUDA) on a graphic processing unit (GPU, NVIDIA Geforce GTX 780, 2304 CUDA cores at 0.9GHz, 3 GB graphics memory). The speed of signal processing was analyzed using NVIDIA Nsight that is embedded in Microsoft Visual Studio. The average time to process an Ascan on GPU for the angiography image reconstruction is shown in Fig. 2(b). With the cubic spline interpolation (wavelength to wavenumber, or λ to k) and interframe signal variation calculation taking the longest computation time, the total average time to process one Ascan for angiography imaging is about 10μs and is less than the minimum time interval for data acquisition determined by the highest line rate (92kHz) of the CMOS camera. Therefore, the imaging speed of our system is limited by the camera data acquisition rather than signal processing. With the maximum line scan rate of our CMOS camera equal to 92kHz, it takes about 3.6 seconds to generate a 256 × 256 en face angiography image by acquiring 5 Bscans (N = 5) at each y coordinate.
Fig. 2.
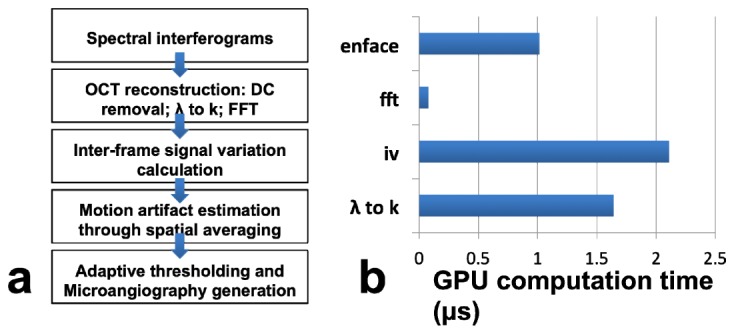
(a) Data processing flowchart of motion artifact reduced angiography; (b) Time expenditure of each processing step preformed on the GPU.
4. Results
To show that Eq. (10) is valid for BM in a solid sample, we imaged a solid scattering phantom and introduced bulk motion with known magnitude during imaging. The phantom was fabricated by curing the mixture of epoxy and titanium dioxide that served as scatterer. Bscans were obtained by steering the light beam in x direction using a galvanometer. In addition, we used another galvanometer to translate the beam in y direction to introduce a known beam displacement δyBM between the acquisitions of subsequent Bscans. As a result, every pixel in a Bscan was displaced for the same magnitude in y direction between adjacent frames. For each value of δyBM, we acquired multiple Bscans Iij,n (n = 1,2,…,25), used Eq. (11) to obtain interframe signal variation vij,n, used Eq. (12) to obtain the spatial average of vij,n denoted as n, and calculated : . N = 25 is chosen because this value can provide sufficient temporal averaging to reduce random noise in the obtained values of . However, when N is significantly larger than 25, the denoise effect of temporal averaging saturates. Results obtained at different magnitudes of bulk motion in y direction are shown in Fig. 3 as red circles. Error bar at each data point corresponds to standard deviation between n for n = 2, 3, …, 25, at each δyBM. Clearly, increases as δyBM. To further demonstrate the functional dependency of on δyBM, we used the known values of δyBM and to fit the following model derived from Eq. (10) with δx = δz = 0 and δy = δyBM: . ωy took a value of 17μm according to the optical property of scanning lens used in the sample arm. The constant was included in this model to take account for signal decorrelation due to random perturbation from ambient environment. Least square fitting of this model is shown as the black curve that is highly consistent with measured data points. The fitting lead to = 0.2075 and A = 1.1. The R2 statistics of the fitting is larger than 0.99, indicating Eq. (10) appropriately models the functionally dependency of isvOCA signal on the magnitude of bulk motion.
Fig. 3.
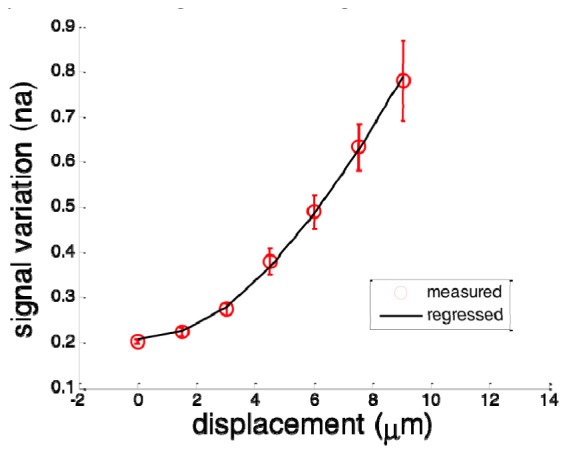
Measured spatial average of intensity variation (red circles with errorbar) and fitted curve (black).
To further validate Eq. (10) for BM in different directions, we performed Bscan on the same phantom as described above and introduced BM by applying additional voltage to x and y galvanometers respectively so that BM had both x and y components: δxBM = δdcosθ and δyBM = δdsinθ. The direction of motion was determined by θ and the magnitude of motion was determined by δd. With different values of θ and δd, we obtained multiple sets of structural OCT images. Similarly, we calculated vij,n, n and the average of n denoted as for different BM. Results are shown in Fig. 4 with δd as horizontal axis. Data points in different colors correspond to different θ, or different direction of motion. Figure 4 indicates remains the same for transverse motion in different direction but with the same magnitude. This is because of the circular geometry of imaging optics that leads to ωx = ωy = ωt. When transverse motion is considered and δzBM = 0, can be expressed as: . Clearly, does not depends on θ when δxBM = δdcosθ and δyBM = δdsinθ and this is consistent with results in Fig. 4. In Fig. 4, larger inconsistency can be observed between results obtained with motion in different directions at larger displacements, because suffers from noise that is larger when δd is larger. This is also illustrated in Fig. 3 where error bars are larger for larger displacement.
Fig. 4.
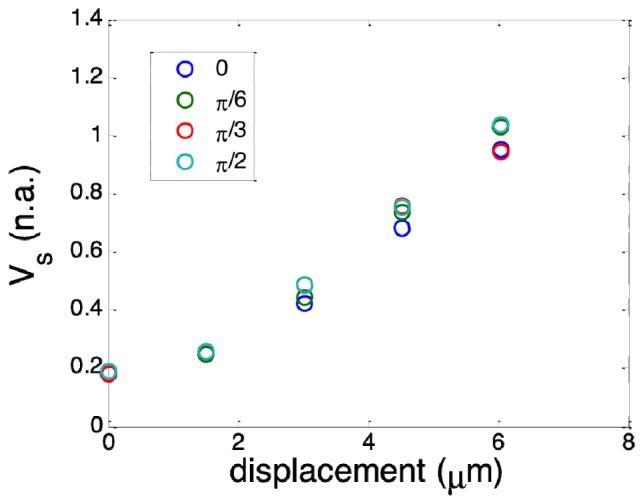
Spatial average of motion image obtained with BM that has different magnitude and direction.
To demonstrate the principle of adaptive thresholding in motion artifact removal, we established a phantom by embedding a transparent polyimide tube in solid scattering medium (cured mixture of epoxy and titanium dioxide) and filling the polyimide tube with bovine milk. We used milk as a scattering fluid to mimic the blood flow because the fat particles in milk scatter light similarly to red blood cells (RBC’s) in blood [31]. We performed structural and isvOCA imaging on the phantom. Figure 5(a) shows the Bscan OCT image (log scale) of the phantom and Fig. 5(b) shows the isvOCA image (linear scale) obtained without bulk motion. In Fig. 5(b), the tube filled with liquid has large signal amplitude due to random motion of protein particles within the liquid milk. In comparison, the solid part of the phantom has small signal amplitude in isvOCA image because the scatterers were static. Notably, the capillary filled with scattering liquid was placed in horizontal plane and we did not use any external mechanism to generate direction flow. Therefore, motion signal was completely derived from random motion of scatterers in liquid medium.
Fig. 5.
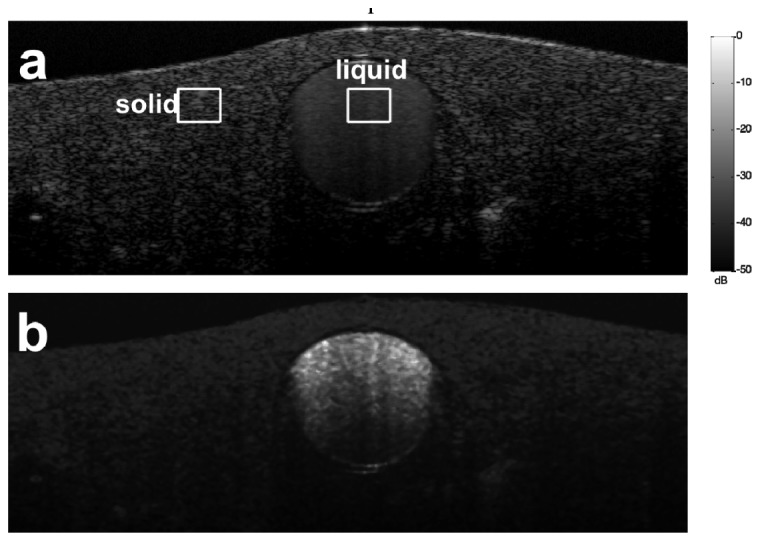
Structural (a) and flow (b) image of a phantom with a polyimide tube filled with bovine milk embedded in solid scattering medium
To illustrate how bulk motion degrades the quality of isvOCA image, we introduced BM in x and y directions respectively in addition to raster scanning pattern by applying pre-defined voltage to the galvanometer. This was done in a way similar to our previous experiments on solid phantom. We calculated interframe signal variation vij,n. Afterwards, we performed spatial averaging on vij,n for solid and liquid parts of the phantom as enclosed by rectangles in Fig. 5(a) to obtain solid,n and liquid,n. solid and liquid were thereafter obtained through averaging solid,n and liquid,n for different values of n. solid and liquid (normalized) obtained with different magnitudes of x (red circles) and y (green circles) displacement are shown in Fig. 6(a) and 6(b), respectively. Clearly, solid increases as increased bulk motion, which is consistent with Eq. (10) and our experimental results in Fig. 3 and 4. On the other hand, liquid remains approximately the same at different magnitude of bulk motion, because it was the random motion of particles within the tube that resulted in complete decorrelation between signals in different frames. This is consistent with our previous analysis and also consistent with experimental results in a previous study that stated the high sensitivity of microvasculature visualization based on interframe OCT signal variation was due to random Brownian motion of scatterers [7]. As signal at solid part of the sample increases with BM while signal remains the same at liquid part of the sample, suppressing background signal due to BM by thresholding can effectively enhance the visualization of flow in isvOCA.
Fig. 6.
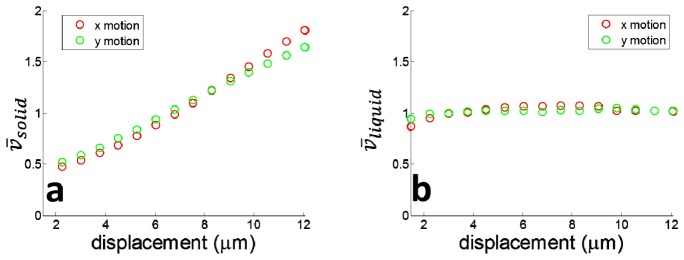
(a) solid increase as motion in both x and y directions; (b) liquid remains almost constant with bulk motion
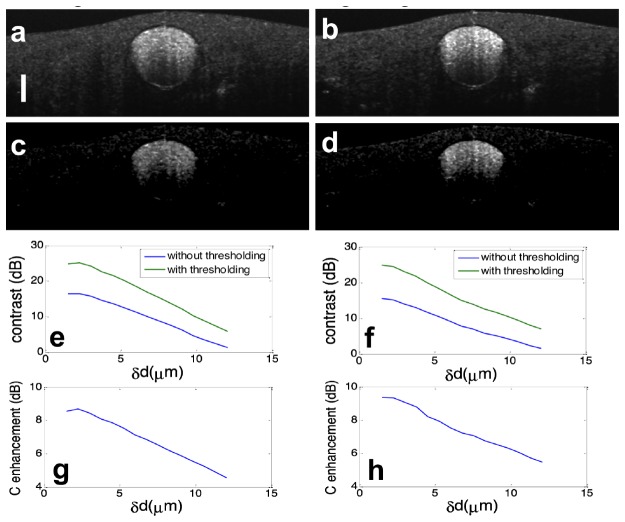
To demonstrate the effectiveness of adaptive thresholding in cross-sectional flow imaging, we obtained multiple Bscans from the same phantom as shown in Fig. 5(a) at the same y coordinate. We calculated interframe signal variation using Eq. (11), and performed temporal averaging on the signal variation obtained to generate flow image. Figure 7(a) and 7(b) were obtained without adaptive thresholding when bulk motion was in x and y directions respectively. The magnitude of displacement between adjacent Bscans is 6μm. Due to bulk motion, flow signal at the solid part of the phantom does not diminish. For comparison, we applied our adaptive thresholding method to the same OCT data set used to obtain Fig. 7(a) and 7(b). The results are shown in Fig. 7(c) and 7(d) where solid part of the sample appears to be dark. To quantitatively evaluate the enhancement in image quality by using adaptive thresholding, we calculated the image contrast defined as C = 20log10[( liquid- solid)/ solid] where liquid and solid were obtained by calculating the averaged isvOCA signal within rectangles shown in Fig. 5(a). Figure 7(e) and 7(f) show contrast of isvOCA image obtained without (blue) and with (green) adaptive thresholding when BM was in x and y directions. Figure 7(g) and 7(h) show adaptive thresholding could enhance the contrast of isvOCA. Clearly, a 5 to 10 dB enhancement in contrast was achieved through adaptive thresholding.
Fig. 7.
Cross-sectional flow image obtained without adaptive thresholding when bulk motion was in x dimension (a) and y dimension (b); Cross-sectional flow image obtained with adaptive thresholding when bulk motion was in x dimension (c) and y dimension (d); contrast of flow image, with (green) and without (blue) adaptive thresholding at different magnitude of motion in x direction (e) and y direction (f); contrast enhancement through adaptive thresholding when motion was in x direction (g) and y direction (h).
Results in Fig. 7 suggest that the proposed adaptive thresholding method can reduce BM induced artifact more effectively when the magnitude of angiography signal derived from global BM is smaller. This is because, v(x,y,z,t), the interframe signal variation that provides contrast for motion imaging, is a random variable and can have different values in the vicinity of its expected value. When large BM results in large signal decorrelation, pixels corresponding to solid tissue or flow cannot be differentiated by their magnitudes and thus adaptive thresholding would fail to reduce motion artifact. As shown in Fig. 7(c) and 7(d), although background due to BM is significantly suppressed through adaptive thresholding, signal due to particle motion within liquid at the bottom of the polyimide tube also diminishes. Moreover, Fig. 7(g) and 7(h) indicate contrast enhancement obtained from adaptive thresholding decreases when BM has a larger magnitude.
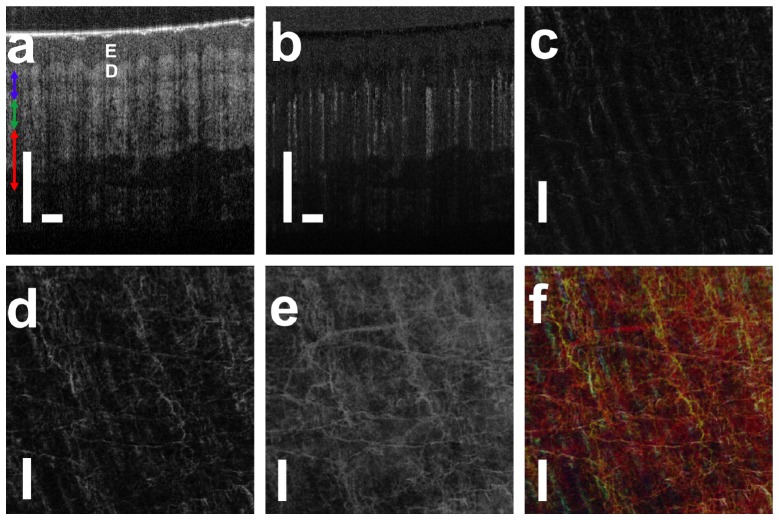
Using real-time software based on GPU, we conducted in vivo subcutaneous microvasculature imaging on healthy human volunteer and obtained motion artifact reduced isvOCA. A cross-sectional structural OCT image and the corresponding cross-sectional isvOCA image of the palm skin are shown in Fig. 8(a) and 8(b). 5 Bscans were obtained at each y coordinate to generate cross-sectional isvOCA. To obtain en face visualization of angiography image, raster scanning was performed in both x (fast axis) and y (slow axis) directions to obtain 3D OCT data volume. To reduce the 3D data volume for en face visualization, we averaged angiography signal in z direction at small (500μm - 650μm), medium (650μm - 800μm) and large (800μm - 1100μm) depths (referred to zero-delay plane) as indicated by blue, green and red arrows in Fig. 8(a). En face blood vessel maps at small, medium and large depths are shown in Fig. 8(c), 8(d) and 8(e). Figure 8(c) shows a smaller amount of superficial capillaries that follow the arrangement of friction ridges of human hand. More blood vessels are seen in Fig. 8(d). Figure 8(e) suggests more and larger blood vessels are located further from the skin surface. We assigned pixel values in Fig. 8(c), 8(d) and 8(e) to blue, green and red channels in a RGB color image as shown in Fig. 8(f). Scale bars in Fig. 8 represent 500μm. isvOCA imaging was also conducted on human fingertip and a skin lesion with results shown in Fig. 9(a) and 9(b). Figure 9(a) shows that microvasculature at fingertip follows the fingerprint, which is consistent with previous studies using OCT and scanning electron microscopy (SEM) [32]. Figure 9(b) shows larger blood vessels connected to the lesion to supply its increased metabolism activity.
Fig. 8.
(a) structural OCT image of human palm skin (E: epidermis; D: dermis); (b) cross-sectional angiography image that highlights blood vessel; (c) – (e) en face microvasculature image in small, medium and large depths; (f) microvasculature image that encodes signal depth with color.
Fig. 9.
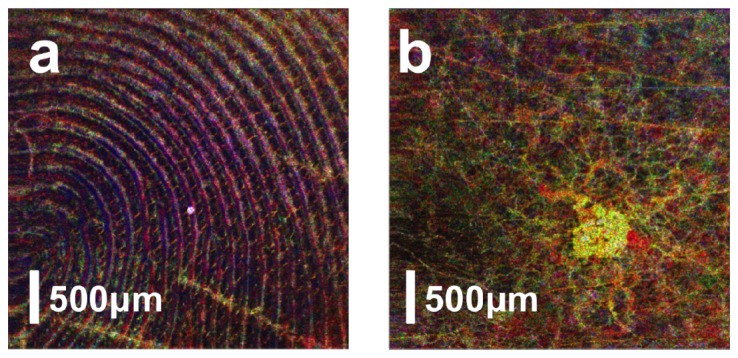
isvOCA image obtained from human fingertip (a) and a small skin lesion (b).
As discussed before, adaptive thresholding can effectively remove artifact when BM is sufficiently small in magnitude compared to the random motion of scatterers within liquid blood. To demonstrate this, we conducted in vivo imaging from the palm of our subject. Figure 10(a) and 10(b) were obtained from the palm of subject using the same set of raw structural OCT signal, without and with adaptive thresholding. During data acquisition for Fig. 10(a) and 10(b), the magnitude of bulk motion was minimized with a hand rest to constrain the bulk motion. However, motion artifacts still exist in Fig. 10(a), shown as the horizontal lines. In comparison, Fig. 10(b) does not have horizontal lines and has a significantly improved image contrast, indicating the effectiveness of adaptive thresholding in motion artifact removal. The hand rest was removed in acquiring data for Fig. 10(c) and 10(d). With larger magnitude of motion, adaptive thresholding cannot completely remove motion artifact. Although blood vessels are more visible in Fig. 10(d) compared to Fig. 10(c), the image quality of Fig. 10(d) is inferior to Fig. 10(b) and horizontal line artifacts still exist in Fig. 10(d). This is consistent with results from controlled experiment shown in Fig. 7.
Fig. 10.
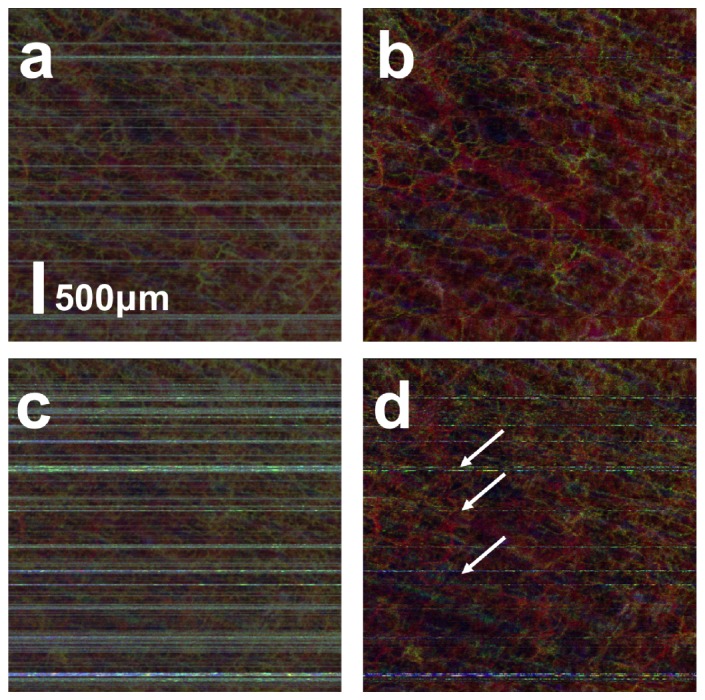
Angiography image obtained (a) with small magnitude of BM without adaptive thresholding; (b) with small magnitude of BM with adaptive thresholding; (c) with large magnitude of BM without adaptive thresholding; (b) with large magnitude of BM with adaptive thresholding.
It is worth mentioning that the CMOS camera was operated at its highest speed (92 kHz, line scan rate) during our experiments. For 2D imaging on phantom with results shown in Fig. 3-7, each Bscan contained 1024 Ascans and the time interval between each Bscan was 0.011s. For in vivo imaging of human skin, we acquired 512 Ascans in each Bscan, so that large enough field-of-view could be achieved at a reasonably high frame rate to illustrate morphological feature of subcutaneous microvasculature. Therefore, in vivo imaging was conducted at a 180Hz frame rate or a 0.0056s time interval between adjacent Bscans.
5. Discussion
Adaptive thresholding can reduce motion artifact in isvOCA because signal level of flowing blood does not depend on BM while noise floor does. Physical origin of image contrast in OCT angiography based on interframe signal variation was attributed to random Brownian motion by H. Ren et al [7]. The magnitude of Brownian motion of blood cells can be estimated according to Einstein’s theory (〈[Δd(t)]2〉 = 2Dt) and measured experimentally [33–35]. However, the square root of 〈[Δd(t)]2〉is smaller than 1μm for the experimental setting in this study. In other words, the magnitude of Brownian motion is not large enough to completely decorrelate OCT signal between Bscans. Therefore, Brownian motion of individual blood cells might not be the most appropriate description of random motion that decorrelates OCT signal. A more appropriate modeling is needed.
It is assumed throughout the manuscript that BM resulted in identical displacement for all pixels corresponding to solid tissue. However, biological tissue is not rigid and the assumption of identical displacement is not valid when tissue deforms. However, if the mechanical property of tissue can be considered as homogeneous within sub-regions and we can quantify the impact of BM by averaging signal from a smaller number of neighboring pixels, adaptive thresholding can still be used to reduce motion artifact.
We conducted experiments with BM in x and y directions by simply applying pre-defined voltage to the galvanometers. However, as shown in Eq. (10), <v> depends on motion that can have non-zero components in x, y and z directions. Therefore, our method for motion artifact reduction is also valid for motion with axial component. In fact, during in vivo imaging of microvasculature, BM could be in arbitrary directions and our method successfully removed motion artifact, indicating adaptive thresholding is effective for BM with both lateral and axial components.
Large motion artifact as shown in Fig. 10(c) and 10(d) can be easily removed using a larger value to threshold the interframe signal variation signal. This can be achieved by replacing in Eq. (13) with where A is a constant larger than 1. In real application, the maximal bulk motion amplitude that current method can remove effectively depends on the speed of blood flow of interest. Artifact due to large motion can be suppressed with a larger threshold which however also excludes signal due to blood flow from being detected, as shown in Fig. 7. As a result, the trade-off between the motion artifact removal and blood flow detection is inherent to the thresholding based motion artifact removal.
Our theoretical analysis in this study is based on fully developed speckle. With the assumption of fully developed speckle, <v(x,y,z,t)> only depends on motion but does not depend on local optical property of tissue, as shown in Eq. (10). This implies that contrast of flow image based on normalized signal variation only derives from motion. However, speckle does not always develop fully in practice. As a result, the correlation between spatially shifted scattering distribution functions is not a Dirac Delta function and the expected value of normalized signal variation depends on both motion and optical property of sample. Nevertheless, signal due to bulk motion in motion image can have the same value if tissue has homogeneous optical property, when fully developed speckle assumption does not hold.
Acknowledgment
The research reported in this paper was supported by internal funding from New Jersey Institute of Technology and Michigan Technological University.
References and link
- 1.Chen Z., Milner T. E., Srinivas S., Wang X., Malekafzali A., van Gemert M. J. C., Nelson J. S., “Noninvasive imaging of in vivo blood flow velocity using optical Doppler tomography,” Opt. Lett. 22(14), 1119–1121 (1997). 10.1364/OL.22.001119 [DOI] [PubMed] [Google Scholar]
- 2.Zhao Y., Chen Z., Saxer C., Xiang S., de Boer J. F., Nelson J. S., “Phase-resolved optical coherence tomography and optical Doppler tomography for imaging blood flow in human skin with fast scanning speed and high velocity sensitivity,” Opt. Lett. 25(2), 114–116 (2000). 10.1364/OL.25.000114 [DOI] [PubMed] [Google Scholar]
- 3.Izatt J. A., Kulkarni M. D., Yazdanfar S., Barton J. K., Welch A. J., “In vivo bidirectional color Doppler flow imaging of picoliter blood volumes using optical coherence tomography,” Opt. Lett. 22(18), 1439–1441 (1997). 10.1364/OL.22.001439 [DOI] [PubMed] [Google Scholar]
- 4.Makita S., Hong Y., Yamanari M., Yatagai T., Yasuno Y., “Optical coherence angiography,” Opt. Express 14(17), 7821–7840 (2006). 10.1364/OE.14.007821 [DOI] [PubMed] [Google Scholar]
- 5.Makita S., Fabritius T., Yasuno Y., “Quantitative retinal-blood flow measurement with three-dimensional vessel geometry determination using ultrahigh-resolution Doppler optical coherence angiography,” Opt. Lett. 33(8), 836–838 (2008). 10.1364/OL.33.000836 [DOI] [PubMed] [Google Scholar]
- 6.Wang R. K., An L., “Doppler optical micro-angiography for volumetric imaging of vascular perfusion in vivo,” Opt. Express 17(11), 8926–8940 (2009). 10.1364/OE.17.008926 [DOI] [PMC free article] [PubMed] [Google Scholar]
- 7.Ren H., Du C., Pan Y., “Cerebral blood flow imaged with ultrahigh-resolution optical coherence angiography and Doppler tomography,” Opt. Lett. 37(8), 1388–1390 (2012). 10.1364/OL.37.001388 [DOI] [PMC free article] [PubMed] [Google Scholar]
- 8.Huang Y., Liu X., Kang J. U., “Real-time 3D and 4D Fourier domain Doppler optical coherence tomography based on dual graphics processing units,” Biomed. Opt. Express 3(9), 2162–2174 (2012). 10.1364/BOE.3.002162 [DOI] [PMC free article] [PubMed] [Google Scholar]
- 9.Wang R. K., Jacques S. L., Ma Z., Hurst S., Hanson S. R., Gruber A., “Three dimensional optical angiography,” Opt. Express 15(7), 4083–4097 (2007). 10.1364/OE.15.004083 [DOI] [PubMed] [Google Scholar]
- 10.Mariampillai A., Standish B. A., Moriyama E. H., Khurana M., Munce N. R., Leung M. K. K., Jiang J., Cable A., Wilson B. C., Vitkin I. A., Yang V. X. D., “Speckle variance detection of microvasculature using swept-source optical coherence tomography,” Opt. Lett. 33(13), 1530–1532 (2008). 10.1364/OL.33.001530 [DOI] [PubMed] [Google Scholar]
- 11.An L., Qin J., Wang R. K., “Ultrahigh sensitive optical microangiography for in vivo imaging of microcirculations within human skin tissue beds,” Opt. Express 18(8), 8220–8228 (2010). 10.1364/OE.18.008220 [DOI] [PMC free article] [PubMed] [Google Scholar]
- 12.Liu X., Zhang K., Huang Y., Kang J. U., “Spectroscopic-speckle variance OCT for microvasculature detection and analysis,” Biomed. Opt. Express 2(11), 2995–3009 (2011). 10.1364/BOE.2.002995 [DOI] [PMC free article] [PubMed] [Google Scholar]
- 13.Blatter C., Weingast J., Alex A., Grajciar B., Wieser W., Drexler W., Huber R., Leitgeb R. A., “In situ structural and microangiographic assessment of human skin lesions with high-speed OCT,” Biomed. Opt. Express 3(10), 2636–2646 (2012). 10.1364/BOE.3.002636 [DOI] [PMC free article] [PubMed] [Google Scholar]
- 14.Stücker M., Baier V., Reuther T., Hoffmann K., Kellam K., Altmeyer P., “Capillary blood cell velocity in human skin capillaries located perpendicularly to the skin surface: measured by a new laser Doppler anemometer,” Microvasc. Res. 52(2), 188–192 (1996). 10.1006/mvre.1996.0054 [DOI] [PubMed] [Google Scholar]
- 15.Yang V. X., Gordon M. L., Mok A., Zhao Y., Chen Z., Cobbold R. S., Wilson B. C., Vitkin I. A., “Improved phase-resolved optical Doppler tomography using Kasai velocity estimator and histogram segmentation,” Opt. Commun. 208(4–6), 209–214 (2002). 10.1016/S0030-4018(02)01501-8 [DOI] [Google Scholar]
- 16.Fingler J., Zawadzki R. J., Werner J. S., Schwartz D., Fraser S. E., “Volumetric microvascular imaging of human retina using optical coherence tomography with a novel motion contrast technique,” Opt. Express 17(24), 22190–22200 (2009). 10.1364/OE.17.022190 [DOI] [PMC free article] [PubMed] [Google Scholar]
- 17.Yu L., Chen Z., “Doppler variance imaging for three-dimensional retina and choroid angiography,” J. Biomed. Opt. 15(1), 016029 (2010). 10.1117/1.3302806 [DOI] [PMC free article] [PubMed] [Google Scholar]
- 18.Grulkowski I., Gorczynska I., Szkulmowski M., Szlag D., Szkulmowska A., Leitgeb R. A., Kowalczyk A., Wojtkowski M., “Scanning protocols dedicated to smart velocity ranging in spectral OCT,” Opt. Express 17(26), 23736–23754 (2009). 10.1364/OE.17.023736 [DOI] [PubMed] [Google Scholar]
- 19.An L., Subhush H. M., Wilson D. J., Wang R. K., “High-resolution wide-field imaging of retinal and choroidal blood perfusion with optical microangiography,” J. Biomed. Opt. 15(2), 026011 (2010). 10.1117/1.3369811 [DOI] [PMC free article] [PubMed] [Google Scholar]
- 20.Mariampillai A., Leung M. K. K., Jarvi M., Standish B. A., Lee K., Wilson B. C., Vitkin A., Yang V. X. D., “Optimized speckle variance OCT imaging of microvasculature,” Opt. Lett. 35(8), 1257–1259 (2010). 10.1364/OL.35.001257 [DOI] [PubMed] [Google Scholar]
- 21.Liu G., Qi W., Yu L., Chen Z., “Real-time bulk-motion-correction free Doppler variance optical coherence tomography for choroidal capillary vasculature imaging,” Opt. Express 19(4), 3657–3666 (2011). 10.1364/OE.19.003657 [DOI] [PMC free article] [PubMed] [Google Scholar]
- 22.Liu G., Jia W., Sun V., Choi B., Chen Z., “High-resolution imaging of microvasculature in human skin in-vivo with optical coherence tomography,” Opt. Express 20(7), 7694–7705 (2012). 10.1364/OE.20.007694 [DOI] [PMC free article] [PubMed] [Google Scholar]
- 23.Lee K. K. C., Mariampillai A., Yu J. X. Z., Cadotte D. W., Wilson B. C., Standish B. A., Yang V. X., “Real-time speckle variance swept-source optical coherence tomography using a graphics processing unit,” Biomed. Opt. Express 3(7), 1557–1564 (2012). 10.1364/BOE.3.001557 [DOI] [PMC free article] [PubMed] [Google Scholar]
- 24.Zhang K., Kang J. U., “Real-time 4D signal processing and visualization using graphics processing unit on a regular nonlinear-k Fourier-domain OCT system,” Opt. Express 18(11), 11772–11784 (2010). 10.1364/OE.18.011772 [DOI] [PMC free article] [PubMed] [Google Scholar]
- 25.Chen J.-F., Fowlkes J. B., Carson P. L., Rubin J. M., “Determination of scan-plane motion using speckle decorrelation: theoretical considerations and initial test,” Int. J. Imaging Syst. Technol. 8(1), 38–44 (1997). [DOI] [Google Scholar]
- 26.Li P. C., Cheng C. J., Yeh C. K., “On velocity estimation using speckle decorrelation,” IEEE Trans. Ultrason. Ferroelectr. Freq. Control 48(4), 1084–1091 (2001). 10.1109/58.935727 [DOI] [PubMed] [Google Scholar]
- 27.Ahmad A., Adie S. G., Chaney E. J., Sharma U., Boppart S. A., “Cross-correlation-based image acquisition technique for manually-scanned optical coherence tomography,” Opt. Express 17(10), 8125–8136 (2009). 10.1364/OE.17.008125 [DOI] [PMC free article] [PubMed] [Google Scholar]
- 28.Liu X., Huang Y., Kang J. U., “Distortion-free freehand-scanning OCT implemented with real-time scanning speed variance correction,” Opt. Express 20(15), 16567–16583 (2012). 10.1364/OE.20.016567 [DOI] [Google Scholar]
- 29.Liu X., Huang Y., Ramella-Roman J. C., Mathews S. A., Kang J. U., “Quantitative transverse flow measurement using optical coherence tomography speckle decorrelation analysis,” Opt. Lett. 38(5), 805–807 (2013). 10.1364/OL.38.000805 [DOI] [PMC free article] [PubMed] [Google Scholar]
- 30.Fercher A. F., Drexler W., Hitzenberger C. K., Lasser T., “Optical coherence tomography - principles and applications,” Rep. Prog. Phys. 66(2), 239–303 (2003). 10.1088/0034-4885/66/2/204 [DOI] [Google Scholar]
- 31.Michalski M., Briard V., Michel F., “Optical parameters of milk fat globules for laser light scattering measurements,” Lait 81(6), 787–796 (2001). 10.1051/lait:2001105 [DOI] [Google Scholar]
- 32.Sangiorgi S., Manelli A., Congiu T., Bini A., Pilato G., Reguzzoni M., Raspanti M., “Microvascularization of the human digit as studied by corrosion casting,” J. Anat. 204(2), 123–131 (2004). 10.1111/j.1469-7580.2004.00251.x [DOI] [PMC free article] [PubMed] [Google Scholar]
- 33.Einstein A., “Investigations on the Theory of Brownian Movement,” Ann. Phys. 17, 549 (1905). 10.1002/andp.19053220806 [DOI] [Google Scholar]
- 34.Higgins J. M., Eddington D. T., Bhatia S. N., Mahadevan L., “Statistical dynamics of flowing red blood cells by morphological image processing,” PLOS Comput. Biol. 5(2), e1000288 (2009). 10.1371/journal.pcbi.1000288 [DOI] [PMC free article] [PubMed] [Google Scholar]
- 35.Li T., Kheifets S., Medellin D., Raizen M. G., “Measurement of the instantaneous velocity of a Brownian particle,” Science 328(5986), 1673–1675 (2010). 10.1126/science.1189403 [DOI] [PubMed] [Google Scholar]


