Abstract
In this work, we proposed a novel three-dimensional compressive sensing (CS) approach for spectral domain optical coherence tomography (SD OCT) volumetric image acquisition and reconstruction. Instead of taking a spectral volume whose size is the same as that of the volumetric image, our method uses a sub set of the original spectral volume that is under-sampled in all three dimensions, which reduces the amount of spectral measurements to less than 20% of that required by the Shan-non/Nyquist theory. The 3D image is recovered from the under-sampled spectral data dimension-by-dimension using the proposed three-step CS reconstruction strategy. Experimental results show that our method can significantly reduce the sampling rate required for a volumetric SD OCT image while preserving the image quality.
OCIS codes: (170.4500) Optical coherence tomography, (100.3010) Image reconstruction techniques
1. Introduction
Ultrahigh resolution 3D optical coherence tomography (OCT) imaging is a powerful and efficient technique for disease diagnosis and medical treatment of various tissues [1–4]. It is usually obtained by assembling consecutively acquired B-scans. 3D OCT provides volumetric visualization and quantification of tissue morphology features, reduction of the sampling error introduced by missing a sample location in 2D imaging, and reconstruction of en-face view of the tissue [5]. Nevertheless, 3D OCT imaging requires a long data acquisition time and large amount of spectral measurements which makes it susceptible to the unavoidable motion artifact.
Recently, compressive sensing (CS) [6,7] has been studied extensively for the high-resolution OCT image reconstruction [8–17]. It has been shown that high quality OCT image can be reconstructed using a fraction of the spectral measurements required by the Shannon/Nyqusit theory through CS reconstruction, which reduces the data acquisition time as well as the spectral data size while preserving the image quality. Application of CS on the OCT volumetric imaging has been reported in [15]. It acquires a sub set of B-scans required for the full 3D imaging and uses them to recover the missing ones through CS reconstruction. Although the under-sampled image data is used in the CS reconstruction, the sampling pattern is equivalent to sparsely sampling the spectral volume for the original 3D image in the slow-scanning lateral direction. The selected B-scans are reconstructed using 100% spectral measurements through classical method before CS reconstruction. They demonstrated volumetric OCT image recovery from up to 75% of missing data. In the studies by the same group, two similar sampling patterns are described: one consists of sparsely selected horizontal B-scans and vertical B-scans [16], while the other one takes several radial B-scans [17]. These two sampling patterns can be considered as under-sampling the original spectral volume in both the fast-scanning and slow-scanning lateral directions. The sampling patterns in [15–17] all require 100% spectral measurements for the selected B-scans. The under-sampling is implemented on one or two lateral directions of the original spectral volume.
Most other CS OCT studies have used sampling patterns that reduce the size of spectral measurements for each A-scan, i.e. the under-sampling is done in the spectral domain directly. A-scans are reconstructed from the under-sampled spectral measurements; then several A-scans are placed together in the fast-scanning direction to form a B-scan. Volumetric image can be generated by repeating the same process for all the B-scans in the volume. Usually, 40%–50% spectral data is needed to reconstruct a high-quality OCT image for biological samples with complex morphology.
The above sampling patterns, however, only consider the under-sampling in one or two dimensions of the spectral data and use 100% measurements for the rest, which does not take full advantage of the sparse sampling, especially for the reconstruction of volumetric data. The under-sampling rate can be further reduced by exploring the sparse sampling in all three dimensions of the volumetric spectral data.
In this work, we proposed a novel sampling pattern that under-samples the spectral volume for 3D OCT image in all three directions (axial, fast-scanning lateral (B-scan) and slow-scanning lateral (C-scan)). This method can be considered as a combination of previous sampling patterns which do the under-sampling in either the axial direction or the lateral direction. The final under-sampling rate for volumetric image is the multiplication of its under-sampling rate in all three directions, which will be much lower than any one of them or the multiplication of two. Thus, our proposed sampling pattern has the potential to achieve a smaller under-sampling rate than current methods.
To recover the 3D image, we proposed a three-step CS strategy which recovers the missing volumetric image data dimension-by-dimension. In other words, the one-dimensional CS reconstruction procedure is applied separately to the recovery of 3D image data in each direction. Our proposed sampling pattern and CS reconstruction strategy can also be easily adapted to the reconstruction of 2D OCT image to reduce the size of its spectral measurements as well as the scanning time. To the best of our knowledge, this is also the first time that under-sampling in both dimensions of the B-scan has been explored for CS OCT imaging.
Our proposed sampling pattern and CS reconstruction strategy are tested on the OCT data of in vivo biological tissues. The experimental results show that high-quality and high-resolution OCT images can be reconstructed from less than 20% of the spectral measurements.
2. Methods
2.1. CS OCT
The reconstruction in CS SDOCT using a subset of the measurements is obtained by solving a constrained optimization problem that maximizes the sparsity of the signal in the transformed domain while preserving the fidelity of the signal in the measurement domain. The under-sampled measurement is denoted as yu and the desired image signal is denoted as x. Both of them are one-dimensional in this paper. Note that x is always in the spatial domain. The CS reconstruction process can be formulated as:
| (1) |
where M is a sampling mask that denotes the data acquired in yu. F is the transformation between the measurements domain and the spatial domain. Ψ is the sparsifying operator that transforms x to a sparse representation. ε is the parameter that controls the fidelity of the signal in the measurement domain. ‖•‖1 denotes the l1-norm and ‖•‖2 is the l2-norm.
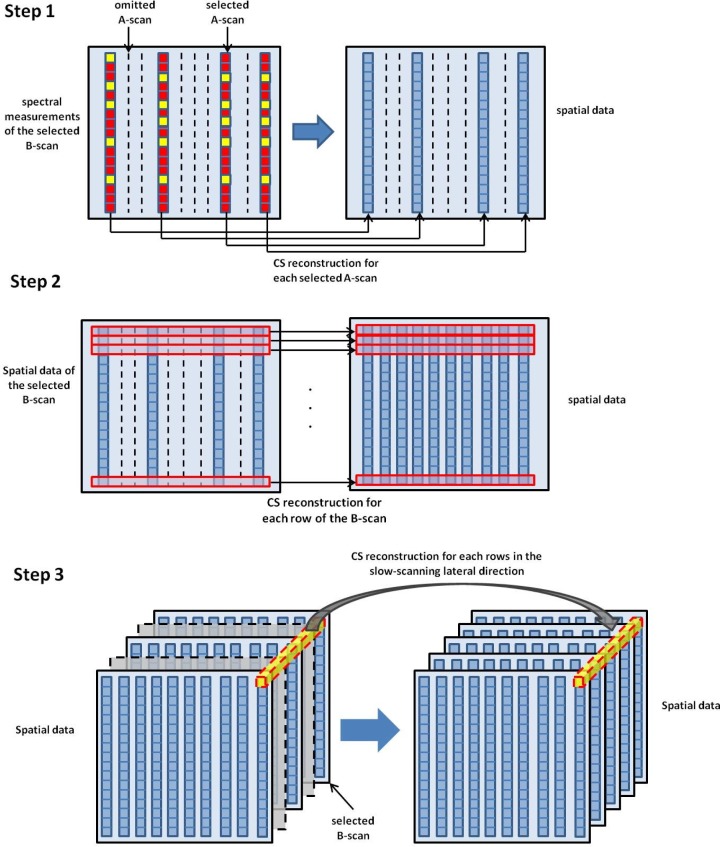
There are two different kinds of measurement domains used in this paper: spectral and spatial. For CS reconstruction in the axial direction (step 1 in Fig. 2), yu is the under-sampled data in spectral domain and F is the Fourier transformation matrix. Ψ is chosen as the identity matrix since OCT image is shown to be sparse enough in the spatial domain [8, 10, 11]. For CS reconstruction in either of the lateral directions (step 2 and 3 in Fig. 2), yu is the under-sampled data in spatial domain. F is the identity matrix. Ψ cannot be the identity matrix any more since the measurement domain cannot be the same as the sparsifying domain. Instead, two different kinds of sparsifying operator are used: the wavelet transformation and the Fourier transformation.
Fig. 2.
Schematic demonstration of the proposed three-step CS reconstruction strategy.
2.2. Under-sampling pattern
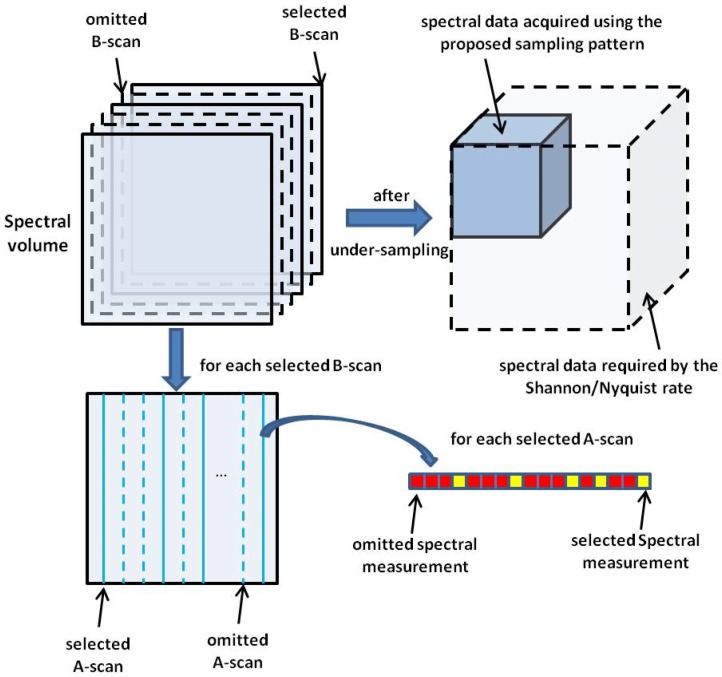
The proposed sampling pattern which under-samples the original spectral volume for the volumetric OCT image in all three directions is schematically presented in Fig. 1. The under-sampling in the C-scan is made up of randomly selected B-scans in the volume; a subset of the A-scans in each B-scan is randomly chosen to accomplish the under-sampling in the fast-scanning lateral direction; for each A-scan, a fraction of the k-space measurements is acquired. The comparison of the data amount between the acquired under-sampled spectral volume and the original spectral volume for 3D OCT image is also illustrated in Fig. 1. It shows that the spectral data obtained using the proposed sampling pattern is scaled-down in all three dimensions of the spectral measurements required by the Shannon/Nyquist rate.
Fig. 1.
Schematic demonstration of the proposed sampling pattern which under-samples the original spectral volume in all three dimensions.
The uniformly random under-sampling with constraint on a maximum gap size is applied to both lateral directions and the linear-k sampling mask proposed in [11] is used for under-sampling the k-space data in the axial resolution.
2.3. Volumetric data reconstruction
To reconstruct the 3D OCT image using the under-sampled spectral volume described in Sec. 2.2, we propose a three-step CS strategy, which is schematically illustrated in Fig. 2. In the first step, the selected A-scans in each B-scan are reconstructed from their under-sampled k-space measurements individually through CS reconstruction. The CS reconstructions of different A-scans are independent of each other in this process. In the second step, the CS reconstruction is applied to each selected B-scan row-by-row. The image data from the fully reconstructed A-scans in the first step are served as the under-sampled data (yu in Eq. (1)) while those from the omitted ones are recovered by CS. The reconstructions of different rows in this step are also independent of each other. After this step, all A-scans image data for the selected B-scan is recovered. In the final step, fully recovered B-scan images are used as the input data for CS volume reconstruction to recover the missing B-scan images. Note that in this stepwise process, the under-sampled measurements yu in step 1 are in the k-space, while in step 2 and 3, they are image data in the spatial domain. YALL1 [18, 19] with the default parameters is used to solve the CS reconstructions.
3. Experimental results
3.1. System configuration
The proposed sampling pattern and CS reconstruction strategy are evaluated using spectral OCT data obtained from an in-house developed SD COT. The system uses a 12-bit, 70 kHz, 2048 pixel CCD line-scan camera (EM4, e2v, USA) as the detector array of the spectrometer. The spectrometer is designed to use a superluminescent (SLED) diode light source having 105 nm bandwidth centered at 845 nm. The axial resolution of the system is approximately 4 μm in the air. Its transversal resolution is approximately 12 μm. The spectral volume used in the CS reconstructions is under-sampled from the pre-generated full size k-space volume for the 3D OCT image. The original volume data contains 250 B-scans which covers an area of 1mm×1mm. The frame size of each B-scan is 2048(axial)×1000(fast-scanning lateral). The camera covers a spectral range of 240 nm which implies a sampling rate of 0.117 nm/pixel. All animal studies were conducted in accordance with the Johns Hopkins University Animal Care and Use Committee Guidelines.
The data processing were implemented with MATLAB R2014a on a desktop with Intel Xeon CPU (E5-2687W, 3.1GHz), 32GB RAM, windows 7 64-bit operation system. The CS programs were not optimized for speed, which can be accelerated significantly if implemented in C++ or on a graphics processing unit (GPU) [20–22].
3.2. Image reconstruction of a B-scan of a mirror surface
We first studied the basic properties of proposed method by reconstructing a B-scan of a mirror surface. The spectral data were under-sampled in both axial and fast scanning lateral directions. As mentioned above, our proposed reconstruction strategy can be used to achieve 2D OCT image reconstruction by only taking the first two steps.
First, we fixed the overall sampling rate to 5%, which can be shown to be too small if under-sampling is implemented only in one dimension. The relative error is computed on CS reconstruction results obtained with various axial sampling rate, which changes from 5% to 100%. The corresponding sampling rate in the fast scanning lateral direction changes from 100% to 5%. The relative error is defined as:
| (2) |
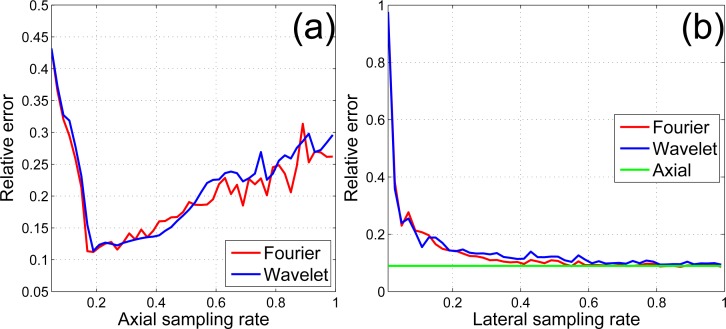
where fCS is the CS reconstruction result; fref is the reference image. Here, we use original image as the reference, which is obtained by applying classical method to 100% spectral measurements. Two different kinds of sparsifying operators were used for CS reconstructions in the fast-scanning lateral direction: the 4-level Daubechies4 wavelet transformation and the Fourier transformation. As can be seen in Fig. 3(a), the relative error is high with small axial sampling rate, although the corresponding sampling rate in the fast scanning lateral direction is 100%. It is because the axial reconstruction result is used as the input data of CS reconstruction in the fast scanning lateral direction. The under-sampling rate in the fast scanning lateral direction is redudant and does not help the overall recontruction. As the axial sampling rate increases, the relative error decreases until it reaches the minimum. It shows that better reconstruction result can be achieved by exploring under-sampling in both dimensions of the B-scan. Then the relative error increases again which implies that the sampling rate in the fast scanning lateral direction becomes too small and the axial sampling rate becomes more than enough. The relative error reaches its minimum with 20% axial sampling rate and 25% lateral sampling rate. Fourier and wavelet transformations show similar performance.
Fig. 3.
(a) relative error vs. axial sampling rate. The overall sampling rate is fixed; (b) relative error vs. lateral sampling rate. The axial sampling rate is fixed.
Figure 3(b) shows the relative error computed on CS reconstruction results obtained using various lateral sampling rate and fixed axial sampling rate (20%). Here, the relative error is computed only on the missing A-scans, i.e. there is no spectral data obtained for these A-scans. The relative error decreases for higher lateral sampling rate and converges to the relative error level of axial CS reconstruction, which is computed on the axial reconstruction results and does not change because of fixed axial sampling rate. Similar conclusion can be drawn from comparison on CS reconstruction results with fixed lateral sampling rate and changing axial sampling rate.
3.3. Image reconstruction of a B-scan of human skin
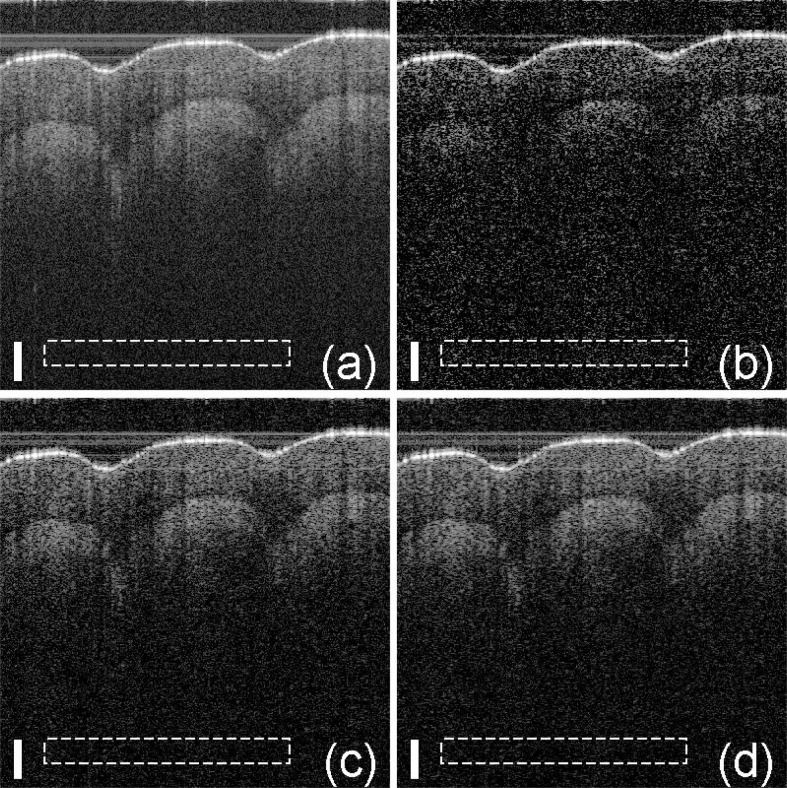
We then evaluated the proposed methods through the reconstruction of a B-scan of human skin. Its spectral data set was under-sampled in both axial and fast-scanning lateral direction. The under-sampling rates in both directions were 50%. Both Fourier transformation and wavelet transformation was tested as the sparsifying operator in the lateral CS reconstruction. The reconstruction results are shown in Figs. 4(c) and 4(d) respectively. The original image obtained using 100% spectral sampling in both directions is displayed in Fig. 4(a) as a reference. The CS reconstruction result obtained using the spectral data under-sampled only in the axial direction is shown in Fig. 4(b) as a comparison. The CS reconstruction for each A-scan in Fig. 4(b) uses 25% of the spectral measurements and the resulting A-scans are concatenated to form the B-scan. Thus, Figs. 4(b)–4(d) use the same amount of under-sampled spectral data. All the images are shown in the same dynamic range.
Fig. 4.
Reconstruction results of human skin. (a) is obtained using 100% spectral data. (b) is obtained using 25% spectral data for each A-scan and no under-sampling is applied in the fast-scanning direction. (c) and (d) are obtained using the proposed method, with the wavelet transformation and Fourier transformation as sparsifying operators, respectively. The under-sampling rates for the axial direction and fast-scanning direction are both 50%. The scale bars represent 100 μm. The image size in pixel is 900×925.
As can be seen from Fig. 4, our proposed method achieved accurate reconstructions that are very similar to the reference image. In contrast, the CS reconstruction using the same amount of spectral data that is under-sampled only in the axial direction shows obvious reconstruction error and information loss, especially for the fine structures at large imaging depths. This is mainly because 25% spectral data is not enough for obtaining an accurate CS reconstruction of an A-scan with complex morphology. Instead, our proposed method takes 50% spectral data for each selected A-scan. Thus these A-scans can be reconstructed with high accuracy. Then the missing A-scans are recovered by CS reconstruction row-by-row using the image data from these accurately recovered A-scans. The under-sampling rate for the input data used in each CS reconstruction of the fast-scanning direction is also 50%, which is usually high enough for an accurate reconstruction. Thus, our proposed method can significantly reduce the overall sampling rate by under-sampling in all dimensions, while achieving a high-quality reconstruction. The peak signal-to-noise ratio (PSNR) is computed for Figs. 4 (a) to 4(d) for a quantitative comparison of the image quality, where PSNR is defined as:
| (3) |
f (x) is the amplitude of the B-scan. var is the variance of the selected background regions that are outlined by the white dashed rectangles in Figs. 4(a)–4(d). The PSNR for Figs. 4(a)–4(d) is 72.60dB, 69.92dB, 75.49dB, and 75.57dB, respectively. Figure 4(c) achieves 2.89dB and 5.57dB better PSNR than Fig. 4(a) and Fig. 4(b), respectively, while the PSNR improvements are 2.97dB and 5.65dB for Fig. 4(d) against Figs. 4(a) and 4(b), respectively. The CS reconstruction tries to enhance the sparsity of the signal in the sparsifying domain while preserving the fidelity of the measurements and has long been recognized to be good at reducing background noise [8–10]. For the same reason, the CS results tend to lose low-intensity features in the sparsifying domain.
3.4. Volumetric image reconstruction
We then evaluated the proposed method using a volumetric OCT image. The tested spectral volume is under-sampled from the fully acquired spectral data in all three dimensions using the proposed sampling pattern. Then the three-step strategy in Sec. 2.3 was applied to the under-sampled spectral data to reconstruct the volumetric image.
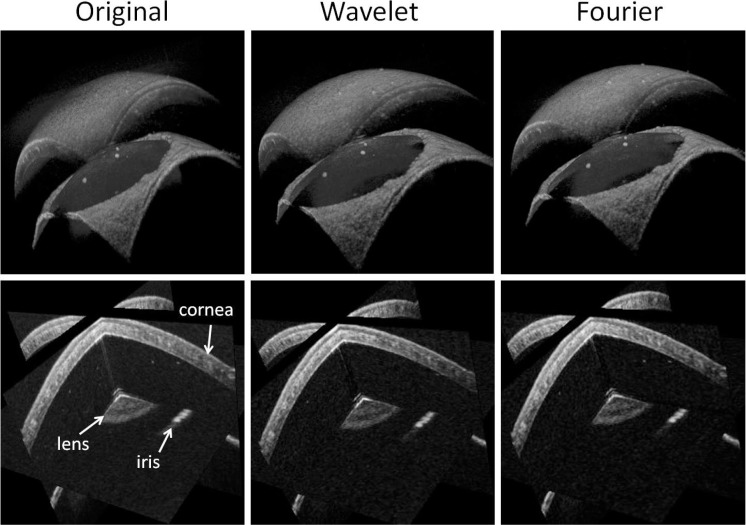
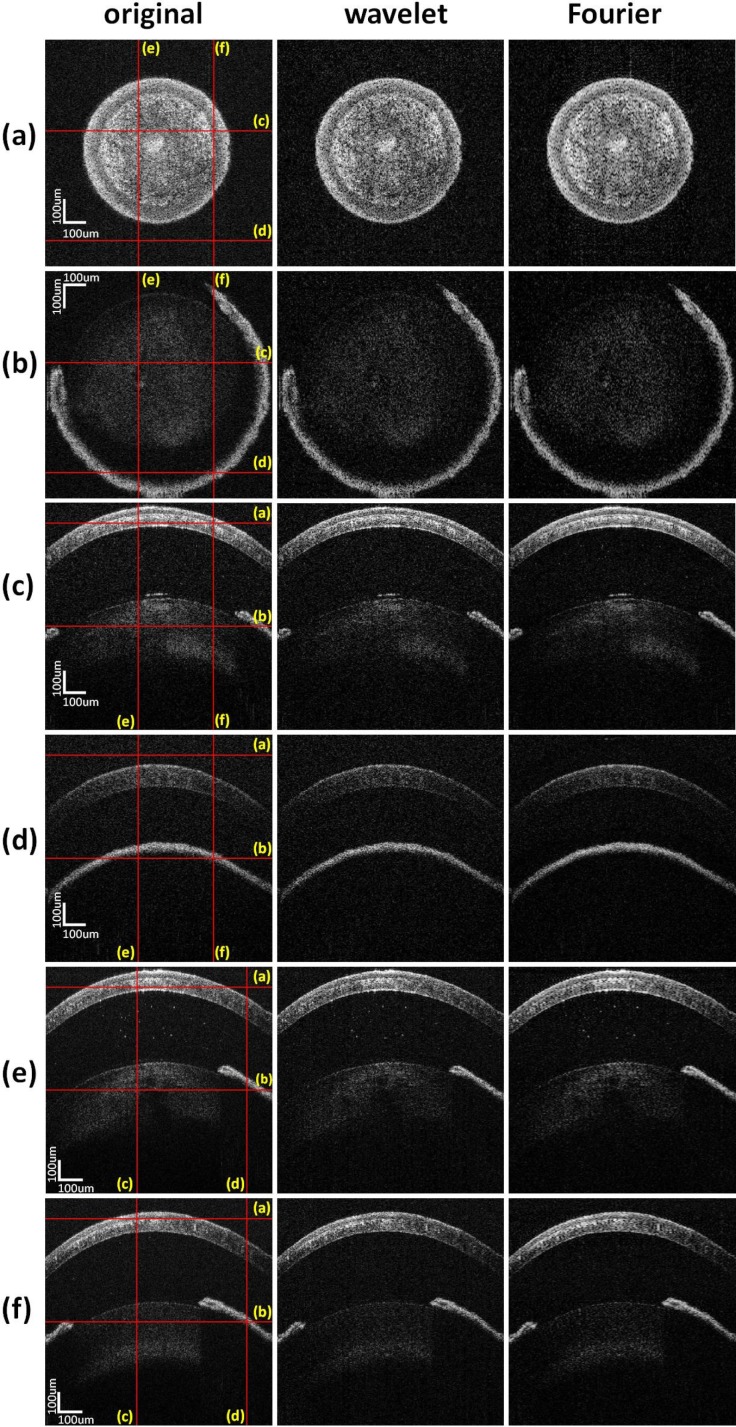
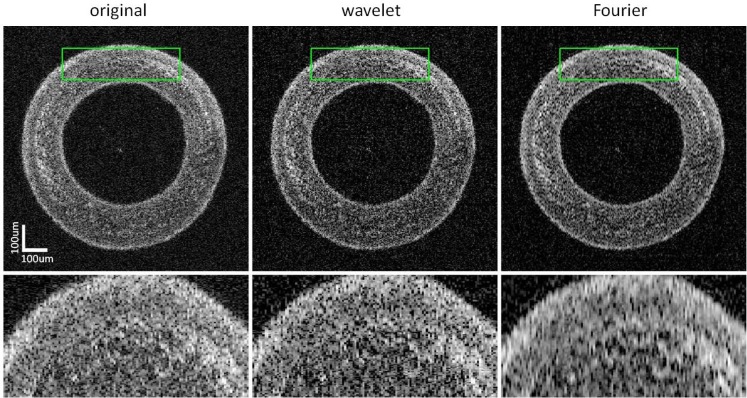
The experiment was implemented using a 3D OCT data set of a mouse cornea. The under-sampling rates of 50%, 60% and 60% are applied to the axial direction, fast-scanning lateral (B-scan) direction and slow-scanning lateral (C-scan) direction of the original 3D spectral volume, respectively. The Fourier transformation and the 4-level Daubechies4 wavelet transformation are tested separately as the sparsifying operator. The same sparsifying operator is used in the second and third steps of the CS reconstructions in one experiment. More specifically, the images in the second columns of Figs. 5, 6 and 7 are obtained with wavelet transformation as the sparsifying operator in both step 2 and step 3 during the reconstruction, while the Fourier transformation is used for reconstructing the images in the third columns of these figures. The reconstructed images are post-processed for volumetric visualization using the free software ImageJ.
Fig. 5.
First row: volumetric visualization by ray-casting; second row: orthogonal cross-sectional display; first column: image obtained with 100% spectral data; second column: image obtained using the proposed method with the wavelet transformation; third column: image obtained using the proposed method with the Fourier transformation.
Fig. 6.
Recovered slices in the reconstructed volumetric images. Rows (a) and (b) are two en-face slices at the position of 160 μm and 800 μm below the surface, respectively. The image size in pixel is 925×250. Rows (c) and (d) are slices in the slow-scanning direction. The image size in pixel is 900×250. Rows (e) and (f) are B-scans in the fast-scanning direction. The image size in pixel is 900×925. The first column is the image obtained using 100% data. The second and third columns are images obtained using the proposed method with the wavelet and the Fourier transformation, respectively.
Fig. 7.
First row: representative slices obtained using 100% spectral measurements (first column) and under-sampled spectral volume using the wavelet transformation (second column) and the Fourier transformation (third column). Second row: zoom-in of the green rectangle areas in the first row.
Figure 5 shows a ray-casting view of the mouse cornea. The sub images in the first row show the isotropic view of the cornea sample and those in the second row are the orthogonal slices display of the volume which show its inner structure. The first column in Fig. 5 presents the original 3D images as a reference that was obtained from 100% spectral measurements. The images in the second column are the CS reconstruction results using wavelet transformation, while those in the third column are the CS reconstruction results using Fourier transformation. As can be seen, CS reconstruction results using both the Fourier transformation and the wavelet transformation are very close to the reference image that uses 100% spectral measurements. The anatomical structures such as cornea, lens, and iris can be clearly visualized and they are marked out in the image.
Figure 6 shows representative slices extracted from the 3D mouse cornea image in different directions. Two slices are selected in each direction. The reference images using 100% spectral measurements are shown in the first column. The positions of selected slices are marked out in the reference images. The slices from 3D image obtained using the wavelet transformation and the Fourier transformation are shown in the second and third column, respectively. To demonstrate that proposed method can recover the missing image data, the slices in both lateral directions shown in Fig. 6 are from the under-sampled missing data, i.e. there is no spectral data obtained for these slices and they are recovered by proposed reconstruction method. As can be seen, the missing image data are reconstructed with high accuracy which is nearly indistinguishable from the original image using 100% of the spectral volume.
One representative en-face slice of the reconstruction result is shown in Fig. 7 to closely examine the images obtained using different spasifying operators: the wavelet transformation and the Fourier transformation. The green rectangle areas in the first row of Fig. 7 are magnified in the second row. As can be seen, the difference between the results obtained using Fourier transformation and wavelet transformation is small. The wavelet transformation result achieves a better overall image quality with a sharper structure, while the Fourier transformation result exhibits a smoothed image. The smoothness is mainly because the signal in the Fourier domain has low intensity at high frequency positions, which tend to get suppressed by the sparisty enhancement during CS reconstruction. This process is similar to that of a low-pass filtering. Based on our experience, the wavelet transformation usually achieves a better image quality. However, the Fourier transformation offers a better balance in terms of achieving high image quality and fast reconstruction speed since a fast implementation through the fast Fourier transformation (FFT) is available. The quantitative evaluation of different sparsifying transformations is still under-study.
4. Discussion
In the proposed three-step reconstruction strategy, the order of the second and the third step can be interchanged, since the CS reconstructions in each step uses only 1D input data and there is no overlap between the input and output data of these two steps. These two steps are independent of each other. Therefore, the change of their order does not alter the reconstruction result as long as an accurate reconstruction can be achieved in each step.
In the second step of proposed reconstruction strategy, the CS reconstruction only needs to be applied to half of the rows of each selected B-scans (rows here indicate the 1D image data in the fast-scanning lateral direction), since in regular SD OCT, only the first half of the B-scan will be displayed. This is also true for the third step of the reconstruction strategy: only the first half (i.e. top half in Fig. 2) of the volumetric image data needs to be reconstructed. In addition, the number of the rows that needs to be incorporated in step 2 can even be reduced further for the samples having small imaging depth. Reducing the row number will save the reconstruction time and alleviate the system memory required.
Our proposed reconstruction strategy applies 1D CS reconstruction separately to the volumetric data in each direction: in step 1, it is applied to the under-sampled spectral data of each chosen A-scan of the selected B-scan; in step 2, it is applied to each row of the selected B-scan; in step 3, it is applied to each row in the slow-scanning lateral direction of the 3D image. Although 3D transformation has also been used in the CS reconstruction of volumetric OCT image [15–17], there are several benefits for our decomposition-based strategy:
-
(1)
It is very easy to change parameters when reconstructing various data with different sparsity and noise level. Usually, a bigger ε is desired when reconstructing the rows corresponding to small imaging depths to reduce the noise, while a smaller ε is needed for those with large imaging depths to preserve the low-intensity features. It also provides the developer more choices when tuning the parameters in reconstructing the OCT data with complex morphology.
-
(2)
It saves the memory needed during the reconstruction. For instance, the full volumetric image used in the experiments has 2048×1000×250 voxels. The data size is approximately 3.81 GB assuming the data type is double (default data type in MATLAB). It is even bigger (7.63GB) when the Fourier transformation is used because the data type comes to complex double. Usually, more than one copy of the volumetric data is stored in the RAM during the CS reconstruction to represent the interim data for the transformation between the sparsity domain and the image domain or between the measurement domain and the spatial domain. Using 3D transformation will place a high burden on the memory usage. This situation will deteriorate when implementing the acceleration using GPU, since most GPUs do not have enough on-chip memory to hold more than one such big array. Complicated data decomposition is necessary if 3D transformation is used. In comparison, assuming the under-sampling rate is 50% in all dimensions and data type double, the 3D CS OCT data size in the proposed method is 954 MB in step 1 and step 2, 1.91GB in step 3. These numbers are doubled assuming the data type is complex double with the same under-sampling rate. It can be seen that our algorithm requires less memory. In addition, all the CS reconstructions in our algorithms use 1D under-sampled data. Thus, the size of interim data is very small. Our algorithm can be easily implemented on most regular GPUs.
-
(3)
It is easier to implement the GPU acceleration using proposed CS reconstruction method. Besides the memory advantage mentioned above, it is straightforward to accelerate the computation by applying data decomposition to the volumetric data since the 1D CS reconstructions in each step are independent of each other. A large number of 1D CS reconstructions can be executed simultaneously, given that the memory of the GPU is not used up. GPU favors a big number of simple computations, instead of a small number of complex computations. We can also use more than one GPU to achieve bigger acceleration. Examples of accelerating multiple independent CS reconstructions of SD OCT data on a triple-GPUs architecture can be found in [20–22].
CS tries to maximize the sparsity of the signal in the sparsifying domain. Higher sparsity indicates that more signal tend to be zero or close to zero. Thus CS has been shown to be good at reducing the background noise. For the same reason, it usually results in the loss of low-intensity features. For the Fourier transformation case, this will smooth the image while the reconstruction result using wavelet transformation often loses low-intensity image details outright.
Many literatures have reported accurate CS reconstruction of an A-scan using 40%–50% spectral data [8, 10, 11, 14, 20, 21]. In addition, the literatures [15–17] demonstrate volumetric CS reconstruction from a high percentage of missing data in one or both of the lateral directions. However, we found that the under-sampling rate cannot be too small for all three directions. In other words, we have not noticed satisfied reconstruction result when applying the proposed method to spectral volume with less than 50% under-sampling rate in all three directions. The main problem is the loss of low-intensity features and details in the spasifying domain. There are mainly two reasons for this: first, CS reconstruction tends to lose low-intensity features as mentioned earlier. Recovering these low-intensity features accurately requires a very high sampling rate. Reducing the sampling rate will do more harm to low-intensity features than those high-intensity ones. Secondly, the proposed method uses three round of CS reconstruction that will also jeopardize low-intensity features in the sparsifying domain. It will require accurate enough reconstruction in every round of CS reconstruction to preserve these low-intensity features.
Bigger sampling rate results in better image quality but increases the size of the spectral measurements as well as the data acquisition time. The optimal value of sampling rate for each direction is case-specific. Based on our experiences so far, setting each of them to 50%–60% is usually enough to guarantee a high quality reconstruction.
Since the CS reconstruction results in axial direction (step 1) is used as input data for CS reconstructions in lateral directions (step 2 and 3), its accuracy determines the minimum error in lateral directions. As can be seen from Fig. 3(b), the relative error converges to the relative error level of the axial CS reconstruction as the lateral sampling rate increases. CS reconstruction in lateral direction introduces more error with smaller lateral sampling rate.
Another interesting observation is that in Fig. 3(a), given a fixed overall sampling rate, a small axial sampling rate results in a bigger relative error than the same lateral sampling rate. For example, 5% axial and 100% lateral sampling rate results in a bigger error than 100% axial and 5% lateral sampling rate. Thus, it is more worthy to implement CS method in the lateral directions, given a limited computational resource.
5. Conclusions
In summary, we described high-quality volumetric SD OCT image reconstruction from significantly reduced spectral data which is obtained by under-sampling in all three dimensions of the original spectral volume. The reconstruction is implemented by applying 1D CS reconstruction dimension-by-dimension to the under-sampled spectral volume. Our method can reduce the overall sampling rate to less than 20% and can be easily adapted to the reconstruction of any 2D and 3D CS OCT imaging.
Acknowledgments
This work was supported in part by an NIH grant 1R01EY021540-01A1.
References and links
- 1.Adler D.C., Chen Y., Huber R., Schmitt J., Connolly J., Fujimoto J.G., “Three-dimensional endomiscroscopy using optical coherence tomography,” Nat. Med. 12(12), 1429–1433 (2007). [Google Scholar]
- 2.Wojtkowski M., Srinivasan V., Fujimoto J.G., Ko T., Schuman J.S., Kowalczyk A., Duker J.S., “Three-dimensional retinal imaging with high-speed ultrahigh-resolution optical coherence tomography,” Ophthalmology 112(10), 1734–1746 (2005). 10.1016/j.ophtha.2005.05.023 [DOI] [PMC free article] [PubMed] [Google Scholar]
- 3.Schmoll T., Kolbitsch C., Leitgeb R.A., “Ultra-high-speed volumetric tomography of human retinal blood flow,” Opt. Express 17(5), 4166–4176 (2009). 10.1364/OE.17.004166 [DOI] [PubMed] [Google Scholar]
- 4.Gargesha M., Jenkins M.W., Rollins A.M., Wilson D.L., “Denoising and 4D visualization of OCT images,” Opt. Express 16(16), 12313–12333 (2008). 10.1364/OE.16.012313 [DOI] [PMC free article] [PubMed] [Google Scholar]
- 5.Wieser W., Biedermann B.R., Klein T., Eigenwillig C.M., Huber R., “Multi-megahertz OCT: high quality 3D imaging at 20 million A-scans and 4.5 GVoxels per second,” Opt. Express 18(14), 14685–14704 (2010). 10.1364/OE.18.014685 [DOI] [PubMed] [Google Scholar]
- 6.Donoho D.L., Compressed sensing,” IEEE Trans. Inf. Theory 52(4), 1289–1306 (2006). 10.1109/TIT.2006.871582 [DOI] [Google Scholar]
- 7.Candes E.J., Romberg J., Tao T., “Robust uncertainty principles: exact signal reconstruction from highly incomplete frequency information,” IEEE Trans. Inf. Theory 52(2), 489–509 (2006). 10.1109/TIT.2005.862083 [DOI] [Google Scholar]
- 8.Liu X., Kang J.U., Compressive SD-OCT: the application of compressed sensing in spectral domain optical coherence tomography,” Opt. Express 18(21), 22010–22019 (2010). 10.1364/OE.18.022010 [DOI] [PMC free article] [PubMed] [Google Scholar]
- 9.Fang L., Li S., Nie Q., Izatt J.A., Toth C.A., Farsiu S., Sparsity based denoising of spectral domain optical coherence tomography images,” Biomed. Opt. Express 3(5), 927–942 (2012). 10.1364/BOE.3.000927 [DOI] [PMC free article] [PubMed] [Google Scholar]
- 10.Xu D., Vaswani N., Huang Y., Kang J.U., Modified compressive sensing optical coherence tomography with noise reducetion,” Opt. Lett. 37(20), 4209–4211(2012). 10.1364/OL.37.004209 [DOI] [PMC free article] [PubMed] [Google Scholar]
- 11.Zhang N., Huo T., Wang C., Chen T., Zheng J., Xue P., “Compressed sensing with linear-in-wavenumber sampling in spectral domain optical coherence tomography,” Opt. Lett. 37(15), 3075–3077 (2012). 10.1364/OL.37.003075 [DOI] [PubMed] [Google Scholar]
- 12.Liu C., Wong A., Bizheva K., Fieguth P., Bie H., Homotopic, non-local sparse reconstruction of optical coherence tomography imagery,” Opt. Express 20(9), 10200–10211 (2012). 10.1364/OE.20.010200 [DOI] [PubMed] [Google Scholar]
- 13.Schwartz S., Liu C., Wong A., Clausi D.A., Fieguth P., Bizheva K., “Energy-guided learning approach to compressive sensing,” Opt. Express 21(1), 329–344 (2013). 10.1364/OE.21.000329 [DOI] [PubMed] [Google Scholar]
- 14.Xu D., Huang Y., Kang J.U., “Compressive sensing with dispersion compensation on non-linear wavenumber sampled spectral domain optical coherence tomography,” Biomed. Opt. Express 4(9), 1519–1532 (2013). 10.1364/BOE.4.001519 [DOI] [PMC free article] [PubMed] [Google Scholar]
- 15.Young M., Lebed E., Jian Y., Mackenzie P.J., Beg M.F., Sarunic M.V., “Real-time high-speed volumetric imaging using compressive sampling optical coherence tomography,” Biomed. Opt. Express 2(9), 2690–2697 (2011). 10.1364/BOE.2.002690 [DOI] [PMC free article] [PubMed] [Google Scholar]
- 16.Lebed E., Mackenzie P.J., Sarunic M.V., Beg M.F., “Rapid volumetric OCT image acquisition using compressive sampling,” Opt. Express 18(20), 21003–21012 (2010). 10.1364/OE.18.021003 [DOI] [PubMed] [Google Scholar]
- 17.Lebed E., Lee S., Sarunic M.V., Beg M.F., “Rapid radial optical coherence tomography image acquisition,” J. BioMed. Opt. 18(3), 036004 (2013). 10.1117/1.JBO.18.3.036004 [DOI] [PubMed] [Google Scholar]
- 18.Yang J., Zhang Y., “Alternating direction algorithms for L1-problem in compressive sensing,” SIAM J. on Scientific Computing 33(1–2), 250–278 (2011). 10.1137/090777761 [DOI] [Google Scholar]
- 19.Xu D., Huang Y., Kang J.U., “Assessment of robust reconstruction algorithms for compressive sensing spectral-domain optical coherence tomography,” Proc. SPIE 8589, 85890C (2013). 10.1117/12.2002476 [DOI] [Google Scholar]
- 20.Xu D., Huang Y., Kang J.U., “Real-time compressive sensing spectral domain optical coherence tomography,” Opt. Lett. 39(1), 76–79 (2014). 10.1364/OL.39.000076 [DOI] [PMC free article] [PubMed] [Google Scholar]
- 21.Xu D., Huang Y., Kang J.U., “GPU-accelerated non-uniform fast Fourier transform-based compressive sensing spectral domain optical coherence tomography,” Opt. Express 22(12), 14871–14884 (2014). 10.1364/OE.22.014871 [DOI] [PMC free article] [PubMed] [Google Scholar]
- 22.Xu D., Huang Y., Kang J.U., “Real-time dispersion-compensated image reconstruction for compressive sensing spectral domain optical coherence tomography,” J. Opt. Soc. Am. 31(9), 2064–2069 (2014). 10.1364/JOSAA.31.002064 [DOI] [PubMed] [Google Scholar]


