

Abstract
• Background and Aims The influence of initial residual leaf area and initial N reserves on N uptake, final N distribution, and yield in alfalfa regrowing after cutting, were studied.
• Methods The effects of two levels of initial residual leaf area (plants cut to 15 cm, with (L+) or without (L−) their leaves) and two initial levels of N status [high N (HN) or low N (LN)] on growth, N uptake and N partitioning, allocation and storage after 29 d of post-cutting regrowth were analysed.
• Key Results During most of the regrowth period (8–29 d after the initial harvest), HN and L+ plants had higher net N uptake rates than LN and L− plants, respectively, resulting in a greater final mineral N uptake for these treatments. However, the final partitioning of exogenous N to the regrowing shoots was the same for all treatments (67 % of total exogenous N on average). Final shoot growth, total plant N content, and N allocation to the different taproot N pools were significantly lower in plants with reduced initial leaf area and initial N reserve status.
• Conclusions Although both initial residual leaf area and initial N reserves influenced alfalfa regrowth, the residual leaf area had a greater effect on final forage production and N composition in the taproot, whereas the N uptake rate and final total N content in plant were more affected by the initial N reserve status than by the residual leaf area. Moreover, N storage as proteins (especially as vegetative storage proteins, rather than nitrate or amino acids) in the taproot allowed nitrate uptake to occur at significant rates. This suggests that protein storage is not only a means of sequestering N in a tissue for further mobilization, utilization for growth or tissue maintenance, but may also indirectly influence both N acquisition and reduction capacities.
Key words: Medicago sativa, defoliation, leaf area, regrowth, N uptake, N reserves, vegetative storage proteins
INTRODUCTION
Alfalfa (Medicago sativa) is a perennial forage legume, commonly subjected to repeated cycles of defoliation and regrowth that are agronomically characterized by cutting frequency (determined by the regrowth period between two successive harvests) and cutting intensity (determined by the cutting height). At the whole plant level, each of these parameters affects C and N organic reserve levels in the remaining organs (roots and crown), and alters both plant morphogenesis and residual leaf area during regrowth (Richards, 1993; Lemaire, 2001). However, although cutting frequency has long been recognized as a critical factor for long-term alfalfa management (Hodgkinson, 1969; Constable et al., 1977; Gramshaw et al., 1993), several studies have shown that the short-term effects of defoliation are also of great importance for yield and management of perenniality. These immediate effects depend mainly on the cutting intensity which, through the more or less severe removal of leaf and stem tissues, results in a loss of meristematic tissue, a reduction of whole plant photosynthesis, and a transient reduction of phloem and xylem fluxes through the respective decrease of phloem loading activity and evapotranspiration (Richards, 1993). Cutting also induces a transient decrease in N uptake until carbon supply to the roots is restored through new leaf area expansion and increased photosynthetic capacity (Lemaire and Millard, 1999). Symbiotic N2 fixation (Vance and Heichel, 1981; Kim et al., 1993), as well as ammonium and nitrate uptake (Ourry et al., 1994), are thus severely reduced during early regrowth after defoliation. For example, Vance and Heichel (1981) reported that the addition of 40 or 80 kg ha−1 nitrate fertilizer immediately after defoliation had no effect on the rate of shoot regrowth in alfalfa plants. Rapid recovery from defoliation, therefore, requires the mobilization of endogenous C and N reserves in perennial organs such as roots and crowns (Hodgkinson, 1969). Moreover, it is now well established that, in alfalfa, endogenous N pools are largely used to support regrowth (Ourry et al., 1994; Avice et al., 1996a; Barber et al., 1996), whereas endogenous C pools are mainly used to support the respiration of the remaining plant organs (Ta et al., 1990; Avice et al., 1996a). For example, 13C and 15N labelling studies have shown that 80 % of N, but only 6 % of C, in growing shoots of defoliated alfalfa had been mobilized from root and crown reserves 8 d after cutting, whereas about 40 % of initial C had been used for root respiration (Avice et al., 1996a).
Several studies have focused on the particular role of N reserves in alfalfa productivity, quality and persistency. In the taproot, which is the main storage organ of alfalfa, amino acids and soluble proteins represent the largest soluble N fractions (Hendershot and Volenec, 1993b). Four vegetative storage proteins (VSPs) (15, 17, 32 and 57 kD) have been identified in the soluble protein N pool in taproots (Hendershot and Volenec, 1993a; Avice et al., 1996b; Gana et al., 1998) and the rate of regeneration of new photosynthetic tissues has been linearly related to taproot VSP concentration on the day of cutting (Avice et al., 1996a). It appears that the accumulation of VSP can be indirectly affected by changes in source–sink relationships in relation to N within the plant (Staswick, 1994; Ourry et al., 2001), or directly by exogenous stimuli such as methyl-jasmonate (Noquet et al., 2001; Meuriot et al., 2004) or modifications of soil N availability. For example, recent studies have shown that non-nodulated alfalfa was able to store N reserves as VSP even when mineral N supply decreased from 1000 to 50 µm NH4N03 (Meuriot et al., 2003).
These results show that initial taproot N reserves, and particularly VSP, are of great importance during early shoot regrowth in alfalfa. Because the re-accumulation of N reserves starts only 10–15 d after harvest in alfalfa (Avice et al., 1996a), the cutting frequency can influence the level of N storage directly and, as a consequence, affect shoot yield. For example, an increase in cutting frequency led to a decrease in N reserve accumulation (Avice et al., 1997), and also a modified shoot morphology (development of more leaves and stems below the level of cutting), according to the ‘defoliation avoidance’ strategy described by Briske (1996). This mechanism also interacts with the cutting intensity.
The initial quantity of stored N and residual leaf area are both affected by the cutting management (frequency or intensity) and have important implications for regrowth potential, but their individual effects on forage yield and the perenniality of alfalfa stands have not been clearly separated. To determine the particular effects of these two parameters, the regrowth of plants differing only in their initial N reserve level (and not by their remaining shoot structure), and by their initial leaf area levels (same cutting height and remaining plant structure) were studied. This work focused on the individual and combined effects of these two parameters on biomass production and partitioning, N uptake kinetics, N allocation between the different organs, and N reserve formation in the taproot during a single cycle of defoliation and regrowth.
MATERIALS AND METHODS
Plant material
Seeds of alfalfa (Medicago sativa L. ‘Lodi’) were germinated in containers of sand in January 1999. When the primary trifoliate leaves appeared, the seedlings were transplanted into plastic pots filled with sand to establish well-developed taproots. To repress nodule formation, the plants were irrigated three times each week with 300 mL of a full nutrient solution obtained by the addition of 2 mm NH4NO3 to a basic nutrient solution. This basic nutrient solution contained: in mm, 0·4 KH2PO4, 1·0 K2SO4, 3·0 CaCl2, 0·5 MgSO4, 0·15 K2HPO4, 0·2 Fe-Na EDTA; and, in µm, 14·0 H3BO3, 5·0 MnSO4, 3·0 ZnSO4, 0·7 CuSO4, 0·7 (NH4)6Mo7O24 and 0·1 CoCl2 (Kim et al., 1991). The plants were grown under glasshouse conditions (Fig. 1) at 20 °C (day) and 18 °C (night) and with a photoperiod of 16 h (day) and 8 h (night). Natural light was supplemented with Neon tubes (Philips TLD 36W) supplying an average PAR (photosynthetic active radiation) of 150 ± 20 µmoles photons m−2 s−1 at canopy height. After 105 d, the plants were cut at 6 cm above the level of crown (i.e. 6 cm cutting height) and were transferred to 8-L plastic containers of continuously aerated nutrient solution under hydroponic conditions (Fig. 1). These containers (four plants per container) were placed in a growth chamber with the same controlled growth conditions, except for light which was now provided by high pressure sodium lamps (Phytoclaude 400 W) supplying an average PAR of 400 ± 30 µmoles photons m−2 s−1 at canopy height. During the first 15 d of regrowth (Fig. 1), plants were supplied with a basic nutrient solution containing 1 mm NH4NO3 (renewed every 3 d). Thereafter, plants were submitted to two different levels of N availability as described below.
Fig. 1.

Schematic description of the experimental protocol. The different N supplies (HN or LN) were applied during the 21 d before the day of cutting (Day 0). The different residual leaf area levels (L+ and L−) were measured on the day of cutting (Day 0).
Application of different N supplies and residual leaf area treatments
Previous results (Kim et al., 1993; Avice et al., 1996b) have shown that alfalfa regrowth is characterized by two different phases. During the first 2 weeks following shoot removal, there is an extensive mobilization of taproot organic N reserves (and especially VSPs). After this period of regrowth, soluble proteins, as well as VSPs, slowly reaccumulate, but taproot N reserves are quantitatively and qualitatively modified by the NH4NO3 concentration in the nutrient solution (Meuriot et al., 2003). Accordingly, in this experiment, after the first 15 d of regrowth, two different levels of N supply were applied for 21 d so as to produce plants with contrasting taproot N reserves (Fig. 1). During this 21-d period (in the phase of N reserve re-accumulation), half of the plants received 1 mm of NH4NO3 in the nutrient solution. The depletion of NH4NO3 in the nutrient solution was measured daily so that N uptake could be determined, and NH4NO3 was added directly to the nutrient solution to compensate for daily N uptake (control plants corresponding to treatment HN). The remaining plants (treatment LN) received only 25 % of the NH4NO3 daily taken up by the control plants (HN). During the 21 d of treatment, the nutrient solution was renewed at intervals of 3 d.
After 21 d of contrasting N treatments (Day 0, corresponding to the first day of the experiment; Fig. 1), the plants were cut at 15 cm above the crown (i.e. 15 cm cutting height) to give two contrasting levels of defoliation: L+, plants retaining all their leaves between 0 and 15 cm, and L−, totally defoliated plants (between 0 and 15 cm). Cutting at 15 cm was necessary to produce clearly contrasting plant leaf areas. Plants of all treatments (HNL+, HNL−, LNL+ and LNL−) were then arranged according to a randomized complete block design in the growth chamber and were supplied during the 29 d of regrowth with a basic nutrient solution containing 1 mm of 15NH415NO3 labelled with 2·5 atom% 15N excess to permit the study of N partitioning during regrowth (Fig. 1).
Tissue sampling
Plants were harvested on the day of defoliation (Day 0) and 29 d after defoliation (Day 29). The root systems were carefully washed with cold demineralized water to remove any NH4NO3 nutrient solution. Harvested plants were separated into lateral roots, taproots, remaining leaves and stems in the crown (i.e. leaves and stems present on the day of defoliation), and regrowing leaves and stems. The fresh weight of each sample was determined and the leaf area of the remaining and regrowing leaves was also measured immediately after harvest using a LI-3100 area meter (LI-COR, Lincoln, NB, USA). Root samples were frozen in liquid N2. After freeze-drying, root samples were ground to fine powder and kept at −20 °C for further N analysis. Shoot tissues were dried at 70 °C for 72 h, ground to fine powder, and stored under vacuum with desiccant for further N analysis.
Analysis of taproot N pools at defoliation and after 29 d of regrowth
Extraction of the different taproot N pools (insoluble N, nitrate, amino acids plus peptides and soluble proteins) was performed according to Barber et al. (1996) and Meuriot et al. (2003). Briefly, N pools were extracted twice from 300 mg of ground, freeze-dried taproot, with 5 mL of 100 mm sodium-phosphate buffer (pH 7·0). Tissue suspensions were vortexed four times for 1 min at 5-min intervals and centrifuged at 10 000 g for 15 min (4 °C). The resulting pellets represented the buffer-insoluble-N fraction. An aliquot of the resulting supernatant was used for soluble protein measurement by protein dye-binding (Bradford, 1976) and VSP quantification by an ELISA method (Noquet et al., 2001).
Three millilitres of the resulting supernatants were also precipitated using the TCA (trichloroacetic acid) protocol described by Peterson (1983). After centrifugation (10 000 g, 10 min, 4 °C), the pellet represented the buffer-soluble-protein-N fraction (including VSP), whereas the buffer-soluble N that remained dissolved in TCA was defined as the low molecular weight N fraction (mainly containing peptides, amino acids and nitrate). The nitrate concentration of the low molecular weight N fraction was determined by the sulfanilamide method, after reduction to nitrite using a continuous-flow autoanalyser (Bran+Luebbe, Noderstedt, Germany). The pool of amino acids plus peptides was deduced by subtraction of nitrate from the total low molecular weight N fraction. Except for nitrate, N concentrations in the different taproot N fractions were determined using an isotope ratio mass spectrometer (Roboprep CN and mass spectrometer; PDZ Europa Scientific, Crewe, UK).
N uptake during post-cutting regrowth
The amounts of NH4+ and NO3− taken up by plants were calculated daily from their depletion in the nutrient solution, measured in 1 mL of nutrient solution by high performance anionic (Ionpac AS9 analytical column) and cationic (Ionpac CS12 analytical column) chromatography (HPLC, DX100, Dionex Corp., Sunnyvale, CA, USA), respectively. The data were expressed as net N uptake per plant (Fig. 4). The rate of net N uptake (mean value obtained by the difference of total N uptake between two dates) was calculated for five regrowth periods (Table 1).
Fig. 4.

Kinetics of net N uptake into alfalfa plants during regrowth after defoliation for HN and LN pretreatments and/or L+ and L− treatments. The values are means ± s.e. (when larger than the symbol) for n = 3.
Table 1.
Kinetics of net uptake of N by alfalfa plants during five successive phases of post-cutting regrowth
| N uptake (mg N plant−1 day−1) |
|||||||
|---|---|---|---|---|---|---|---|
| Post-cutting regrowth intervals |
HNL+ |
HNL− |
LNL+ |
LNL− |
|||
| 0–3 d | 12·07 ± 0·26b | 5·83 ± 0·06a | 26·31 ± 0·31d | 15·55 ± 0·68c | |||
| 3–8 d | 6·26 ± 0·02c | 2·54 ± 0·06a | 6·13 ± 0·16c | 3·11 ± 0·35b | |||
| 8–13 d | 12·27 ± 0·27c | 14·75 ± 0·04d | 4·84 ± 0·05b | 3·90 ± 0·30a | |||
| 13–21 d | 25·80 ± 3·58c | 27·63 ± 1·68c | 19·74 ± 2·10b | 16·39 ± 0·76a | |||
| 21–29 d | 51·96 ± 4·41c | 37·52 ± 1·58b | 34·35 ± 3·56b | 26·37 ± 0·20a | |||
Values represent means ± s.e. for n = 3.
Values within rows without a common letter (a, b, c or d) are significantly different, according to Newman and Keuls' test, at P < 0·05.
Calculation of N partitioning in plants
During regrowth (Day 0 to Day 29), the experiment was conducted using a nutrient solution containing 1 mm 15NH415NO3 (with 2·5 atom% 15N excess). N content and 15N abundance in all organs, and N fractions were measured in continuous flow using a C/N analyser linked to an isotope ratio mass spectrometer (IRMS) (Roboprep CN and mass spectrometer, PDZ Europa Scientific). Natural 15N abundance (0·3663 % ± 0·0004) of atmospheric N2 was used as reference for 15N analysis. The abundance of 15N in the different organs was used to determine the allocation of N derived from the mineral N taken up during the experiment as described previously (Avice et al., 1996a; Meuriot et al., 2003).
The atom% 15N excess E(%) in a given organ was calculated using the equation:
 |
where A(%) is the organ 15N abundance by spectrometry.
The nitrogen in a given organ derived from uptake (exogenous N; NExo) was then calculated by:
 |
where NT is total nitrogen in the organ (mg plant−1) and ES the nutrient solution atom% 15N excess (2·5 %).
To determine the relative partitioning of NExo (Table 2) within the plant, the results are expressed as percentage of total NExo for each organ after 29 d of regrowth. The different taproot N fractions (Figs 3 and 6) are expressed as percent of taproot total N content.
Table 2.
Total N, total exogenous N, and allocation of exogenous N within alfalfa plants after 29 d of post-cutting regrowth
| Allocation of total exogenous N within the plant (% of total exogenous N) |
|||||||||
|---|---|---|---|---|---|---|---|---|---|
| Total N (mg N plant−1) |
Total exogenous N (mg N plant−1) |
Regrowing shoots |
Remaining shoots |
Taproot |
Lateral roots |
||||
| HNL+ | 305·61 ± 16·83c | 187·73 ± 28·82c | 65·75 ± 4·29a | 5·68 ± 0·44a | 10·12 ± 0·32c | 18·45 ± 2·62b | |||
| HNL− | 254·22 ± 27·40b | 156·28 ± 35·61bc | 68·43 ± 5·78a | 5·07 ± 0·15a | 6·95 ± 0·12a | 19·55 ± 2·01b | |||
| LNL+ | 235·41 ± 8·89b | 141·62 ± 16·66 b | 71·46 ± 6·18a | 7·99 ± 0·96b | 9·03 ± 0·49b | 11·52 ± 1·99a | |||
| LNL− | 164·71 ± 14·35a | 105·94 ± 13·64a | 65·40 ± 3·67a | 4·99 ± 0·43a | 10·25 ± 0·09c | 19·36 ± 2·31b | |||
Total N and total exogenous N values are means ± s.e. for n = 3.
Exogenous N allocation values are given as percentage ± s.e. of total exogenous N per plant for n = 3.
Values within columns without a common letter (a, b, bc, or c) are significantly different, according to Newman and Keuls' test at P < 0·05.
Fig. 3.
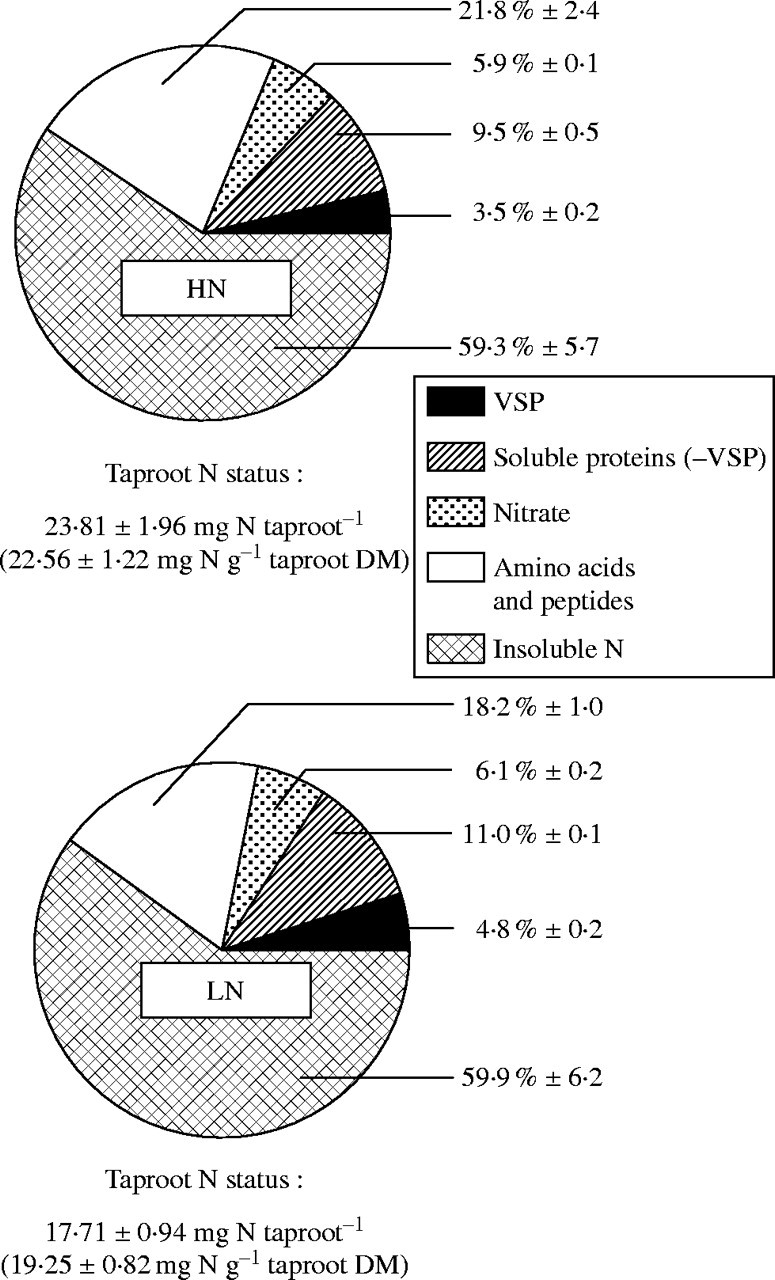
Taproot N status and N allocation among insoluble N, amino acids and peptides, nitrate, soluble protein and VSP N pools on the day of cutting (Day 0) of alfalfa plants previously supplied with optimal (HN) or sub-optimal (LN) mineral N supplies for 21 d. Values in brackets represent means ± s.e. of taproot N content. N allocation values are given as mean percentages of taproot total N ± s.e for n = 3.
Fig. 6.
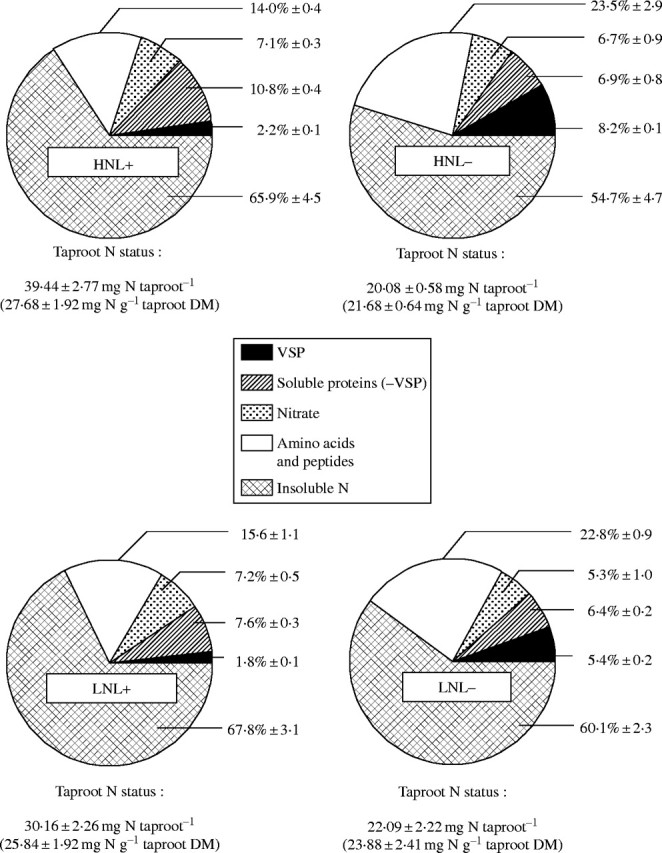
Final N contents and N allocation among insoluble N, amino acids and peptides, nitrate, soluble protein and VSP pools in alfalfa taproots under HN and LN pretreatments and L+ and L− treatments at the end of the experiment (Day 29). Values in brackets represent means of taproot N content ± s.e. for n = 3. N allocation values are given as mean percentages of taproot total N amounts ± s.e. for n = 3.
Statistical analysis
The experiments were performed with three replicates (each replicate containing four plants). Results represented the mean ± s.e. for n = 3. The effects of the different treatments were studied by comparing the means using a t-test. For the data in Tables 1 and 2, Newman and Keuls' tests were used for comparisons of means using the Stat-ITCF software (Stat ITCF, v. 5.1, 1987; Institut Technique des Céréales et des Fourrages, Paris, France).
RESULTS
Biomass and morphological status on the day of cutting (Day 0)
By Day 0 the reduced N supply during the previous 21 d (LN− plants) had resulted in a reduction in plant dry matter by 32 % (Fig. 2A), compared with HN plants. Stem dry weight, which accounted for approx. 38 % of total dry matter under each treatment at Day 0, was much higher in HN plants (1·6 ± 0·23 g plant−1) than LN plants (0·9 ± 0·16 g plant−1). Lateral root dry weight was also significantly higher in HN compared with LN plants. Nevertheless, the main determining morphological traits for post-cutting regrowth such as taproot dry matter, residual leaf area and the number of remaining leaves, were not significantly different between LN and HN plants (Fig. 2). Leaf dry weight, number of buds and stems (Fig. 2), and shoot/root dry matter ratio (P > 0·071; Fig. 2A) were also not significantly affected by nitrogen supply.
Fig. 2.

Total dry matter of lateral roots, taproot, remaining stems and leaves (A) and initial residual leaf area, numbers of leaves, stems and buds per plant (B) on the day of cutting (Day 0) of alfalfa plants previously supplied with optimal (HN) or sub-optimal (LN) mineral N supplies for 21 d. Values in brackets represent means ± s.e. of the shoot to root dry matter ratio. Vertical bars indicate ± s.e. of the mean for n = 3 when larger than the symbol.
Taproot N reserves on the day of cutting (Day 0)
Because taproot N status is of particular importance during early regrowth, both taproot N status and taproot N reserve compounds were studied on Day 0 (Fig. 3). Reduced N supply caused a significant decrease in the total amount and concentration of N in the taproot (by 25 % and 15 %, respectively). However, the reduced supply of N did not lead to a significant change in the proportions of insoluble and soluble N fractions, which represented approx. 60 and 40 % of taproot total N in each N pre-treatment (Fig. 3). In absolute terms (mg N taproot−1), the initial soluble N reserve compounds (nitrate, amino acids plus peptides, soluble proteins and VSP) were higher in plants previously supplied with high levels of mineral N. Nevertheless, when compared with HN plants, the reduction of mineral N supply caused only slight differences in N allocation among the different soluble N pools. For example, the total soluble protein N pool (including VSP) represented 13 ± 0·72 % of taproot total N for HN and 15·8 ± 0·33 % for the LN treatment (Fig. 3), although the absolute amounts of N as soluble protein (including VSP) were 3·1 (HN) and 2·8 (LN) mg per taproot. N allocation between nitrate, amino acid plus peptides and insoluble N pool was not significantly different between N treatments.
Net N uptake during regrowth after cutting
During the 29 d of regrowth, the variation in N uptake (Fig. 4) and net N uptake rate (Table 1) were affected by the initial N reserve and residual leaf area. During the first 3 d of regrowth, both LN treatments (and particularly LNL+) had higher net N uptake rates, when compared with both HN treatments (Table 1). Thereafter, the net N uptake rate declined for all treatments between Day 3 and Day 8 of regrowth. During this first week of regrowth, the greatest reduction in net N uptake rate was observed in the LNL− plants. Between Day 8 and Day 13 of regrowth, the net N uptake rate remained low for both LN treatments (from 4·8 ± 0·23 to 3·9 ± 0·49 mg N plant−1d−1 for LNL+ and LNL− treatments, respectively), while the net N uptake rate began to increase for both HN treatments (Table 1).
During the phase from 13 to 29 d of regrowth, the net N uptake rate increased progressively in all treatments (Table 1). Irrespective of the residual leaf area level, the HN treatments had higher net N uptake rates than the LN treatments. As a consequence, after 29 d of regrowth, total uptake of N was 187·7 ± 28·82 mg plant−1 for HNL+ plants compared with 105·9 ± 13·64 mg plant−1 for LNL− plants (Fig. 4).
Production and partitioning of the biomass at the end of regrowth (Day 29)
Final biomass dry weights were severely reduced in L− and LN treatments, in comparison with HNL+ plants (Fig. 5). Except for LNL−, where dry matter partitioning was shifted in favour of the roots (taproot and lateral roots), the different organs of the whole plant were affected in the same proportions by the different treatments. Thus, the mean shoot to root dry matter ratio reached approx. 2·2 ± 0·04 compared with 1·9 ± 0·03 for LNL− (where the regrowing shoot dry matter was only 50 % of HNL+ shoot dry matter). Moreover, final taproot dry matter was significantly greater (P = 0·13) for L+ than for L− treatments (Fig. 5).
Fig. 5.

Dry matter of lateral roots, taproot, remaining shoot and regrowing shoot, with shoot : root ratio of alfalfa plants at final harvest (Day 29), following HN and LN pretreatments and L+ and L− treatments. Values in brackets represent means ± s.e. of the shoot to root dry matter ratio. Vertical bars indicate ± s.e. of the mean for n = 3 when larger than the symbol.
N content and partitioning within the plant at the end of regrowth (Day 29)
Total N and total exogenous N (derived from N uptake and estimated by 15N IRMS analysis) were significantly reduced in L− or LN plants after 29 d of regrowth (Table 2), in comparison with HNL+ plants. HNL−, LNL+ and LNL− plants had approx. 17·2 % and 46 % less total N, respectively, than HNL+ plants. However, and irrespective of treatment, total exogenous N represented approx. 62 % of total N in the plants at the end of the experiment (Table 2).
In addition, the partitioning of total exogenous N within the regrowing shoots was unaffected by treatment (Table 2). Most of the exogenous N was found in the regrowing shoot tissues (66·6 ± 1·66 % of total exogenous N) with a small fraction in the remaining shoot tissues present at Day 0 (5·2 ± 0·38 % of total exogenous N). Partitioning of N to taproots varied from 6·9 to 10·25 %, whereas the percentage of N in lateral roots was significantly lower (11·5 %) in LNL+ plants compared with other treatments (approx. 19 %).
N status and reserve compounds in the taproot at the end of regrowth (Day 29)
The taproot N status after 29 d of regrowth was significantly altered when leaves were totally removed (L−) and/or when N reserve status was low (LN) at Day 0 (Fig. 6). However, leaf removal reduced taproot N concentrations only in HN plants: 27·7 ± 1·92 (HNL+) compared with 21·7 ± 0·64 mg N g−1 dry matter (HNL−). Total N in the taproot at the end of regrowth was similar in LNL− and HNL− plants (approx. 21 mg), whereas LNL+ plants had significantly lower total N than HNL+ plants (Fig. 6).
The final allocation of N among the different taproot N fractions was also modified by the treatments (Fig. 6). Irrespective of the initial N status, the proportion of soluble N fraction (nitrate, amino acids, proteins and VSP) increased significantly as a result of leaf removal (45·3 % for HNL− vs. 34·1 % for HNL+ and 39·9 % for LNL− vs. 32·2 % for LNL−). This was mainly due to the relative increase of N partitioning to the amino acid plus peptide N pool (up to 40 % of increase for HNL− vs. HNL+), whereas the nitrate and soluble protein N pool decreased (Fig. 6). Compared with L+ plants, the VSP N pool also increased more than three-fold in both L− treatments (Fig. 6). The VSP N pool represented about 50 % of the soluble protein N pool for L− treatments, compared with only 20 % for L+ treatments at Day 29 (Fig. 6). Finally, and irrespective of the residual leaf area at Day 0, the initial N status did not induce large changes in N allocation between the soluble and non-soluble taproot N fractions, but significantly altered N allocation among the different soluble N pools. Whereas the proportion of the VSP fraction in soluble protein N pool remained unchanged, the sum of these two N pools decreased significantly from 13 ± 0·5 % for HNL+ to 9·4 ± 0·4 % for LNL+ and from 15·1 ± 0·9 % for HNL− to 11·8 ± 0·4 % for LNL−, respectively.
DISCUSSION
The objective of this work was to study the influence of residual leaf area and initial taproot N reserves on N uptake and distribution and yield in alfalfa. The effects of two different residual leaf areas [shoots with (L+) or without (L−) their leaves] and plants with contrasting initial N status (high N; HN or low N; LN level of taproot N reserves) on growth, N uptake kinetics, and N partitioning, allocation and storage within the alfalfa plant (‘Lodi’) during post-cutting regrowth, were analysed.
Effects of the N fertilization on initial biomass, plant morphology and N status
As already observed in alfalfa (Fishbeck and Philips, 1981; Ourry et al., 1994; Meuriot et al., 2003), soybean (Glycine max; Rufty et al., 1984), chicory (Cichorium intybus; Améziane et al., 1997) and ryegrass (Lolium perenne; Clement et al., 1978; Thornton et al., 1993), low N supply limited total biomass production, and shoot growth in particular (Fig. 2A). However, a more detailed study of the remaining organs showed that the reduction in N supply did not cause significant changes in taproot dry matter, residual leaf area, or the number of leaves, stems and buds in the crown. The reduction of N supply resulted in significant decreases in both taproot total N content and concentration (Fig. 3), although N partitioning between non-soluble and soluble N pools was unaffected. Nevertheless, the proportion of N in soluble protein and VSP pools increased while the proportion of N in the amino acid and peptide N pool declined. These results suggest that the reduction in N supply induced large changes in the source–sink relationships, in relation to N, within the plant, which led to quantitative and qualitative differences in taproot N status on the day of cutting (Day 0). The reduction in N supply did not, however, change the main C reserve compound, which is starch in alfalfa (data not shown). Thus, the alfalfa plants in this experiment differed only in their initial N reserve status, and not in their main morphological traits, which are known to play a part in post-cutting regrowth, and which would have interacted with the main variables of the experiment (i.e. initial N status and residual leaf area).
Effect of initial residual leaf area and N status on N uptake during post-cutting regrowth
During the first 3 d of regrowth (corresponding to the re-supply of 1 mm NH4NO3 to LN plants), and despite a reduced lateral root biomass, N uptake by LN plants was more than twice that by HN plants (Fig. 4 and Table 1). Because the LN plants had lower amino acid and peptide levels at Day 0, the transient increase in N uptake seems to be in agreement with studies on soybean, where Muller and Touraine (1992) showed that N uptake might be stimulated by decreasing phloem amino acid contents. Recent molecular studies also seem to support the hypothesis that N uptake feedback regulation is controlled by N products derived from nitrate assimilation (NH4+, amino acids) rather than by nitrate itself (Touraine et al., 2001; Forde, 2002). Moreover, and as for some grass species like ryegrass (Lolium perenne), the pool of amino acids in roots could also influence N uptake and play a regulatory role in early regrowth (Mac Duff et al., 1989; Louahlia et al., 1999; Morvan-Bertrand et al., 1999). The effects of the initial N reserve compounds and residual leaf area levels were cumulative for LNL− plants which showed the greatest decrease in net N uptake rate (reduction of 75 %), when compared with HNL+ plants (Table 1). In previous work, Hendershot and Volenec (1993b) reported that the relative concentrations of amino acids in the taproot increased transiently during the first 6 d following defoliation. This could be explained by the conjunction of the degradation of soluble proteins in the taproot and the reduction of phloem and xylem fluxes caused by shoot removal (Richards, 1993). This phenomenon could be also related to the lack of amino acid transport. Overall, the data suggest that the high level of amino acids in the root could limit the mineral N uptake during the first 3 d of regrowth observed in HN plants in comparison with LN plants. Thereafter, and irrespective of the residual leaf area treatments, N uptake was always superior for LN plants than for HN plants during the first 8–10 d of regrowth. Thus, in agreement with data for ryegrass (Loualhia et al., 1999; Morvan-Bertrand et al., 1999), where N uptake and N translocation were sustained after defoliation in low N plants growing under non-limiting N conditions, the present results show, for the first time, that alfalfa is also able to develop such a compensatory process. However, this seems to be a time-limited process and, irrespective of residual leaf area, HN plants showed greater net N uptake rates from Day 8 onwards. This second phase of N uptake also seemed to coincide with the re-accumulation of N reserves, which occurred after approx. 15 d of regrowth (Kim et al., 1993; Avice et al., 1996b) and when N supply was considered to exceed N demand for shoot growth. Overall the results suggest that the initial N status and/or the residual leaf area level alter N uptake, and that initial N status seemed to be a dominant factor during early regrowth.
Effect of initial residual leaf area and N status on final biomass production, N partitioning and N allocation
By the end of the experiment, the severity of the defoliation at Day 0 and/or the initial low N status had resulted in lower total biomass production. However, except for LNL−, these factors did not modify the shoot : root dry matter ratio significantly (Fig. 5). These results are consistent with previous studies on alfalfa (Kim et al., 1993; Avice et al., 1996b) showing that yield is dependent on initial N status or cutting level. Complete defoliation (L−) and/or LN status at Day 0 also resulted in significantly lower total plant N and total N derived from mineral uptake after 29 d of regrowth (Table 2). Ourry et al. (1994) have also shown a significant correlation between the N reserve level in perennial organs and total exogenous N uptake, and shoot biomass production after 24 d of regrowth following defoliation. However, in the present experiment, after 29 d of regrowth under non-limiting N conditions, and except for LNL+ plants, the initial N status and/or the residual leaf area level on the day of cutting did not cause significant changes in the relative partitioning of the absorbed N within the plant. Thus, approx. 65 % of total N was found in the regrowing shoot, as against 30 % in the roots. It appears that the final partitioning of exogenous N within the plant (at Day 29) was more closely related to growth conditions (N availability, light, temperature) during the regrowth period than to the initial N reserves or to the intensity of cutting. On the other hand, initial N reserves probably played a major role during early regrowth.
Low initial N status and low residual leaf area also caused significant reductions in the final N content of the taproot, and changes in N partitioning among the different taproot N fractions (Fig. 6). Irrespective of the initial residual leaf area, the proportions of soluble and insoluble N pools remained constant, whereas the total soluble protein N pool (including VSP) decreased by >20 % for both LN treatments, compared with HN plants. However, the proportion of the amino acid plus peptide N pool increased in L− plants compared with L+ plants, whereas the nitrate and soluble protein N pools were reduced for HN and LN plants. The VSP N pool represented about 50 % of the soluble protein N pool for both L− treatments but only 20 % for both L+ treatments. These effects of the severity of cutting or the level of initial N reserves on the final soluble N composition in taproots is of great importance because this final status will become a new initial status if the alfalfa crop is cut again, and could have important consequences for the following regrowth.
In conclusion, the residual leaf area and/or the initial taproot N status—two parameters that are affected by cutting intensity and frequency—had strong effects on the N source–sink relationships within the plant, and were sufficient to generate differences in plant N status, even after 29 d of regrowth under non-limiting N conditions. Thus, although shoot: root dry matter ratio and exogenous N partitioning within the different organs of the plant remained constant at the end of the experiment, total biomass production, N uptake and N allocation among the different taproot N pools were strongly modified, and particularly by the initial residual leaf area. When subjected to adverse conditions, here defoliation, alfalfa adapted by increasing N use efficiency and by the preferential mobilization of specific taproot N pools such as VSP or amino acids. Both the quantitative and qualitative composition of taproot N pools were also important factors determining yield and, in addition, the perenniality of the crop. Because it has been shown that nitrate reduction is essentially confined to alfalfa roots (Pate, 1980), this emphasizes the idea that N storage as protein in the taproot (rather than nitrate or amino acids forms) may allow nitrate uptake or reduction to occur at normal rates, as suggested by Millard (1988). Thus, this study suggests that protein storage is not only a means to sequester N in a tissue for further mobilization, utilization for growth or tissue maintenance, but may also indirectly influence both N acquisition and reduction capacities.
Acknowledgments
The authors wish to thank Marie-Paule Henry and Patrick Beauclair for their invaluable help in sample acquisition, nitrate and IRMS sample analysis. We also thank Dr Tony Gordon (IGER, Aberystwyth) for valuable comments on this work. Acknowledgements are extended to Prof. Jeffrey J. Volenec (Department of Agronomy, Purdue University, West Lafayette, IN 47907-2054, USA) for kindly providing the anti-VSP polyclonal antibodies. This work was supported by a PhD grant from the INRA (National Institute for Agricultural Research, France) and the ‘Conseil Régional de Basse-Normandie’ attributed to F. Meuriot.
LITERATURE CITED
- Améziane R, Richard-Molard C, Deléens E, Morot-Gaudry JF, Limami AM. 1997. Nitrate (15NO3) limitation affects nitrogen partitioning between metabolic and storage sinks and nitrogen reserve accumulation in chicory (Cichorium intybus L.). Planta 202: 303–312. [Google Scholar]
- Avice JC, Ourry A, Lemaire G, Boucaud J. 1996. Nitrogen and carbon flows estimated by 15N and 13C pulse chase labelling during regrowth of alfalfa. Plant Physiology 112: 281–290. [DOI] [PMC free article] [PubMed] [Google Scholar]
- Avice JC, Ourry A, Volenec JJ, Lemaire G, Boucaud J. 1996. Defoliation-induced changes in abundance and immunolocalization of vegetative storage proteins in taproots of Medicago sativa L. Plant Physiology and Biochemistry 34: 561–570. [Google Scholar]
- Avice JC, Ourry A, Lemaire G, Volenec JJ, Boucaud J. 1997. Root protein and vegetative storage proteins are key organic nutrients for alfalfa shoot regrowth. Crop Science 37: 1187–1193. [Google Scholar]
- Barber LD, Joern BC, Volenec JJ, Cunningham SM. 1996. Supplemental nitrogen effects on alfalfa regrowth and nitrogen remobilization from roots. Crop Science 36: 1217–1223. [Google Scholar]
- Bradford MM. 1976. A rapid and sensitive method for the quantification of microgram quantities of protein utilizing the principle of protein-dye binding. Analytical Biochemistry 72: 248–254. [DOI] [PubMed] [Google Scholar]
- Briske DD. 1996. Strategies of plant survival in grazed systems: a functional interpretation. In: Hodgson J, Illius AW, eds. Grazing management: an ecological perspective. Wallingford, UK: CAB International, 37–67. [Google Scholar]
- Clement CR, Hopper MJ, Jones LHP, Leafe EL. 1978. The uptake of nitrate by Lolium perenne from flowing nutrient solution. Effect of light, defoliation, and relationship to CO2 flux. Journal of Experimental Botany 29: 1173–1183. [Google Scholar]
- Constable GA, Sheridan KP, Gleeson AC. 1977. Effects of sequential defoliation on lucerne (Medicago sativa L.). Australian Journal of Agricultural Research 28: 769–776. [Google Scholar]
- Fishbeck KA, Phillips DA. 1981. Combined nitrogen and vegetative regrowth of symbiotically-grown alfalfa. Agronomy Journal 73: 975–978. [Google Scholar]
- Forde BG. 2002. Local and long-range signalling pathways regulating plant responses to nitrate. Annual Review of Plant Biology 53: 203–226. [DOI] [PubMed] [Google Scholar]
- Gana JA, Kalengamaliro NE, Cunningham SM, Volenec JJ. 1998. Expression of β-amylase from alfalfa taproots. Plant Physiology 118: 1495–1506. [DOI] [PMC free article] [PubMed] [Google Scholar]
- Gramshaw D, Lowe KF, Lloyd DL. 1993. Effect of cutting interval and winter dormancy on yield, persistance, nitrogen concentration and root reserves of irrigated lucerne in the Queensland subtropics. Australian Journal of Experimental Agriculture 33: 847–854. [Google Scholar]
- Hendershot KL, Volenec JJ. 1993. Taproot nitrogen accumulation and use in overwintering alfalfa (Medicago sativa L.). Journal of Plant Physiology 141: 68–74. [Google Scholar]
- Hendershot KL, Volenec JJ. 1993. Nitrogen pools in taproots of Medicago sativa L. after defoliation. Journal of Plant Physiology 141: 129–135. [Google Scholar]
- Hodgkinson KC. 1969. The utilization of root organic compounds during the regeneration of lucerne. Australian Journal of Biological Sciences 22: 1113–1123. [Google Scholar]
- Kim TH, Ourry A, Boucaud J, Lemaire G. 1991. Changes in source-sink relationship for nitrogen during regrowth of lucerne (Medicago sativa L.) following removal of shoots. Australian Journal of Plant Physiology 18: 593–602. [Google Scholar]
- Kim TH, Ourry A, Boucaud J, Lemaire G. 1993. Partitioning of nitrogen derived from N2 fixation and reserves in nodulated Medicago sativa L. during regrowth. Journal of Experimental Botany 44: 555–562. [Google Scholar]
- Lemaire G. 2001. Ecophysiology of grasslands: dynamic aspects of forage plant populations in grazed swards. In: Gomides JA, Mattos WRS, da Silva SC, eds. Proceedings of the XIX International Grassland Congress 2001. Piracicaba, Brasil: FEALQ 29–37. [Google Scholar]
- Lemaire G, Millard P. 1999. An ecophysiological approach to modelling resource fluxes in competing plants. Journal of Experimental Botany 50: 15–28. [Google Scholar]
- Louahlia S, Mac Duff JH, Ourry A, Humphreys M, Boucaud J. 1999. N reserve status affects the dynamics of nitrogen remobilization and mineral nitrogen uptake during recovery from defoliation by contrasting cultivars of Lolium perenne L. from defoliation. New Phytologist 142: 451–462. [Google Scholar]
- Mac Duff JH, Jarvis SC, Mosquera A. 1989. Nitrate nutrition of grasses from steady-state supplies in flowing solution culture following nitrate deprivation and/or defoliation. Assimilation of NO3− and short-term effects on NO3− uptake. Journal of Experimental Botany 40: 977–984. [Google Scholar]
- Meuriot F, Avice JC, Decau ML, Simon JC, Ourry A. 2003. Accumulation of N reserves and vegetative storage protein (VSP) in taproots of non-nodulated alfalfa (Medicago sativa L.) are affected by mineral N availability. Plant Science 165: 709–718. [Google Scholar]
- Meuriot F, Noquet C, Avice JC, Volenec JJ, Cunningham SM, Sors T, Caillot S, Ourry A. 2004. Methyl jasmonate alters N partitioning, N reserves accumulation and induces gene expression of a 32-kDa vegetative storage protein that possess chitinase activity in Medicago sativa L. taproots. Physiologia Plantarum 119: 1–11. [DOI] [PubMed] [Google Scholar]
- Millard P. 1988. The accumulation and storage of nitrogen by herbaceous plants. Plant, Cell and Environment 11: 1–8. [Google Scholar]
- Morvan-Bertrand A, Boucaud J, Prud'homme MP. 1999. Influence of initial levels of carbohydrates, fructans, nitrogen and soluble proteins on regrowth of Lolium perenne L. cv Bravo following defoliation. Journal of Experimental Botany 50: 1817–1826. [Google Scholar]
- Muller B, Touraine B. 1992. Inhibition of NO3− uptake by various phloem-translocated amino acids in soybean seedlings. Journal of Experimental Botany 43: 617–623. [Google Scholar]
- Noquet C, Avice JC, Ourry A, Volenec JJ, Cunningham SM, Boucaud J. 2001. Effects of environmental factors and endogenous signals on N uptake, N partitioning and taproot storage protein accumulation in Medicago sativa L. Australian Journal of Plant Physiology 28: 279–288. [Google Scholar]
- Ourry A, Kim TH, Boucaud J. 1994. Nitrogen reserve mobilization during regrowth of Medicago sativa L.: relationships between their availability and regrowth yield. Plant Physiology 105: 831–837. [DOI] [PMC free article] [PubMed] [Google Scholar]
- Ourry A, Macduff J, Volenec JJ, Gaudillère JP. 2001. Nitrogen traffic during plant growth and development. In: Morot-Gaudry JF, Lea P, eds. Plant nitrogen. Berlin: Springer Verlag, 255–273. [Google Scholar]
- Pate JS. 1980. Transport and partitioning of nitrogenous solutes. Annual Review of Plant Physiology 31: 313–340. [Google Scholar]
- Peterson GL. 1983. Determination of total protein. Methods in Enzymology 91: 95–119. [DOI] [PubMed] [Google Scholar]
- Richards JH. 1993. Physiology of plants recovering from defoliation. In: Bakes MJ, ed. Grassland for our world. Wellington, New Zealand: DSIR Publishing, 46–54. [Google Scholar]
- Rufty TW, Raper CD, Huber SC. 1984. Alterations in internal partitioning of carbon in soybean plants in response to nitrogen stress. Canadian Journal of Botany 62: 501–508. [DOI] [PubMed] [Google Scholar]
- Staswick PE. 1994. Storage proteins in vegetative plant tissues. Annual Review of Plant Physiology and Plant Molecular Biology 45, 302–322. [Google Scholar]
- Ta TC, MacDowall FDH, Faris MA. 1990. Utilization of carbon and nitrogen reserves of alfalfa roots in supporting N2-fixation and shoot regrowth. Plant and Soil 127: 231–236. [Google Scholar]
- Thornton B, Millard P, Duff EI, Buckland ST. 1993. The relative contribution of remobilization and root uptake in supplying nitrogen after defoliation for regrowth of laminae in four grass species. New Phytologist 124: 689–694. [DOI] [PubMed] [Google Scholar]
- Touraine B, Daniel-Vedèle F, Forde BG. 2001. Nitrate uptake and its regulation in plant. In: Lea PJ, Morot-Gaudry JF, eds. Plant nitrogen. Berlin: Springer-Verlag, 1–36. [Google Scholar]
- Vance CP, Heichel GH. 1981. Nitrate assimilation during vegetative regrowth of alfalfa. Plant Physiology 68: 1052–1056. [DOI] [PMC free article] [PubMed] [Google Scholar]