

Abstract
• Background and Aims Nuclear DNA amounts of 12 diploid and one tetraploid taxa and 12 natural interspecific hybrids of Cirsium from 102 populations in the Czech Republic, Austria, Slovakia and Hungary were estimated.
• Methods DAPI and PI flow cytometry were used.
• Key Results 2C-values of diploid (2n = 34) species varied from 2·14 pg in C. heterophyllum to 3·60 pg in C. eriophorum (1·68-fold difference); the 2C value for the tetraploid C. vulgare was estimated at 5·54 pg. The DNA contents of hybrids were located between the values of their putative parents, although usually closer to the species with the smaller genome. Biennial species of Cirsium possessed larger nuclear DNA amounts than their perennial relatives. Genome size was negatively correlated with Ellenberg's indicator values for continentality and moisture and with eastern limits of distribution. A negative relationship was also detected between the genome size and the tendency to form natural interspecific hybrids. On the contrary, C-values positively corresponded with the spinyness (degree of spinosity). AT frequency ranged from 48·38 % in C. eriophorum to 51·75 % in C. arvense. Significant intraspecific DNA content variation in DAPI sessions was detected in C. acaule (probably due to the presence of B-chromosomes), and in tetraploid C. vulgare. Only the diploid level was confirmed for the Pannonian C. brachycephalum, generally considered to be tetraploid. In addition, triploidy was discovered for the first time in C. rivulare.
• Conclusions Considerable differences in nuclear DNA content exist among Central European species of Cirsium on the diploid level. Perennial soft spiny Cirsium species of wet habitats and continental distributions generally have smaller genomes. The hybrids of diploid species remain diploid, and their DNA content is smaller than the mean of the parents. Species with smaller genomes produce interspecific hybrids more frequently.
Key words: AT frequency, Asteraceae, base composition, C-value, DAPI, DNA content, Ellenberg's indicator values, flow cytometry, genome size, interspecific hybrids, propidium iodide, thistle
INTRODUCTION
The genus Cirsium (thistle) is composed of over 250 perennial, biennial, or rarely annual, spiny species distributed in the northern hemisphere, spanning the subtropical to boreal latitudes. Its occurrence in the southern hemisphere is considered to be non-native. The highest species diversity is concentrated in the mountains of Southern Europe and in the Caucasus Mts (Jäger, 1977; Meusel and Jäger, 1992). The genus belongs to the family Asteraceae in which known C-values vary about 62-fold, ranging from 0·40 pg in Leontodon longirostris to 24·83 pg in Leucanthemum subglaucum. However, these estimates are based on a rather limited sample size, as nuclear DNA contents of only 1·2 % of the species from this exceptionally large family have been estimated (Bennett and Leitch, 2003).
The most frequent chromosome number within the genus Cirsium is diploid 2n = 34 (reported for approx. 69 % of the species); tetraploid 2n = 68 is also relatively common approx. 10 % of species), and less frequent counts include 2n = 30 and 2n = 32 (both approx. 5 %). Other numbers, such as 2n = 16, 18, 20, 22, 24, 26, 28, 26, 51, 102 are either very rare or doubtful. At least in some cases, they may represent misidentified plants belonging to related genera, e.g. Carduus (prevalent 2n = 16, 22) or Carlina (prevalent 2n = 20) (cf. Fedorov, 1969; Moore, 1973, 1974, 1977; Goldblatt, 1981, 1984, 1985, 1988; Goldblatt and Johnson, 1990, 1991, 1994, 1996, 1998).
Thirteen species from the genus Cirsium Mill. from three sections are native to Central Europe (nomenclature and taxonomical treatment according to the compendium Flora Europaea; Werner, 1976): C. acaule, C. spinosissimum, C. oleraceum, C. erisithales, C. rivulare, C. pannonicum, C. canum, C. heterophyllum, C. palustre, C. brachycephalum (sect. Cirsium, syn.: Chamaeleon); C. vulgare, C. eriophorum (sect. Eriolepis) and C. arvense (sect. Cephalonoplos). Some authors (e.g. Wagenitz, 1987) also consider the West European thistles C. tuberosum and C. dissectum or East Alpine C. carniolicum and C. montanum and East Alpine–Carpathian C. waldsteinii to be Central European; nevertheless, they are not included in ourstudy.
Cirsium is a typical example of a genus with a high affinity to form natural interspecific hybrids (similar to Verbascum, Epilobium, Carex or Salix in the Central European flora). Out of 78 potential hybrid combinations (involving 13 studied species), 53 of them were proven to occur under natural conditions (cf. Soó, 1970; Wagenitz, 1987). Interspecific hybridization is a very common phenomenon, particularly in the type section of the genus. Hybrid plants usually occur as one or a few with or near parental species; large hybrid populations are rare. Hybrids are most easily recognizable by their intermediate habitus. They persist primarily through vegetative growth, forming clusters of flowering shoots often connected by rhizomes. Because hybrids are usually fertile, they can often produce introgressive hybrids with the parental species or triple hybrids with another taxa. The determination of living hybrid individuals in natural populations is, as a rule, successful. However, herbarium specimens can cause serious problems due to the considerable morphological variation of both hybrids and parental species. Marked differences in frequency of particular hybrid combinations were repeatedly observed under natural conditions (Wagenitz, 1987; Bureš, 2004); some species produce hybrids very often, while other combinations are extremely rare, and some others have probably never originated. A similar trend has also been documented in the production of hybrids by different plant genera in various parts of the world (Ellstrand et al., 1996). That feature (‘hybrid promiscuity’) is determined by several factors, including among others the frequency of sympatric occurrence, the degree of flowering period overlap, and phylogenetic (dis)similarity. Both early and late flowering individuals are common in almost all taxa and they may promote hybridization in species with temporarily isolated peaks of blossoming (P. Bureš, unpubl. res.).
C-values and genome size (= size of the monoploid chromosome set, averaged in polyploids) are important characteristics for all living organisms. These factors may be helpful in infrageneric classification assessment, species delimitation or hybrid identification (Keller et al., 1996; Buitendijk et al., 1997; Bare et al., 1998; Morgan et al., 1998; Ohri, 1998; Thibault, 1998; Thalmann et al., 2000; Zonneveld, 2001; Šiško et al., 2003). DNA content can be correlated with plant life-histories (Bennett, 1972; Price and Bachmann, 1975; Nandini et al., 1997), plant phenology (Grime and Mowforth, 1982; Baranyi and Greilhuber, 1999), environmental factors, climatic variation and geographical plant distribution (Bennett, 1976; Levin and Funderburg, 1979; Ohri and Khoshoo, 1986; Poggio et al., 1989, 1998; Wakamiya et al., 1993; MacGillivray and Grime, 1995; Bottinini et al., 2000; Hall et al., 2000; Knight and Ackerly, 2002).
The two main goals of our study were: (1) to estimate the degree of inter- and infra-specific variation in nuclear DNA amount for all Central European species of Cirsium and some of their natural hybrids; (2) to determine potential correlations between C-values/genome size and geographical, morphological and ecological features of the studied taxa. Eventual relationships between genome size variation and the production of natural hybrids were also a subject of our investigations.
MATERIALS AND METHODS
Experimental material
Three hundred and seventeen samples from 102 native populations of all 13 species and some of their hybrids were collected in the Czech Republic, Austria, Slovakia and Hungary during 2002 and 2003 (see Supplementary data at http://www.aob.oupjournals.org for the list of localities). Plants were identified in the field using a set of morphological features, and only unambiguously determined individuals were included in the study (cf. identification key and species or hybrid descriptions in Bureš, 2004). Voucher specimens are deposited in the herbarium of the Department of Botany, Masaryk University, Brno (BRNU).
Chromosome counts
The material was pretreated at room temperature with a saturated water solution of p-dichlorbenzene for 2 h and then fixed in a cold mixture of ethanol and acetic acid (3 : 1) for 24 h. The fixed material was treated immediately. The root tips were macerated in a mixture of ethanol and hydrochloric acid (1 : 1) for 2 min at room temperature. Temporary slides were made by squashing the cut and stained meristems in lacto-propionic orceine.
Relative DNA content (DAPI staining)
A PA-I ploidy analyser (Partec GmbH., Münster, Germany) equipped with an HBO-100 mercury arc lamp was used for the estimation of relative DNA content. Sample preparations were carried out in a two-step procedure (Otto, 1990; Doležel and Göhde, 1995) in the Laboratory of Flow Cytometry, Department of Botany, Masaryk University Brno, Czech Republic. Leaf tissues of the analysed individual and a reference standard (0·5 cm2 of leaf blade) were chopped with a new razor blade for about 20 s in a Petri dish containing 0·5 ml of ice-cold Otto I buffer, then 0·5 ml of Otto I buffer was added. The solution was filtered through nylon cloth (50 µm mesh size). For DNA staining, 2 ml of Otto II buffer supplemented with DAPI (4 µg ml−1 final concentration) was used.
Each species was represented by four to nine populations, with the exceptions of Cirsium erisithales (two populations) and C. spinosissimum (one population); hybrids were represented by one to four populations. One to five plants were randomly selected from each population for study; each plant (sample) was measured three to five times. The same individual of tetraploid C. vulgare was chosen as an internal reference standard (DNA content = 10 arbitrary units) in all DAPI measurements, carried out over two seasons.
Absolute DNA content, base composition and PI/DAPI index (propidium iodide staining)
A similar protocol was employed for the determination of nuclear DNA content in absolute units, using a ploidy analyser PA-II (Partec) equipped with a 488-nm air-cooled laser (25 mW output) in the Laboratory of Flow Cytometry, Institute of Botany, Czech Academy of Sciences in Průhonice, Czech Republic. Young intact leaves (0·5 cm2) of the sample and the internal standard were chopped with a sharp razor blade in a Petri dish containing 0·5 ml of ice-cold Otto I buffer. The solution was filtered through nylon mesh (50 µm pore size). For DNA staining, 1 ml of Otto II buffer supplemented with propidium iodide (50 µg ml−1 final concentration) and RNase II (50 µg ml−1 final concentration) was used.
One population each from 12 species (except Cirsium spinosissimum) was used for absolute DNA content estimation, and three plants per population were selected. All samples were collected on the same day in the field or in the experimental garden. Each plant was divided into two halves. One particular individual (also divided into two halves) of Lycopersicon esculentum ‘Stupické polní tyčkové rané’ (2C = 1·96 pg and AT frequency = 60 %; Marie and Brown, 1993) was employed as an internal standard. Each sample was measured three times on different days. The second series of samples (the remaining halves of the same plants) was measured at the same time with the same standard using PA-1 with AT specific DAPI staining in Brno.
The PI/DAPI index or dye factor DF-DAPIspecies = R-DAPIspecies/R-PIspecies (where R-DAPIspecies is the ratio between means of fluorescence peaks for a sample and reference stained by DAPI, analogically R-PIspecies; Barow and Meister, 2002) were calculated for each species. Then AT frequency was calculated using the equation f(ATspecies) = DF-DAPIspecies f(ATstandard) for each species. Barow and Meister (2002) argued that dye factor is a superior parameter for characterizing the AT frequency, as it does not require any assumptions in contrast to the widely employed formula f(AT) = (1 – AT) ATn/(1 – ATn) originally proposed by Godelle et al. (1993).
Statistical analysis
Genome size data were analysed using the statistical package ‘Statistica for Windows 6·0’ (StatSoft, 1984–2002). The Spearman non-parametric rank order correlation coefficient or Kendall tau were used in testing whether DNA amounts (mean values for individual species) correlate with Ellenberg's indicator values, the production of natural hybrids, morphological features, geographical limits, or longevity. Differences in DNA content between species were tested by one-way analysis of variance (ANOVA), and the Tukey HSD post hoc test was used to determine the significant differences between groups of species. To test differences between the actual and expected genome sizes of hybrids, the Wilcoxon matched pairs test was used.
RESULTS AND DISCUSSION
Accuracy of measurements
DAPI staining yielded histograms with coefficients of variance (CV) of both standard (Cirsium vulgare) and sample below 4·67 % in all 954 relative DNA content measurements (mean CV = 2·37; s.d. = 0·61). For AT frequency estimation, very low speed was used during DAPI staining measurements, therefore CVs below 3·16 % were achieved for both the standard Lycopersicum esculentum ‘Stupické polní tyčkové rané’ and sample in all 108 measurements (mean of standard CV = 2·09; s.d. = 0·42; mean of samples CV = 2·17; s.d. = 0·39). CVs for PI staining were higher, however they did not exceed 4·44 % either for the standard or the sample (mean of standard CV = 3·19; s.d. = 0·33; mean of samples CV = 3·23; s.d. = 0·43). Two individuals were excluded from the analyses, as they did not yield acceptable histograms (thus only 102 measurements were performed).
Inter- and intraspecific variation in DNA content
Table 1 shows nuclear DNA contents for all species in both absolute and relative units. Assessed with propidium iodide, 2C-values of diploid (2n = 34) species varied from 2·14 pg in C. heterophyllum to 3·60 pg in C. eriophorum (about 1·68-fold difference); the 2C value for tetraploid C. vulgare was estimated at 5·54 pg. The DNA content variation at diploid level was considerably lower in DAPI sessions, reaching only about 1·57-fold between the same pair of species (Fig. 1). Some differences were detected between our C-values and the data reported for three Cirsium species by Band (taken from Bennett and Leitch, 2003): C. palustre 1·40 pg, C. arvense 1·55 pg and C. vulgare 2·58 pg. Apart from the latter taxon, our estimates were smaller by approx. 9 %. Different internal reference standards might be responsible this variation. The C-value for tetraploid C. vulgare in our analyses, however, exceeded the tabulated value by about 7 %. The incongruency may be explained either by potential chromosome variation or a variation in nuclear DNA content in this species (see below). A majority of species from the type section had significantly lower DNA contents than species from the sections Eriolepis and Cephalonoplos. The only exception is C. brachycephallum (sect. Cirsium), which possesses a larger C-value than the other species of the type section. The existence of interspecific genome size variation was expected because different chromosome lengths for several diploid species from the Iberian Peninsula – the longest for C. eriophorum – were reported (Talavera, 1974).
Table 1.
Nuclear DNA content, base composition, and chromosome numbers in Central European species of Cirsium
| Absolute 2C DNA content |
Relative DNA content |
|||||||||||
|---|---|---|---|---|---|---|---|---|---|---|---|---|
| Species |
Mean ± s.d. (pg) |
AT % |
Populations – samples – measurements |
Mean ± s.d. (a.u.) |
Tukey grouping P = 0·05 |
Populations, samples, measurements |
2n |
Country and selecteda references to chromosomes |
||||
| Cirsium vulgare | 5·54 ± 0·12 | 59·62 | 1 – 3 –18 | (10) | A | 5, 5, 25 | 68 | Germanyc, Polandd, Slovakiae (2n = 34 Bulgariaf, 2n = 102 Portugalg) | ||||
| Cirsium eriophorum | 3·60 ± 0·03 | 57·86 | 1 – 3 – 18 | 6·39 ± 0·10 | B | 6, 14, 60 | 34 | Polandd, Austriah, Slovakiae | ||||
| Cirsium brachycephalum | 2·98 ± 0·05 | 59·77 | 1 – 3 – 18 | 5·49 ± 0·12 | C | 4, 15, 47 | 34 | Slovakiai,j, Czech Republic (this study), (2n = 68 Hungaryk) | ||||
| Cirsium arvense | 2·84 ± 0·05 | 61·89 | 1 – 3 – 15 | 5·31 ± 0·08 | D | 7, 16, 60 | 34 | Germanyc, Hungaryk, Polandd, Slovakiae, Czech Republicl, Austriam (2n = 68 Polandd, Bulgariaf) | ||||
| Cirsium acaule | 2·62 ± 0·03 | 60·94 | 1 – 3 – 15 | 4·98 ± 0·17 | E | 4, 20, 57 | 34 | Germanyn, Polandd, Slovakiao | ||||
| Cirsium palustre | 2·58 ± 0·05 | 58·77 | 1 – 3 – 18 | 4·69 ± 0·07 | F | 9, 26, 94 | 34 | Germanyc, Polandd, Slovakiao, Czech Republicp | ||||
| Cirsium spinosissimum | 2·53 ± 0·02b | – | 1 – 1 – 5 | 4·56 ± 0·03 | F G | 1, 1, 5 | 34 | Switzerlandq, Austriar | ||||
| Cirsium pannonicum | 2·44 ± 0·03 | 60·66 | 1 – 3 – 18 | 4·51 ± 0·09 | G | 6, 12, 44 | 34 | Hungarys, Slovakiae, Polandt | ||||
| Cirsium rivulare | 2·40 ± 0·03 | 61·82 | 1 – 2 – 12 | 4·40 ± 0·07 | G | 7, 33, 101 | 34 | Polandd, Slovakiau | ||||
| 3·43 ± 0·05 | – | 1 – 1 – 6 | – | – | ∼51 | Czech Republic (this study) | ||||||
| Cirsium erisithales | 2·33 ± 0·03 | 60·92 | 1 – 3 – 18 | 4·31 ± 0·09 | g, h | 2, 5, 20 | 34 | Hungarys, Polandd, Slovakiae,v, Austriar, (2n = 68 Polandd) | ||||
| Cirsium oleraceum | 2·32 ± 0·03 | 60·38 | 1 – 3 – 18 | 4·27 ± 0·05 | H | 9, 36, 110 | 34 | Polandd, Slovakiae, Germanyn, Austriaw, Czech Republicp | ||||
| Cirsium canum | 2·24 ± 0·02 | 60·57 | 1 – 3 – 18 | 4·22 ± 0·08 | H | 6, 24, 80 | 34 | Hungaryx, Polandd, Slovakiay, Czech Republicl | ||||
| Cirsium heterophyllum | 2·14 ± 0·03 | 61·77 | 1 – 3 – 18 | 4·06 ± 0·03 | I | 6, 19, 65 | 34 | Germanyn, Polandd, Slovakiau, Czech Republicp | ||||
References were selected in relation to the studied area.
Estimation based on DAPI staining from ratio to Cirsium vulgare (2C = 5·54 pg = 10 a.u.)
Fig. 1.

Range of interspecific genome size in Central European Cirsium species: graph of relative nuclear DNA content obtained after flow-cytometric analysis of DAPI stained nuclei, showing the diploid species with the smallest genome (Cirsium heterophyllum), the diploid species with the largest genome (C. eriophorum) and the lone tetraploid species (C. vulgare).
Considerable infraspecific variability (about 12·6 %) was detected in Cirsium acaule in DAPI sessions. In contrast to the other species studied, the presence of 0–6 accessory (B) chromosomes has been repeatedly detected in this taxon by earlier authors (Moore and Frankton, 1962). Variation in the number of B-chromosomes is regarded as one of the potential triggers of infraspecific genome size variability (cf. e.g. Poggio et al., 1998; Rosato et al., 1998; Schmid et al., 2002). Some differences (about 4 %) were also observed among individual plants in the tetraploid C. vulgare. The nature of this variation remains rather speculative and deserves further investigation.
Dye factor (characterizing AT frequency) among the studied species varied from 0·96 in Cirsium eriophorum to 1·03 in C. heterophyllum, C. rivulare and C. arvense. These values are in concordance with the range (1·02 ± 0·08) reported for the family Asteraceae by Barow and Meister (2002).
Ploidy levels in Cirsium rivulare and C. brachycephalum
The sympatric occurrence of two cytotypes was detected in Cirsium rivulare. Flow cytometry assay revealed one triploid individual within a diploid population (absolute genome size 3·43 pg, s.d. = 0·05); unfortunately, this result was not confirmed by chromosome count. The triploid chromosome number (2n = 51) was found earlier in Cirsium acaule by Skalińska et al. (1974) and in C. senjoense and C. spicatum by Arano (1957). Triploids in this genus probably originated via fusion of reduced and non-reduced gametes. Random individual (ortho)ploidy level variation (a random tetraploid in a diploid species or vice versa) is also reported for Cirsium erisithales by Czapik (1958) or for C. vulgare by Talavera (1974) and Kuzmanov et al. (1991). However, the sample sizes in our study were not sufficient to facilitate reliable investigation of ploidy level variation.
A diploid number of chromosomes (2n = 34) was counted in Cirsium brachycephalum collected near Trkmanský Dvůr (Bureš, 2004). This count is in agreement with numbers reported by Murín and Májovský (1983) and Murín and Svobodová (1992), although this species is generally considered to be tetraploid (2n = 68), based on a report by Pólya (1949). DNA content corresponding to the diploid level in this rare Pannonian endemic species was also found in all other investigated localities in Austria, Hungary and Slovakia.
DNA contents in hybrids
Relative nuclear DNA amounts in hybrid plants were located in the range between the putative parents (see Fig. 2 and Table 2), and the average genome sizes of hybrids were approximately intermediate to the parental genome sizes, particularly for hybrids represented by several populations. Nevertheless, the Wilcoxon matched pairs test showed a difference between the expected (relative DNA content of parent1 + relative DNA content of parent2)/2 and actual mean relative DNA content of the hybrids (n = 14; Z = 2·417; P = 0·01564). In the majority of hybrid combinations (11 out of 12), the relative genome size was smaller then predicted (see Fig. 3). These data indicate that elimination of certain parts of the genome can possibly occur after hybridization. It seems that in natural conditions either individuals with smaller genomes are favoured in interspecific crossing or hybrids with smaller genomes are more successful than those with larger ones. A similar tendency was also detected at the species level within the genus; species with smaller genomes produce interspecific hybrids more frequently than those with larger genomes, see below. The tendency towards DNA amount reduction was also observed in Hieracium subg. Pilosella where hybrid plants often possessed 2–4 % smaller genomes than expected (J. Suda et al., unpubl. res.). Despite this, intermediate genome size in F1 interspecific hybrids of parental species with the same chromosome number but different DNA content has been most commonly reported (e.g. Buitendijk et al., 1997; Bare et al., 1998; Morgan et al., 1998; Thibault, 1998; Zonneveld, 2001; Šiško et al., 2003). However, these hybrids had not naturally occurred, as had those studied by us. Different patterns of nuclear DNA content inheritance in hybrids were published by Price et al. (1985), who found Microseris F1 interspecific hybrids to have a similar genome size to the male parent, or by Rayburn et al. (1993), who found higher DNA contents in F1 hybrids of maize than in their respective parents for some specific parental combinations.
Fig. 2.

Relationship between the potential range of hybrid relative DNA content (solid parts of the lines), expected hybrid relative DNA content (filled squares), and actual relative DNA content of Cirsium interspecific hybrids (open diamonds).
Table 2.
Nuclear DNA contents and chromosome numbers in hybrids of Central European species of Cirsium
| Hybrid |
Absolute 2C DNA content mean ± s.d. (pg) |
Relative DNA content Mean ± s.d. (a.u.) |
Populations, samples, measurements |
2n |
Country and references to chromosomes |
|---|---|---|---|---|---|
| Cirsium acaule × C.oleraceum | 2·49 ± 0·10a | 4·50 ± 0·18 | 2, 4, 19 | ||
| Cirsium canum × C. oleraceum | 2·31 ± 0·05a | 4·17 ± 0·09 | 3, 4, 20 | 34 | Polandb |
| Cirsium canum × C. palustre | 2·37 ± 0·02a | 4·27 ± 0·04 | 1, 1, 5 | ||
| Cirsium erisithales × C. heterophyllum | 2·27 ± 0·02a | 4·10 ± 0·04 | 1, 1, 5 | ||
| Cirsium erisithales × C. oleraceum | 2·33 ± 0·06a | 4·21 ± 0·11 | 2, 2, 10 | ||
| Cirsium erisithales × C. palustre | 2·47 ± 0·04a | 4·46 ± 0·07 | 1, 1, 5 | ||
| Cirsium heterophyllum × C. oleraceum | 2·29 ± 0·03a | 4·14 ± 0·06 | 2, 4, 14 | ||
| Cirsium heterophyllum × C. palustre | 2·40 ± 0·04a | 4·33 ± 0·07 | 1, 1, 5 | 34 | Russiac |
| Cirsium heterophyllum × C. rivulare | 2·35 ± 0·03a | 4·24 ± 0·06 | 2, 7, 25 | ||
| Cirsium oleraceum × C. palustre | 2·50 ± 0·03a | 4·48 ± 0·05 | 1, 2, 10 | 34d | Germanye |
| Cirsium oleraceum × C. rivulare | 2·38 ± 0·06a | 4·30 ± 0·10 | 4, 11, 39 | 34 | Czech Republicf |
| Cirsium palustre × C. rivulare | 2·49 ± 0·06a | 4·49 ± 0·10 | 4, 15, 45 | 34 | Polandb |
Estimation based on DAPI staining from ratio to Cirsium vulgare (2C = 5·54 pg = 10 a.u.).
Chromosome counts are reported for hybrid (Cirsium palustre × C. oleraceum) × (C. palustre × C. oleraceum).
Fig. 3.
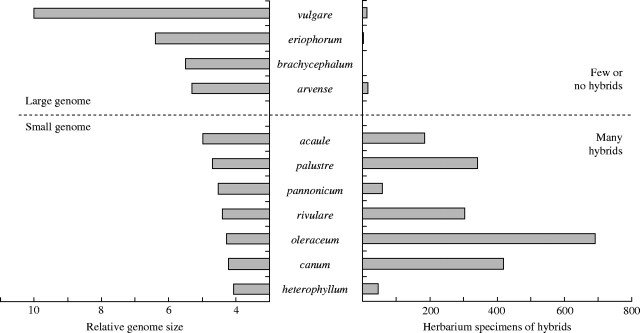
Relationship between relative DNA content of Cirsium species and the production of interspecific hybrids.
Correlation between hybrid promiscuity and genome size
More than 1000 specimens of Cirsium hybrids from Czech herbaria were revised during the taxonomic treatment of the genus for the Flora of the Czech Republic compendium (Bureš, 2004). These data seem sufficient to estimate the relationship between natural hybrid production and genome size (within the framework of the Czech Republic). For each of 11 species native to the Czech Republic, we counted the number of herbarium specimens of hybrids for which it was one of the parental species, see right half of Fig. 3. We consider this number equivalent to the ability to produce natural hybrids (hybrid ‘promiscuity’) for concrete species in the concrete geographical conditions of the Czech Republic, i.e. to a relatively small part of the whole distribution area for most of the studied species. Genome size is negatively correlated with the production of natural interspecific hybrids (Spearman's rS = − 0·72; P = 0·0128) (see Fig. 3); this tendency was also found at the individual level (see above).
The smaller genome in natural Cirsium hybrids may be caused by the elimination of chromosomal fragments or selected DNA sequences during rapid genome rearrangement soon after hybridization, as has been repeatedly described – particularly in allopolyploids (cf. Rieseberg et al., 1995; Feldman et al., 1997; Liu et al., 1998a, b; Pikaard and Chen, 1998; Ozkan et al., 2001). However, the implicit question: Are the smaller genomes of frequently hybridizing Cirsium species induced by their high natural hybridization activity? remains open for further study.
Comparison between genome sizes of biennials and perennials
Authors who have studied the correlation between genome size and longevity (life cycle, life-history or minimum generation time) have repeatedly confirmed that annuals have smaller genomes when compared with their perennial relatives; e.g. Rees and Hazarika (1969) or Nandini et al. (1997) in Lathyrus; Nagl and Ehrendorfer (1974) in the tribe Anthemideae; Price and Bachmann (1975) in Microseris; Jones and Brown (1976) in Crepis; Resslar et al. (1981); Hiremath and Salimath (1991) in Eleusine; Srivastava and Lavania (1991) in Papaver, Naranjo et al. (1998) in Vicia; Watanabe et al. (1999) in. Brachyscome; Torrell and Vallès (2001) in Artemisia. On the contrary, the four monocarpic, mostly biennial species of Cirsium in our study (C. vulgare, C. eriophorum, C. brachycephalum, and C. palustre) have significantly larger genomes than the other nine polycarpic perennial species (Kendall tau = − 0·604; P = 0·004). The rapid growth and development favoured by small DNA amounts are probably not essential advantages for these biennial short-lived species. In addition, biennials in temperate climates are monocarpic species which alternate between biennial or short perennial life cycles, depending on concrete ecological and climatic conditions. Among the studied species this has been documented, for example, by Falinska (1997) in C. palustre, by Tofts (1999) in C. eriophorum or by P. Bureš (unpubl. res.) in C. brachycephalum. From this viewpoint, there is perhaps a greater similarity in ecological strategy between biennials and perennials than between annuals and biennials. On the other hand, in some rare cases, the trend in genome size between annuals and perennials described above is inverted, as documented, e.g. in Pennisetum by Martel et al. (1997) and in Hypochaeris by Cerbah et al. (1999).
Correlations between genome size and morphological or eco-geographical features
No correlations between the genome sizes of studied species and the mean values of the following characters: flower head diameter, involucre length, involucre width, corolla length, pappus length, achene length (data based on Bureš, 2004) were found (Table 3). A noteworthy relationship was also detected between the genome size and the degree of spinosity (presence of stiff spines or barbs on leaves and stems): all the first six species with the smallest genomes, i.e. C. heterophyllum, C. canum, C. oleraceum, C. erisithales, C. rivulare and C. pannonicum have considerably slenderer and softer spines than the remaining species with larger genomes, i.e. C. spinosissimum, C. palustre, C. acaule, C. arvense, C. brachycephalum, C. eriophorum and C. vulgare (Kendall tau = −7·34, P < 0·001). The spiny species are better adapted to herbivore pressure.
Table 3.
Correlations between nuclear DNA content and morphological or eco-geographical features of Central European species of Cirsium
| Morphological features (means)a |
Ecological Ellenberg's indicator valuesb |
Geographical featuresc |
||||||||||||||||||||||||||||
|---|---|---|---|---|---|---|---|---|---|---|---|---|---|---|---|---|---|---|---|---|---|---|---|---|---|---|---|---|---|---|
| Species |
Relative DNA content |
Flower head diam. (cm) |
Involucre width (cm) |
Involucre length (cm) |
Corolla length (mm) |
Achene length (mm) |
Pappus length (mm) |
Light |
Temperature |
Continentality |
Moisture |
Reaction |
Nutrients |
Size of distribution area = latitude range (in °) × longitude range (in °) |
Eastern limit of distribution (in ° of E longitude) |
Northern limit of distribution (in ° of N latitude) |
Altitudinal maximum in the Middle Europe (in m s. m.) |
|||||||||||||
| Cirsium vulgare | 10 | 3·5 | 4·5 | 5·5 | 32·5 | 5·25 | 26·5 | 8 | 5 | 3 | 5 | 7 | 8 | –f | –f | –f | –f | |||||||||||||
| Cirsium eriophorum | 6·39 | 6 | 3·25 | 2·75 | 33 | 3·75 | 25 | 8 | xe | 3 | 4 | 9 | 5 | 375 | 22 | 54 | 2000g | |||||||||||||
| Cirsium brachycephalum | 5·49 | 1·25 | 2·75 | 1·6 | 29 | 4·5 | 24 | –d | –d | –d | –d | –d | –d | 36 | 25 | 48 | 200a | |||||||||||||
| Cirsium arvense | 5·31 | 1·9 | 2·05 | 1·75 | 20·5 | 4·25 | 16·5 | 8 | 5 | xe | xe | xe | 7e | –f | –f | –f | –f | |||||||||||||
| Cirsium acaule | 4·98 | 3·5 | 1·75 | 1·75 | 19 | 3·7 | 15·5 | 9 | 5 | 4 | 3 | 8 | 2 | 700 | 28 | 60 | 2350g | |||||||||||||
| Cirsium palustre | 4·69 | 1·45 | 1·4 | 1·5 | 18 | 3·75 | 14·5 | 7 | 5 | 3 | 8 | 4 | 3 | 3234 | 88 | 69 | 1850g | |||||||||||||
| Cirsium spinosissimum | 4·56 | – | 1·9 | 1·9 | 18·5 | 4·05 | 15·5 | 7 | 2 | 5 | 6 | 7 | 8 | 40 | 16 | 48 | 3000g | |||||||||||||
| Cirsium pannonicum | 4·51 | 2·5 | 2·4 | 2·75 | 27·5 | 4·5 | 24 | –d | –d | –d | –d | –d | –d | 429 | 42 | 55 | 800a | |||||||||||||
| Cirsium rivulare | 4·40 | 2·75 | 1·3 | 0·9 | 12·5 | 3·25 | 10·5 | 9 | 5 | 4 | 7 | 8 | 5 | 678 | 37 | 56 | 1700g | |||||||||||||
| Cirsium erisithales | 4·31 | – | 0·85 | 0·75 | 8·5 | 2·5 | 7·5 | 6 | 5 | 5 | 5 | 8 | 2 | 360 | 27 | 57 | 2000g | |||||||||||||
| Cirsium oleraceum | 4·27 | 2·5 | 1·45 | 1 | 15 | 3·5 | 18 | 6 | xe | 3 | 7 | 7 | 5 | 1403 | 61 | 65 | 2020g | |||||||||||||
| Cirsium canum | 4·22 | 3·5 | 1·9 | 1·75 | 17 | 4·5 | 17·5 | 8 | 7 | 6 | 8 | 7 | ?e | 1533 | 85 | 58 | 800a | |||||||||||||
| Cirsium heterophyllum | 4·06 | 4·25 | 2·05 | 2·15 | 16 | 4 | 15 | 7 | 4 | 5 | 8 | 5 | 6 | 4060 | 130 | 72 | 2100g | |||||||||||||
| Correlation | No | No | No | No | No | No | No | No | Yes | Yes | No | No | No | Yes | No | No | ||||||||||||||
| Spearman's rS | –0·10 | 0·10 | −0·12 | 0·04 | −0·30 | 0·19 | 0·44 | 0·07 | −0·64 | −0·68 | 0·34 | 0·23 | −0·54 | −0·64 | −0·55 | −0·08 | ||||||||||||||
| P = | 0·767 | 0·747 | 0·692 | 0·901 | 0·326 | 0·534 | 0·172 | 0·859 | 0·045 | 0·029 | 0·333 | 0·514 | 0·083 | 0·032 | 0·079 | 0·821 | ||||||||||||||
Cirsium pannonicum and C. brachycephalum were excluded because Ellenberg et al. (1992) did not report values for these taxa which do not occur in Germany.
Species marked ‘x’ are indifferent or very varied in behaviour, species marked ‘?’ are of unknown value, both were excluded from the correlation test, the last indicator value, salinity, being excluded because it is uniform in the taxa studied.
Invasive species with secondary distribution, C. arvense and C. vulgare, were excluded.
Most of the studied taxa have large ecological and altitudinal amplitudes. Therefore, to study the relationship between genome size and ecological features, we used the approximate ecological parameters published for German plant species by Ellenberg et al. (1992), commonly known as Ellenberg's indicator values, and frequently used by vegetation scientists in Central Europe. Significant negative correlation was found with values for moisture and continentality, i.e. species with larger genomes prefer dry habitats in areas with more oceanic climates, and species with smaller genomes grow in more humid habitats (wetlands) in continental areas (see Table 3).
The relationship between genome size, limits of geographical distribution and altitude was also analysed. For each species, the approximate distribution area size [= latitude range (in degrees) longitude range (in degrees)], the northernmost latitude limit (in degrees), and easternmost longitude limit (in degrees) was calculated on the basis of distribution maps published by Meusel and Jäger (1992) (see Table 3). Species with secondary distributions (C. arvense, C. vulgare) were excluded. A negative correlation was found with the eastern limit of distribution (see Table 3), i.e. species having an eastern boundary of distribution far to the east have smaller genomes. However, this parameter is strongly correlated with the Ellenberg's indicator value for continentality, because continentality increases from west to east in Europe. Species with the smallest genomes (C. heterophyllum, C. canum and C. oleraceum) have large distributions; and species with the largest genomes (C. brachycephalum and C. eriophorum) have small distributions; however, a significant correlation was not confirmed. A similar case was the relationship with the northern limit of distribution, where significant correlation was also not found. If we exclude C. palustre, which has a relatively large genome and distribution area, from this analysis, the remaining ten species show possible trends in geographical features, i.e. negative correlation either with the northern distribution limit (Spearman's rS = − 0·74; P = 0·05) or with the distribution area size (Spearman's rS = − 0·72; P = 0·019), and a stronger negative correlation with the eastern limit of distribution Spearman's rS = −0·83; P = 0·003).
On the basis of data gathered by Wagenitz (1987) and Bureš (2004) the altitudinal maximum for each species in Central Europe was estimated. No correlation between genome sizes and these altitudinal limits was found (see Table 3).
Supplementary Material
Acknowledgments
The authors are indebted to Sierra Dawn Stoneberg Holt, who did language corrections, Olga Rotreklová for the chromosome analysis of Cirsium brachycephalum, Petr Šmarda for help with the statistical analyses, and all the colleagues who helped us collect material (see Supplementary data at http://www.aob.oupjournals.org). This study was supported by the Ministry of Education of the Czech Republic (research projects MSM 143100010 and MSM 313 004) and by Grant agency of the Czech Republic (research project GA ČR 206/98/1545).
LITERATURE CITED
- Arano H. 1957. The karyotype analysis and its karyotaxonomic consideration in some genera of subtribe Carduinae Japanese Journal of Genetics 32: 323–332. [Google Scholar]
- Bakšay L. 1956. Cytotaxonomical studies on the flora of Hungary. Annales Historico-Naturali Musei Nationalis Hungarici, Series Nova 7: 321–334. [Google Scholar]
- Baranyi M, Greilhuber J. 1999. Genome size in Allium: in quest of reproducible data. Annals of Botany 83: 687–695. [Google Scholar]
- Bare P, Layssac M, D'Hont A, Louarn J, Charrier A, Hamon S, Noirot M. 1998. Relationship between parental chromosomic contribution and nuclear DNA content in the coffee interspecific hybrid C. pseudozanguebariae × C. liberica var. ‘dewevrei’. Theoretical and Applied Genetics 96: 301–305. [Google Scholar]
- Barow M, Meister A. 2002. Lack of correlation between AT frequency and genome size in higher plants and the effect of nonrandomness of base sequences on dye binding. Cytometry 47: 1–7. [DOI] [PubMed] [Google Scholar]
- Bennett MD. 1972. Nuclear DNA content and minimum generation time in herbaceous plants. Proceedings of the Royal Society of London Ser. B 181: 109–135. [DOI] [PubMed] [Google Scholar]
- Bennett MD. 1976. DNA amount, latitude and crop plant distribution. Environmental and Experimental Botany 16: 93–108. [Google Scholar]
- Bennett MD, Leitch IJ. 2003. Angiosperm DNA C-values database (release 4·0, Jan. 2003) http://www.rbgkew.org.uk/cval/homepage.html [Google Scholar]
- Bottini MCJ, Greizerstein EJ, Aulicino MB, Poggio L. 2000. Relationships among genome size, environmental conditions and geographical distribution in natural populations of NW Patagonian species of Berberis L. (Berberidaceae). Annals of Botany 86: 565–573. [Google Scholar]
- Buitendijk JH, Boon EJ, Ramanna MS. 1997. Nuclear DNA Content in Twelve Species of Alstroemeria L. and some of their hybrids. Annals of Botany 79: 343–353. [Google Scholar]
- Bureš P. 2004.Cirsium Mill. – pcháč. In: Slavík B, ed. Květena České republiky [Flora of the Czech Republic], Vol 7/1. Praha: Academia (in press). [Google Scholar]
- Buttler KP. 1989. Chromosomenzahlen von Gefässpflanzen aus Hessen 4. Folge. Hessische Floristische Briefe 38: 11–14. [Google Scholar]
- Cerbah M, Couland J, Brown SC, Siljak-Yakovlev S. 1999. Evolutionary DNA variation in the genus Hypochaeris Heredity 82: 261–266. [DOI] [PubMed] [Google Scholar]
- Czapik R. 1958. Karyological studies in species of Cirsium Mill. em. Scop. occurring in Poland. Acta Societatis Botanicorum Poloniae 27: 483–489. [Google Scholar]
- Dobeš C, Hahn B, Morawetz W. 1997. Chromosomenzahlen zur Gefässpflanzen-Flora Österreichs Linzer Biologische Beiträge 29: 5–43. [Google Scholar]
- Dobeš C, Kiehn M, Vitek E. 1996. Beiträge zur Gegässpflanzen-Flora von Österreich: Chromosomenzählungen III. Verhandlungen des Zoologisch-botanischen Geselschaft Österreich 133: 301–318. [Google Scholar]
- Dobeš C, Vitek E. 2000.Documented chromosome number checklist of Austrian vascular plants. Verl. Naturhistorisches Museum, Wien. [Google Scholar]
- Doležel J, Göhde W. 1995. Sex determination in dioecious plants Melandrium album and M. rubrum using high-resolution flow cytometry. Cytometry 19: 103–106. [DOI] [PubMed] [Google Scholar]
- Ellenberg H, Weber HE, Düll R, Wirth V, Werner W, Paulissen D. 1992. Indicator values of plants in Central Europe. Scripta Geobotanica 18: 1–258. [Google Scholar]
- Ellstrand NC, Whitkus R, Riesenberg L. 1996. Distribution of spontaneous plant hybrids. Proceedings of National Academy of America 93: 5090–5093. [DOI] [PMC free article] [PubMed] [Google Scholar]
- Falinska K. 1997. Life history variation in Cirsium palustre and its consequences for the population demography in vegetation succession. Acta Societatis Botanicorum Poloniae 66: 207–220. [Google Scholar]
- Fedorov AA, red. 1969.Chromosome numbers of flowering plants. Leningrad: Nauka. [Google Scholar]
- Feldman M, Liu B, Segal G, Abbo S, Levy AA, Vega JM. 1997. Rapid elimination of low-copy DNA sequences in polyploid wheat: a possible mechanism for differentiation of homeologous chromosomes. Genetics 147: 1381–1387. [DOI] [PMC free article] [PubMed] [Google Scholar]
- Godelle B, Cartier D, Marie D, Brown SC, Siljak-Yakovlev S. 1993. Heterochromatin study demonstrating the non-linearity of fluorimetry useful for calculating genomic base composition. Cytometry 14: 618–626. [DOI] [PubMed] [Google Scholar]
- Goldblatt P, ed. 1981.Index to plant chromosome numbers 1975–1978 (1981), 1979–1981 (1984), 1982–1983 (1985), 1984–1985 (1988). Missouri Botanical Garden Press, St Louis. [Google Scholar]
- Goldblatt P, Johnson DE, eds. 1990.Index to plant chromosome numbers 1986–1987 (1990), 1988–1989 (1991), 1990–1991 (1994), 1992–1993 (1996), 1994–1995 (1998). Missouri Botanical Garden Press, St Louis. [Google Scholar]
- Grime JP, Mowforth MA. 1982. Variation in genome size – an ecological interpretation. Nature 299: 151–153. [Google Scholar]
- Hall SE, Dvorak WS, Johnston JS, Price HJ, Williams CG. 2000. Flow cytometric analysis of DNA content for tropical and temperate new world pines. Annals of Botany 86: 1081–1086. [Google Scholar]
- Hiremath SC, Salimath SS. 1991. Quantitative nuclear DNA changes in Eleusine (Gramineae). Plant Systematics and Evolution 178: 225–233. [Google Scholar]
- Jäger EJ. 1977. Wuchsform und Verbreitung der Cirsium acaule-Verwandtschaft in Eurasien. Flora 166: 75–92. [Google Scholar]
- Jones RN, Brown LM. 1976. Chromosome evolution and DNA variation in Crepis Heredity 36: 91–104. [Google Scholar]
- Keller ERJ, Schubert I, Fuchs J, Meister A. 1996. Interspecific crosses of onion with distant Allium species and characterization of the presumed hybrids by means of flow cytometry, karyotype analysis and genomic in situ hybridization. Theoretical and Applied Genetics 92: 417–424. [DOI] [PubMed] [Google Scholar]
- Kiehn M, Vitek E, Hellmayr E, Walter J, Tschenett J, Justin C, Mann M. 1991. Beiträge zur Flora von Österreich: Chromosomenzählungen. Verhandlungen der Zoologisch-botanischen Gesellschaft in Wien 128: 19–39. [Google Scholar]
- Knight CA, Ackerly DD. 2002. Variation in nuclear DNA content across environmental gradients: a quantile regression analysis. Ecology Letters 5: 66–76. [Google Scholar]
- Kuzmanov BA, Georgieva SB, Nikolova VT. 1991. Karyological study of Bulgarian plants from the family Compositae. IV. Tribus Carduae Cass. Fitologiya 39: 3–22. [Google Scholar]
- Larsen K. 1954. Chromosome numbers of some European Flowering Plants. Botanisk Tidsskrift 50: 161–174. [Google Scholar]
- Lavrenko AN, Serditov NP, Ulle ZG. 1991. Chromosome numbers in some species of vascular plants from the Pechoro-Ilychsky Reservation (Komi ASSR). Botanitcheskyi Zhurnal 76: 473–476. [Google Scholar]
- Levin DA, Funderburg SW. 1979. Genome size in angiosperms; temperate versus tropical species. American Naturalist 114: 784–795. [Google Scholar]
- Liu B, Vega JM, Feldman M. 1998. Rapid genomic changes in newly synthesized amphiploids of Triticum and Aegilops II. Changes in low-copy coding DNA sequences. Genome 41: 535–542. [DOI] [PubMed] [Google Scholar]
- Liu B, Vega JM, Segal G, Abbo S, Rodova M, Feldman M. 1998. Rapid genomic changes in newly synthesized amphiploids of Triticum and Aegilops I. Changes in low-copy non-coding DNA sequences. Genome 41: 272–277. [DOI] [PubMed] [Google Scholar]
- MacGillivray CW, Grime JP. 1995. Genome size predicts frost resistance in British herbaceous plants: implications for rates of vegetation response to global warming. Functional Ecology 9: 320–325. [Google Scholar]
- Marie D, Brown SC. 1993. A cytometric exercise in plant DNA histograms, with 2C values for seventy species. Biology of the Cell 78: 41–51. [DOI] [PubMed] [Google Scholar]
- Májovský J. et al. 1970. Index of chromosome numbers of Slovakian flora, Part 2. Acta Facultatis Rerum Naturalium Universitatis Comenianae, Botanica 18: 45–60. [Google Scholar]
- Májovský J. et al. 1974. Index of chromosome numbers of Slovakian flora, Part 3. Acta Facultatis Rerum Naturalium Universitatis Comenianae, Botanica 22: 1–20. [Google Scholar]
- Májovský J. et al. 1974. Index of chromosome numbers of Slovakian flora, Part 4. Acta Facultatis Rerum Naturalium Universitatis Comenianae, Botanica 23: 1–23. [Google Scholar]
- Májovský J. et al. 1976. Index of chromosome numbers of Slovakian flora, Part 5. Acta Facultatis Rerum Naturalium Universitatis Comenianae, Botanica 25: 1–18. [Google Scholar]
- Májovský J. et al. 1978. Index of chromosome numbers of Slovakian flora, Part 6. Acta Facultatis Rerum Naturalium Universitatis Comenianae, Botanica 26: 1–42. [Google Scholar]
- Martel E, DeNay D, Siljak-Yakovlev S, Brown S. Sarr A. 1997. Genome size variation and basic chromosome number in pearl millet and fourteen related Pennisetum species. Journal of Heredity 88: 139–143. [Google Scholar]
- Měsíček J, Javůrková-Jarolímová V. 1992.List of chromosome numbers of the Czech vascular plants. Academia, Praha. [Google Scholar]
- Meusel H, Jäger E. 1992.Vergleichende Chorologie der Zentraleuropäischen Flora. Band III Karten. Stuttgart and New York: Gustav Fischer Verlag Jena. [Google Scholar]
- Moore RJ, ed. 1973.Index to plant chromosome numbers 1967–1971 (1973) Oosthoek's Uitgeversmaatschappij, Utrecht, 1972 (1974), 1973/74 (1977). Utrecht: Bohn, Scheltema & Holkema. [Google Scholar]
- Moore RJ, Frankton C. 1962. Cytotaxonomic studies in the tribe Cynareae (Compositae). Canadian Journal of Botany 40: 281–292. [Google Scholar]
- Morgan ER, Burge GK, Seelye JF, Hopping ME, Grant JE. 1998. Production of inter-specific hybrids Limonium perezii (Stapf) Hubb. and Limonium sinuatum (L.) Mill. Euphytica 102: 109–115. [Google Scholar]
- Murín A, Májovský Z. 1983. Karyological study of the Slovak flora IV. Acta Facultatis Rerum Naturalium Universitatis Comenianae, Botanica 30: 1–16. [Google Scholar]
- Murín A, Svobodová Z. 1992. Karyological study of the Slovak flora XXVI. Acta Facultatis Rerum Naturalium Universitatis Comenianae, Botanica 39: 59–65. [Google Scholar]
- Nagl W, Ehrendorfer F. 1974. DNA content, heterochromatin, mitotic index, and growth in perennial and annual Anthemideae (Asteraceae). Plant Systematics and Evolution 123: 737–740. [Google Scholar]
- Nandini AV, Murray BG, O'Brien IEW, Hammett KRW. 1997. Intra- and interspecific variation in genome size in Lathyrus (Leguminosae). Botanical Journal of Linnean Society 125: 359–366. [Google Scholar]
- Naranjo CA, Ferrari MR, Palermo AM, Poggio L. 1998. Karyotype, DNA content and meiotic behaviour in five South American species of Vicia (Fabaceae). Annals of Botany 82: 757–764. [Google Scholar]
- Ohri D. 1998. Genome size variation and plant systematics. Annals of Botany, Suppl. A 82: 75–83. [Google Scholar]
- Ohri D, Khoshoo TN. 1986. Genome size in gymnosperms. Plant Systematics and Evolution 153: 119–132. [Google Scholar]
- Otto F. 1990. DAPI staining of fixed cells for high-resolution flow cytometry of nuclear DNA. In: Crissman HA, Darzynkiewicz Z, eds. Methods in cell biology. Vol. 33. New York: Academic Press, 105–110. [DOI] [PubMed] [Google Scholar]
- Ozkan H, Levy AA, Feldman M. 2001. Allopolyploidy-induced rapid genome evolution in the wheat (Aegilops-Triticum) group. Plant Cell 13: 1735–1747. [DOI] [PMC free article] [PubMed] [Google Scholar]
- Pikaard CS, Chen ZJ. 1998. Nucleolar dominance. In: Paule RM. ed., RNA polymerase I: Transcription of eukaryotic ribosomal RNA. Austin, TX: R.G. Landes, 275–293. [Google Scholar]
- Poggio L, Burghardt AD, Hunziker JH. 1989. Nuclear DNA variation in diploid and polyploid taxa of Larrea (Zygophyllaceae). Heredity 63: 321–328. [Google Scholar]
- Poggio L, Rosato M, Chiavarino AM, Narajano CA. 1998. Genome size and environmental correlations in maize (Zea mays ssp. mays, Poaceae). Annals of Botany Suppl. A, 82: 107–115. [Google Scholar]
- Pólya L. 1949. Chromosome numbers of Hungarian plants. Acta Geobotanica Hungarica 6: 124–137. [Google Scholar]
- Pólya L. 1950. Magyarországi növényfajok kromoszómaszámai. II. Annales Biologicae Universitatis Debreceniensis 1: 46–56. [Google Scholar]
- Price JH, Bachmann K. 1975. DNA content evolution in the Microseridinae. American Journal of Botany 62: 262–267. [Google Scholar]
- Price JH, Chambers KL, Bachmann K, Riggs J. 1985. Inheritance of nuclear 2C DNA content in a cross between Microseris douglasii and M. bigelovii (Asteraceae). Biologisches Zentralblatt 104: 269–276. [Google Scholar]
- Rayburn AL, Biradar DP, Bullock DG, McMurphy LM. 1993. Nuclear DNA content in F1 hybrids of maize. Heredity 70: 294–300. [Google Scholar]
- Rees H, Hazarika MH. 1969. Chromosome evolution in Lathyrus Chromosomes Today 2: 158–165. [Google Scholar]
- Resslar PM, Stucky JM, Miksche JP. 1981. Cytophotometric determination of the amount of DNA in Arachis L. sect. Arachis (Leguminosae). American Journal of Botany 68: 149–153. [Google Scholar]
- Rieseberg LH, Van Fossen C, Desrochers AM. 1995. Hybrid speciation accompanied by genomic reorganization in wild sunflowers. Nature 375: 313–316. [Google Scholar]
- Rosato M, Chiavarino AM, Naranjo CA, Hernandez JC, Poggio L. 1998. Genome size and numerical polymorphism for the B chromosome in races of maize (Zea mays ssp. mays, Poaceae). American Journal of Botany 85: 168–174. [PubMed] [Google Scholar]
- Rotreklová O, Bureš P, Grulich V. 2004. Chromosome numbers for some species of vascular plants from Europe. Biologia (in press). [Google Scholar]
- Schmid M, Ziegler CG, Steinlein C, Nanda I, Haaf T. 2002. Chromosome banding in Amphibia XXIV. The B chromosomes of Gastrotheca espeletia (Anura, Hylidae). Cytogenetic and Genome Research 97: 205–218. [DOI] [PubMed] [Google Scholar]
- Skalińska M, Malecka J, Izmailow R. et al. 1974. Further studies inchromosome numbers of Polish angiosperms. X. Acta BiologicaCracoviensia, Series Botanica 17: 133–164. [Google Scholar]
- Soó R. 1970.A Magyar flóra és vegetáció rendszertani növényföldrajzi kézikönyve. Budapest: Akadémiai Kaidó. [Google Scholar]
- Srivastava S, Lavania UC. 1991. Evolutionary DNA variation in Papaver Genome 34: 763–768. [Google Scholar]
- Šiško M, Ivanič A, Bohanec B. 2003. Genome size analysis in the genus Cucurbita and its use for determination of interspecific hybrids obtained using the embryo-rescue technique. Plant Science 165: 663–669. [Google Scholar]
- Talavera S. 1974. Contribución al estudio cariológico del género Cirsium en la Península Ibérica. Lagascalia 4: 285–296. [Google Scholar]
- Thalmann C, Guadagnuolo R, Felber F. 2000. Search for spontaneous hybridization between oilseed rape (Brassica napus L.) and wild radish (Raphanus raphanistrum L.) in agricultural zones and evaluation of the genetic diversity of the wild species. Botanica Helvetica 111: 107–119. [Google Scholar]
- Thibault J. 1998. Nuclear DNA amount in pure species and hybrid willows (Salix): a flow cytometric investigation. Canadian Journal of Botany 76: 157–165. [Google Scholar]
- Tischler G. 1934. Die Bedeutungen der Polyploidie für die Verbreitung der Angiospermen, erläutert an den Arten Schleswig-Holsteins, mit Ausblicken auf andere Florengebiete. Botanischer Jahresbericht 67: 1–36. [Google Scholar]
- Tofts R. 1999. Biological flora of the British Isles. Cirsium eriophorum (L.) Scop. Journal of Ecology 87: 529–542. [Google Scholar]
- Torrell M, Vallès J. 2001. Genome size in 21 Artemisia L. species (Asteraceae, Anthemideae): systematic, evolutionary, and ecological implications. Genome 44: 231–238. [PubMed] [Google Scholar]
- Wagenitz G. 1987.Cirsium Mill. em. Scop. In: Hegi G, Illustrierte Flora von Mitteleuropa, 2nd edn Vol. 6/4. Berlin et Hamburg: Paul Parey Verlag, 866–916 [Google Scholar]
- Wakamiya I, Newton RJ, Johnston JS, Price HJ. 1993. Genome size and environmental factors in the genus Pinus American Journal of Botany 80: 1235–1241. [Google Scholar]
- Watanabe K, Yahara T, Denda T, Kosuge K. 1999. Chromosomal evolution in the genus Brachyscome (Asteraceae, Astereae); statistical tests regarding correlation between changes in karyotype and habit using phylogenetic information. Journal of Plant Research 112: 145–161. [Google Scholar]
- Werner K. 1976.Cirsium Miller. In: Tutin TG, Heywood VH, Burges NA, Moore DM, Valentine DH, Walters SM, Webb DA, eds. Flora Europaea, Vol. 4. Cambridge: Cambridge University Press, 232–242. [Google Scholar]
- Wulff HD. 1937. Chromosomenstudien an der schleswig-holsteinischen Angiosperm-Flora. I. Berichte der Deutschen Botanischen Gesellschaft 55: 262–269. [Google Scholar]
- Zonneveld BJM. 2001. Nuclear DNA content of all species of Helleborus (Ranunculaceae) discriminate between species and sectional divisions. Plant Systematics and Evolution 229: 125–130. [Google Scholar]
Associated Data
This section collects any data citations, data availability statements, or supplementary materials included in this article.