

Abstract
Many psychotropic substances used either for medications or illicit recreational purposes are able to produce an increase in extracellular serotonin (5HT) in the CNS. 5HT is well known to improve mood, however, only when the levels of its release are in an appropriate range. Excessive 5HT is harmful, and will generally result in serotonin syndrome. To date, clinical diagnosis of serotonin syndrome relies exclusively on observation of symptoms because of a lack of available laboratory tests. The goal of the present study was to characterize the onset of the syndrome using laboratory settings to determine excessive 5HT-evoked neurological abnormalities. Experiments were carried out in rats with the syndrome being elicited by three groups of 5HT-promoting drugs: 1) (±)-3,4-methylenedioxymethamphetamine (MDMA); 2) a combination of the monoamine oxidase inhibitor clorgyline with the 5HT precursor 5-hydroxytryptophan; 3) clorgyline combined with the serotonin-selective reuptake inhibitor paroxetine. The onset of the syndrome was characterized by electroencephalography (EEG), tremor and brain/plasma 5HT tests. We found that a mild syndrome was associated with reduced EEG amplitudes while a severe syndrome strongly with seizure-like EEG activity and increased tremor activity. The occurrence of the syndrome was confirmed with microdialysis, showing excessive 5HT efflux in brain dialysate and the increased concentration of unbound 5HT in the plasma. Our findings suggest that the syndrome onset can be revealed with EEG recording, measurements of tremor activity and changes of unbound 5HT concentration in the plasma.
Keywords: EEG, MDMA, SSRI, serotonin, plasma, antidepressant
Elevating levels of extracellular serotonin (5-hydroxytryptamine; 5HT) in the central nervous system (CNS) has become a standard treatment of choice for improving psychological mood and many other mental diseases (Aikins et al. 2011; Parker and Brotchie 2011). Such neuroactive properties are exploited by 3,4-methylenedioxymethamphetamine (MDMA, ecstasy), a popular illicit recreational drug often used at parties and in nightclubs. Although a small degree of 5HT elevation is beneficial to mental health, excessive 5HT is potentially harmful, most likely resulting in serotonin syndrome (Baumann et al. 2008b; Zhang et al. 2009). It has been reported that almost all classes of 5HT-promoting drugs are capable of causing the syndrome (Boyer and Shannon 2005), including, but not limited to, selective serotonin reuptake inhibitors (SSRIs), monoamine oxidase inhibitors (MAOIs), vesicle-releasing agents (i.e., MDMA) and certain opioids (e.g., tramadol). When the syndrome occurs in patients, it can be life-threatening. Due to the lack of laboratory tests, it is prone to be misdiagnosed and mistreated as a different mental disorder (Morrison and Rowe 2012).
Electroencephalography (EEG) is a sensitive measure by which the brain activity is reliably converted into wave rhythms that can be visualized and subsequently analyzed in a quantitative manner. Thus, EEG as a powerful and established tool is widely used in clinical research and diagnosis for determining seizure onset and activity. Although seizures are likely to occur during serotonin syndrome (Ben-Abraham et al. 2003; Duffy and Swart 2006; George et al. 2008), very little is known about the onset of a seizure in response to excessive 5HT. In addition, characterization of seizure activity is important not only for understanding neuropathological development of the syndrome but also for distinguishing the syndrome from other mental diseases such as anxiety and bipolar disorders.
The purpose of the present study was threefold: (a) to determine characteristic changes in excessive 5HT-evoked behavioral seizures and seizure-like EEG waves; (b) to establish whether plasma 5HT (unbound and total) could be used as a biomarker for diagnosing the onset of serotonin syndrome; (c) to explore the similarities and differences in the syndrome caused by different classes of drugs. To achieve this goal of the study, the syndrome was examined using three different treatments involving 4 different classes of psychotropic drugs. 5-Hydroxytryptophan (5HTP) is well known as an over-the-counter antidepressant (Turner et al. 2006). The syndrome produced by 5HTP in combination with the MAOI clorgyline (CLG) is one of the model organisms used for preclinical research (Shioda et al. 2004; Krishnamoorthy et al. 2010). MDMA was examined because of its ability to cause the syndrome in an ambient temperature-dependent manner both in human patients (Parrott 2002) and animals (Malberg and Seiden 1998). Paroxetine (PRX) is a SSRI used to treat major depression and potentially causes the syndrome in the presence of MAOIs (Gillman 2005).
Materials and methods
Animal preparation
Male adult Sprague-Dawley rats weighing 300–350 g were purchased from the Charles-River Laboratories (Raleigh, NC, USA) and housed under standard conditions (lights-on from 07:00–19:00, humidity at 40–70%). Food and water were continuously available. All procedures involving animals were carried out in accordance with the NIH guidelines and approved by the IACUC at Florida Atlantic University.
Chemicals
Clorgyline (CLG; N-methyl-N-propargyl-3-(2,4-dichlorophenoxy)propylamine hydrochloride; Sigma-Aldrich, St. Louis, MO, U.S.A) and 5-hydroxytryptophan (5HTP; Sigma-Aldrich, St. Louic, MO, USA) were dissolved in saline (0.9% NaCl) and injected subcutaneously. MDMA (±-3,4-methylenedioxymethamphetamine provided by the National Institute on Drug Abuse, Rockville, MD. USA) was dissolved in 0.9% NaCl and administered intraperitoneally. Paroxetine (PRX; US Pharmacopeia, Rockville, MD, USA) was suspended in sterile water and injected intraperitoneally at a constant volume of 1 ml/kg in rats previously treated with 2 mg/kg CLG daily for 3 consecutive days.
Protocols for serotonin syndrome
Since pharmacological profiles between 5HT-promoting drugs are strikingly different, the syndrome intensity can vary widely, depending on sequence of drug administration and ambient environments. To elicit the syndrome reproducibly, drug administration procedures in rats were carried out according to respective protocols as illustrated in fig. 1.
Fig. 1.

Schematic diagram of 3 sets of experiments for testing serotonin syndrome induced by different 5HT-promoting drugs: CLG+5HTP at 22 °C (Experiment 1); MDMA at 22 °C in contrast to 32 °C (Experiment 2); PRX+CLG at 22 °C (Experiment 3).
Experiment 1
All tests were conducted in freely behaving rats at ambient temperature of 22 °C (± 1 °C). CLG at a dose of 2 mg/kg was injected 4 h before baseline collections followed by injection of 5HTP (5 mg/kg or 15 mg kg, s.c.) into experimental groups or 0.9% NaCl (3 ml/kg, s.c.) into control groups. Note that it is crucial to have a 4-h time gap between two administrations, since the effect of CLG on serotonergic neurons is relatively slow but long-lasting (Fletcher and Yu 1989) whereas the effect of 5HTP is relatively rapid and transient.
Experiment 2
A temperature-controlled chamber was set at either 22 or 32 °C (±1 °C) before experiments. After habituation for at least 2 h, two baseline samples were collected followed by injection of MDMA or vehicle as illustrated in fig. 1.
Experiment 3
Tests were conducted at 22 °C. Animals were pretreated with 2 mg/kg CLG once daily for 3 consecutive days and challenged with CLG plus PRX or vehicle on day 4.
Measurement of motor seizures and EEG signals
Motor seizures were monitored at 5-min intervals for a total of 30 min and carried out between 60 and 90 min after drug injections. Motor seizure was determined by rating animal behavior according to a modified Racine’s scale (Racine 1972). Briefly, motor seizure was scored on a 0–4 scale: 0, no signs of motor seizure; 1, head shakes or/and isolated myoclonic twitches; 2, tonic-clonic convulsions; 3, tonic rigid extension of limbs; 4, loss of posture. Rating was conducted by two experienced raters blind to drug injections. All scores were pooled, averaged and expressed in tables as mean (±s.e.m).
EEG electrodes were pre-implanted on animal skulls according to a surgical procedure preapproved by the IACUC. Briefly, rats were anesthetized with a combination of xylazine (4 mg/kg i.p.) and ketamine (80 mg/kg i.p.). Two stainless steel electrodes were anchored on the skull over the frontal cortex (AP +2 mm relative to the bregma, ML ±2 mm relative to the midline) as positive and reference electrodes for surface EEG recording. A third electrode was implanted on the occipital bone over the cerebellum to serve as the negative electrode. Two wires were surgically inserted into deep neck muscles serving as electromyogram (EMG) electrodes. After surgery, rats were housed individually and allowed a week for recovery. The day before EEG/EMG recording, animals were placed overnight in the recording chamber shielded with a metal mesh for blocking electromagnetic interference from surrounding environment. The following day, recording began with two baseline measurements and then 120 min of post-5HTP or MDMA recordings. In the case of PRX-induced syndrome, recordings lasted 6 h.
Electroencephalograms were analyzed off-line. Note that only wakeful EEG activity that lasted at least 30 s was used as a baseline for comparing drug-induced responses. EMG potentials were used for verifying the wakeful states as described in the literature (Jacobs and Donoghue 1991). Since time courses of syndrome development differ between drugs, the time frame for the data analysis was chosen as intervals of 30 min in the 5HTP+CLG and MDMA studies and 60 min in the CLG+PRX study. Each time frame was the mean of triplicate samples consisting of the start, middle and end of each time period, in order to minimize the chance of error. Each sample was a 30-s duration. The size of Fast Fourier Transform (FFT) was set at 64K and changes in EEG waves were expressed as power density (μV2). The cut-off frequencies performed using the Chart 5.3 software were set at 0.5–4 Hz as a delta band, 4–8 Hz as a theta band, 8–12 Hz as an alpha band and 12–30 Hz as a beta band. The spectral power density data (μV2/Hz) were then transferred to Microsoft Excel for calculation. For the sake of clarification, data presented in the figures are at a frequency resolution of 0.5 Hz intervals. To obtain overall evaluation, the power spectral density was computerized as percent (%) changes from the baseline values.
Tremor test
Tremor and other types of neuromuscular hyperactivity (such as clonus and myoclonus) were instrumentally measured and quantified using a force-plate actometer. Methods of calibration and details of the measurement had been described elsewhere (Fowler et al. 2001). Briefly, the force-plate actometer purchased from BASi Corp (Model FPA-I; West Lafayette, IN, USA) consists of a force-sensitive plate at a resolution of 200 Hz, a sound-attenuation chamber, a computerized data-acquisition board and analysis system software (FPA 1.10.01). The animal was first put in the apparatus for a 30 min habituation period. Afterwards the animal was taken out for drug treatment and then immediately put back for a 90 min tremor recording session. Between each test, animal waste (i.e., feces, urine, saliva and furs) on the plate was thoroughly cleaned with paper towels followed by a deodorant treatment (70% ethanol, 1% acetic acid and then water). Trace data were automatically stored on the hard drive for offline analysis. Changes in muscular contraction force were revealed through power spectral analysis and expressed as a percent of body weight (% bw; force variation independent of body weight). Note that the unit for changes in the power force was arbitrary.
Extracellular brain 5HT measurement
The guide cannula was surgically implanted in place one week prior to microdialysis experiments. The microdialysis probe (exchange length 2.5 mm; molecular weight cut-off 18 kD) was inserted through the guide cannula into the prefrontal cortex (PFC) 12 h before the experiments. Stereotaxic coordinates for the probe were AP +3.7 mm relative to the bregma, ML 0.7 mm relative to the midline, and DV 2.5–5.0 mm relative to the skull surface. After probe insertion, rats were placed in a temperature-controlled chamber that allowed animals to move freely in a microdialysis setting (Raturn® system, Bioanalytical System Inc., IN, USA). The dialysis probe was perfused overnight with artificial cerebrospinal fluid (aCSF) consisting of 140 mM NaCl, 3.0 mM KCl, 1.5 mM CaCl2, 1.0 mM MgCl2, 0.25 mM NaH2PO4, and 1.0 mM Na2HPO4. The aCSF was pumped at a rate of 1.0 μl/min). The next day, experiments started with two baseline collections followed by six post-treatment samples. Samples were stored at −80 °C prior to 5HT analysis.
Samples were loaded to a refrigerated auto-injector (SIL-10Avp, Shimadzu, Maryland, USA) and analyzed by high-performance liquid chromatography with electrochemical detection (HPLC-EC). 5HT was separated on a reverse-phase column (Eicompak, CA5 ODS; 2.1 mm diameter × 150 mm; Eicom). The mobile phase for the separation was 0.1 M phosphate buffer consisting of 50 mg/L EDTA, 500 mg/L sodium octanesulphonate and 10 ml/L methanol, pH 6. The measurement was conducted with an electrochemical detector (HTEC-500; Eicom, Japan). The amount of 5HT in samples was calculated by comparison with the external 5HT standard (1 pg/10 μl; 5HT creatinine sulfate dissolved in acidic solvent containing 0.1 N perchloric acid, 100 mM EDTA, pH 3.0). Changes in 5HT efflux are expressed as a fold increase above baseline.
Measurement of circulating 5HT
In plasma, there are two fractions of 5HT. One fraction is bound to carrier proteins while the rest remains freely circulating as unbound 5HT (Anderson et al. 1987; Breyer-Pfaff et al., 1989). Since unbound 5HT is considered to exert a functional role in the circulatory system, we examined whether the syndrome onset was associated with this particular fraction. Separate experiments were carried out to determine changes in total 5HT (both the bound and unbound fractions) in plasma samples. Given that changes in plasma 5HT might be due to platelet 5HT being secreted to plasma in response to 5HT-promoting drugs, we also performed platelet 5HT secretion tests using in vitro microdialysis. Thus, we examined unbound plasma 5HT, total plasma 5HT and platelet 5HT secretion. The following are the methods to measure these 5HT molecules.
Unbound 5HT in the plasma
Rats were anesthetized with 2% isoflurane and a cut was made over a lateral tail vein located at approximately 4–6 cm from the tip of tail using a sterile scalpel blade and adhesive bandages were used to protect the incision but were temporarily removed for the next sample collection under isoflurane anesthesia. Ten μl whole blood was collected each time into a heparinized microcapillary tube (Scientific glass, Inc., Rockwood, TN, USA) and transferred immediately to a test tube containing 1990 μl heparinized Ringer’s buffer (155 mM NaCl, 5 mM KCl, 2 mM CaCl2, 1 mM MgCl2, 2.4 mM NaHCO3, 2 mM Tris-Cl, 10 IU/ml heparin, pH 7.4). The test tube was equipped with a microdialysis probe (2.5 mm exchange surface at cut-off 18 kD) which was perfused with Ringer’s buffer at room temperature of 22 °C. The perfusion rate was set at 1.0 μl/min. Sample collection began as soon as the perfusion started and a total of 10 μl microdialysis fluids from each sample were collected. The probe recovery for 5HT was 14.1% (±1.1; N = 8). To determine how much of plasma 5HT in rats was unbound, a separate experiment was carried out using drug-naïve rats. Percentage of unbound 5HT in the plasma was estimated by the following equation: .
Total 5HT in the plasma
In separate experiments, 20–40 μl whole blood from the lateral tail vein of rats under the influence of 2% isoflurane was collected with heparinized microcapillary tubes and centrifuged for 5 min using READACRIT centrifuge (Parsippany, NJ, USA) to separate the specimen into three fractions: upper (plasma), middle (platelets) and bottom (red and white blood cells) layers. The middle and bottom layers were discarded. The plasma portion was transferred into a microcentrifuge tube and 5 μl of plasma was diluted in a centrifuge tube to 1:200 by adding to 995 μl of acidic solvent containing 0.1 N perchloric acid, 100 mM EDTA, pH 3.0, and centrifuged at 25,000 × g for 30 min at 4 °C. A 10 μl supernatant was used to estimate the total plasma 5HT concentrations using high-performance liquid chromatography with electrochemical detection as described above. Data in figures are expressed as fold increases relative to baseline.
In vitro platelet tests
Drug-naïve animals were briefly anesthetized with 2% isoflurane and the lateral tail veins were nicked with a sterile blade. Whole blood at a volume of 10 μl was obtained through heparinized microcapillary tubes, and immediately diluted 1:20 with 190 μl of Ringer’s buffer containing 10 IU/ml heparin at room temperature of 22 °C. For each drug group, the dilution was divided into five aliquots: two aliquots as baseline samples (base-1 and base-2) that were further diluted 1:10 with heparinized Ringer’s buffer and three aliquots for drug treatments, which were diluted 1:10 with heparinized Ringer’s buffer mixed with drugs at three different concentrations (vehicle, low and high concentrations of each drug group). Microdialysis probes were placed into each of these five sample tubes and perfused with Ringer’s buffer at a flow rate of 1.0 μl/min. Dialysate efflux was collected at 30 min intervals for a total of 120 min. Each drug concentration was replicated 6 times from at least three different donor rats. 5HT levels in the dialysate were determined through HPLC-ECD. Data are expressed as fold increases relative to baseline (mean ± s.e.m).
Data analysis
All data are expressed as mean (± standard error of the mean). Unless otherwise mentioned, repeated measures ANOVA were used to determine statistical differences between treatments at a specific sampling time. The significant differences were set at 0.05. If significant F-values were obtained, separate one-way ANOVA was carried out to compare the difference between vehicle control and drug treatment followed by Scheffe post-hoc tests. In some cases student t-test was used to determine a statistical significance level when appropriate.
Results
Experiment 1: Syndrome induced by CLG+5HTP
Animals were pretreated with 2 mg/kg CLG, 4 h before baseline collections followed by injection of vehicle or 5HTP as illustrated in fig. 1.
Experiment 1a: Seizures measured with a behavioral scale and EEG
Motor seizures were not apparent after injection of vehicle or 5 mg/kg 5HTP in CLG-pretreated rats (table 1). In contrast, upon injection of 15 mg/kg 5HTP, animals developed behavioral seizures closely corresponding to stage 4 of a modified Racine’ scale (Racine 1972). Following this, behavioral seizures were characterized on EEG.
Table 1.
Behavioral seizure in response to CLG+5HTP
| 5HTP doses | Scale (N=4) |
|---|---|
| 0 (saline) | 0 |
| 5 mg/kg | 0.52 ± 0.10 |
| 15 mg/kg | 3.83 ± 0.06 |
Fig 2A–B depicts three sets of raw traces representative of EEG waves during the time-frame of 0–30 min, 60–90 min and 90–120 min after injection of vehicle after challenge with 15 mg/kg 5HTP in CLG-pretreated animals. Each data set comprises 3 samples of a 30-s trace obtained at the beginning, middle and end of each time-frame. Compared to baselines, vehicle injection had no effect on EEG waves. In contrast, 15 mg/kg 5HTP evoked at least 3 types of repetitive bursts. To our knowledge, these bursts have not been described explicitly in previous studies on serotonin syndrome. For the sake of clarity, we described them as a-, b- and c-waves according to the time sequence present in the figure. As shown in fig. 2B, a-waves were a low-amplitude oscillation in the theta range (~6 Hz), lasting approximately 2–5 s. We observed that this wave pattern was strongly associated with forepaw treading behavior. B-waves had very low frequency (2 Hz), lasting 200–500 msec. The amplitudes varied widely. This type of wave was observed to correspond to the head shaking behavior that occurred in the syndrome. The presence of c-waves was associated with head waving behavior. Amplitudes of c-waves were usually very high, which could be 500 μV, approximately 10 times greater than normal EEG amplitudes.
Fig. 2.

Effect of CLG+5HTP on EEG signals. A–B, Example of raw EEG traces after vehicle (A) and 5HTP injection (B). Traces are representative of 30-s periods of EEG signals recorded at the start (top trace), middle and the end (bottom trace) of each 30-min time frame. Time bar, 1 s; voltage bar, 0.25 mV. B, Bursts/waves of synchronized EEG discharges induced by 15mg/kg 5HTP: a-waves (likely associated with forepaw treading), b-waves (corresponding to head shakes) and c-waves (likely corresponding with head waving behavior). C, Analysis of the power spectral density (μV2/Hz) across EEG frequency between 0.5–30 Hz at the time frame between 60–90 min. Inset shows cumulative changes in delta, theta, alpha and beta bands. D, Time course of changes in normalized power density. Data are normalized to percent (%) of baseline (± s.e.m). *p < 0.05 and **p < 0.01 vs. control (CLG+vehicle).
One striking observation on the EEG recording was that 5HTP-induced waves were increasingly synchronized in a time-dependent manner, showing increased amplitudes and reduced rhythms (fig. 2B). The visual observation was confirmed with power density analysis on EEG frequency (see details in Materials and Methods). Fig. 2C shows changes in the mean of power density (μV2/Hz) over the time-frame between 60–90 min. Injections caused significant differences between vehicle and drug groups [F(2,11) = 5.034, P = 0.028]. Specifically, 15 mg/kg 5HTP evoked a significant elevation mainly in the delta and theta bands (P<0.05), but not alpha or beta bands (P>0.05). Next, as shown in Fig. 2D, we evaluated time-dependent changes in power density. Data analysis revealed a significant difference between vehicle and 15 mg/kg 5HTP groups [F(1,8) = 9.708, P = 0.041], particularly over the time-frames of 60–90 and 90–120 min.
Experiment 1b: Tremor activity
Fig. 3A–B displays three sets of raw traces showing continuous 60 s (20 s/sweep) muscular activity clipped from the time-frames of 0–30 min, 30–60 min and 60–90 min after injection of vehicle or challenged by 15 mg/kg 5HTP in CLG-pretreated animals. It appeared that vehicle alone had no effect on neuromuscular excitability. In contrast, the challenge with 15 mg/kg 5HTP caused a tremor response, showing a progressive increase in amplitude of force variation (fig. 3B). For a better comparison, the tremor activity was quantitatively expressed as percent change relative to body weight (% bw). Fig. 3C depicts the force power density at frequencies from 5 Hz to 25 Hz during the time-frame of 30–60 min. Statistical analysis revealed a highly significant main effect of drug dose [Fdose(2,12) = 7.042, P = 0.0095] and also frequency [Ffrequency(39,78) = 1.78, P = 0.0033]. We next analyzed the effect on the power density at all three time-frames, demonstrating a significant effect of drug dose [F(2,12) = 15.991, P = 0.0004], particularly in the time- frames of 30–60 and 60–90 min (fig. 3D).
Fig. 3.

Tremor activity measured by a force-plate actometer in the syndrome caused by CLG+5HTP. A–B, Example of 3 continuous traces recorded at the beginning of each 30-min time frame in response to CLG+5HTP with the 5HTP dose of 0 (vehicle; A) and 15 mg/kg (B). Note that there were a total of 90 sweeps (20 s/sweep) for 30 min. Time bar, 1 s; force bar, % body weight (% bw). B, Irregular traces with variation in amplitude indicative of neuromuscular hyperactivity after 5HTP injection. C, Analysis of the force power across frequency between 5–25 Hz in the time-frame between 30–60 min. For the sake of clarification, data are expressed as the frequency resolution of 0.5 Hz. D, Time course of tremor activity in response to CLG+5HTP. *p < 0.05 and **p < 0.01 vs. control animals.
Experiment 1c: Involvement of 5HT
5HT efflux was determined at the prefrontal cortex (PFC) as a representative of CNS. Extracellular 5HT prior to 5HTP injection was 0.52 pg/30 min/sample (±0.04 pg; n=17). As shown in fig. 4A, challenge injections of 5HTP in CLG-pretreated animals caused an excessive increase in 5HT efflux. We noted that a 10-fold increase over the baseline was relatively transient following 5 mg/kg 5HTP but sustained for a long period in response to 10 mg/kg. Statistical analysis revealed that the main effect of dose on cortical 5HT was significantly different between three groups [F(2,14) = 7.584, P = 0.0059].
Fig. 4.

Changes in both central and peripheral 5HT at the onset of serotonin syndrome induced by CLG+5HTP. Data are expressed as mean ± s.e.m. (N= 5–6). Arrows indicate the time point of drug injection to rats (2 mg/kg CLG combined with vehicle or 5HTP at doses of 5 or 15 mg/kg) while the horizontal bar represents the time period of drugs directly added into the in vitro platelet test tube (2 μM CLG alone or combined with 5HTP at 5 or 15 μM). A, Injection of CLG+5HTP produced a dose-dependent increase of extracellular 5HT in the prefrontal cortex. B, Injection produced a dose-dependent increase of unbound plasma 5HT. C, Injection caused a dose-dependent increase of total plasma 5HT. D, Addition of CLG+5HTP to heparinized Ringer’s buffer had no effect on 5HT released from platelets. *p < 0.05, **p < 0.01, ***p < 0.001 vs. respective control.
The mean baseline of unbound 5HT in plasma after 1:200 dilution of blood specimens was 18.55 nM (±2.01 nM, N=18; with no correction for probe recovery). As shown in fig. 4B, injection of 5HTP produced a dose-dependent increase in unbound 5HT [F(2,15) = 90.02, P < 0.0001]. The maximum increase was nearly 10-fold above baseline. However, the increased plasma 5HT was relatively lower than that in the brain in response to the respective dosage (5 mg/kg, F(1,10) = 3.406, P = 0.0947; 15 mg/kg, F(1,9) = 6.654, P = 0.0297). Since some 5HT molecules bound to plasma protein were undetectable using microdialysis, we decided to test whether measurement of total plasma 5HT could yield a result resembling that found in the brain. The mean baseline of total plasma 5HT was 0.98 ± 0.09 μM (n=25). As shown in fig. 4C, 5HTP produced a time- and dose-dependent effect on total plasma 5HT. This conclusion was fully supported by statistical analysis, demonstrating that there were significant principal effects of dose treatments [F(2, 12) = 30.596, P < 0.0001] and sampling time [F(5,60) = 4.835, P =0.0009]. The maximum increase was 10-fold over baseline. Interestingly, there was no significant difference between total plasma 5HT and extracellular brain 5HT in response to 15 mg/kg 5HTP [F(1,8) = 0.851, P = 0.03834).
Next, we tested what percentage of unbound 5HT normally remains in plasma. After examining 8 drug-naïve animals, our data showed that unbound 5HT in the plasma dialysates was 0.32 ng/10 μl (±0.06). Based on the 14.1% relative recovery rate, unbound plasma 5HT was estimated to be 2.30 ±0.44 ng/10 μl (~1.31 μM). Further tests showed that total plasma 5HT was 3.38 ± 0.51 ng/10 μl (~1.92 μM). Thus, unbound plasma 5HT was estimated to be 63.06 ± 5.69% of total plasma 5HT.
We tested whether the increase of 5HT in plasma was derived from platelets in response to CLG+5HTP. As shown in fig. 4D, 2 μM CLG in combination of 5 μM or 15 μM 5HTP had no effect on 5HT released from platelets under our in vitro experimental conditions [F(2,15) = 0.03, P = 0.865].
Experiment 2: Syndrome induced by MDMA
All animals used for this set of experiments were drug-naïve and had acclimated to temperature of 22 or 32 °C before vehicle or MDMA injection.
Experiment 2a: Behavioral vs. EEG seizures
Motor seizures were not apparent in rats injected with 2 mg/kg MDMA, but developed into stage 1 (Racine’s scale) following 10 mg/kg at ambient temperature of 22 °C and into stage 3 in response to 10 mg/kg at 32 °C (Table 2).
Table 2.
Behavioral seizure following MDMA
| 5HTP doses | Scale (N=4) |
|---|---|
| 0 (saline) | 0 |
| 2 mg/kg | 0 |
| 10 mg/kg at 22 °C | 0.73 ± 0.04 |
| 10 mg/kg at 32 °C | 2.64 ± 0.06 |
Although mild motor seizures were observed, 10 mg/kg MDMA at 22 °C did not induce seizure-like EEG bursts. On the contrary, there was a small but significant reduction in EEG amplitude (*p < 0.05; fig. 5A–C). Note that the maximum reduction of 10 mg/kg was to a similar level as found with 2 mg/kg. However, importantly the effect of 10 mg/kg was long-lasting (fig. 5D).
Fig. 5.

Effect of MDMA at 22 °C on EEG activity. Raw EEG traces represent basal activity (left trace, time of zero) and responses to injections (right trace; time of 45 min). Time bar, 0.5 sec; voltage bar, 50 μV. Bar graphs represent the mean (± s.e.m) of normalized power density at the timeframe between 30–60 min. A, Saline injection had no effect on EEG activity. B, A small reduction in EEG activity was induced in rats injected with 2 mg/kg MDMA. *p < 0.5, paired t-test. C, A small reduction was induced by 10 mg/kg. *p < 0.5, paired t-test. D, Time course of changes in normalized EEG activity in response to MDMA at 22 °C. Note the data normalized as percent of baseline are expressed as mean ± s.e.m. *p < 0.05 vs. control animals.
For the next step, the role of warm ambient temperature in the development of seizures was examined in rats at 32 °C. MDMA at 10 mg/kg evoked many high-amplitude bursts, predominantly at 60 min after injection (fig. 6). These bursts strongly resembled the c-waves that occurred in the CLG+5HTP test. However, activity similar to a- or b-waves was not observed in the MDMA study. Analysis of power density revealed a reduction in EEG activity at 30 min but an increase at the time-frames of 90 and 120 min (fig. 6).
Fig. 6.
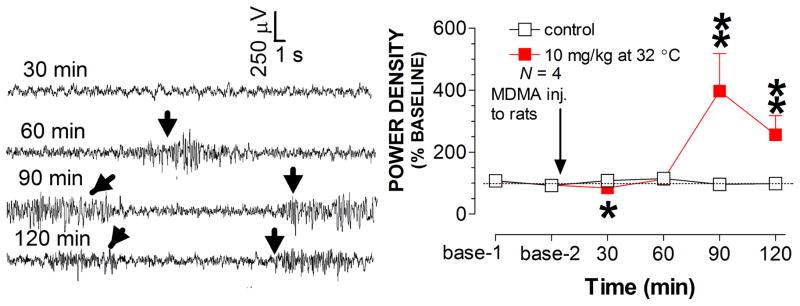
Effect of MDMA at 32 °C on EEG activity. Traces (30 sec/sweep) represent EEG activity at different time-frames following MDMA at 32 °C. Arrows indicate occurrence of seizure-like spikes. Line graph shows the time-course profile of normalized EEG activity. *p < 0.05 and **p < 0.01 vs. control animals.
Experiment 2b: Tremor activity
Fig. 7A–B shows 3 sets of raw traces representative of neuromuscular activity in the time periods of 0–30, 30–60 and 60–90 min after injection of saline or 10 mg/kg MDMA. No tremor-like activity was induced in the control group. In contrast, 10 mg/kg MDMA at ambient temperature of 22 °C produced a tremor-like neuromuscular response throughout the entire course of the 90 min experiment (fig. 7B). To determine the similarity and difference in tremor patterns from that produced by CLG+5HTP, tremor activity occurring between 30 min and 60 min was expressed as change in power density across the frequency range of 5–25 Hz (fig. 7C). Power spectral analysis revealed that the response to 10 mg/kg MDMA occurred predominantly in the frequency range of 5–10 Hz. Lastly, the time course of tremor activity was analyzed (Fig. 7D), demonstrating that MDMA produced both dose-dependent [Fdose(2,15)=14.67, P=0.0003] and time-dependent effects [Ftime(2,30)=17.238, P<0.0001].
Fig. 7.

Tremor activity measured by a force-plate actometer in the syndrome caused by MDMA at 22 °C. A–B, Example of 3 continuous traces recorded at the beginning of each 30-min time frame in response to vehicle (A) and 10 mg/kg MDMA (B). Time bar, 1 s; force bar, % body weight (% bw). B, Irregular traces with variation in amplitude indicate neuromuscular hyperactivity. C, Analysis of the force power across frequency between 5–25 Hz at the time-frame between 30–60 min. D, Time-course profile of tremor activity. *p < 0.05, ** p < 0.01, and *** p < 0.001 vs. control animals.
Due to technical limitations of the apparatus, tremor activity at 32 °C was not examined.
Experiment 2c: Involvement of 5HT
MDMA injection caused a dose- and time-dependent increase in extracellular 5HT in the prefrontal cortex [Fdose(2,15) = 7.331, P = 0.006; Ftime(5,10) = 11.093, P < 0.0001]. Specifically, MDMA at 2 mg/kg caused a brief (~30 min) but significant increase with the maximum level at 10-fold above the baseline. Remarkably, injection of 10 mg/kg caused an exceptionally large increase of up to 80 fold above the baseline (fig. 8A), with the duration of this excessive increase lasting for at least 150 min. Surprisingly, the warm temperature of 32 °C did not augment the effect of MDMA on 5HT, compared to that at 22 °C [Ftemperature(1,10) = 1.73, P = 0.2178]. The excessive level (defined as the increase over 10 fold above baseline) lasted for at least 90 min.
Fig. 8.

Changes in both central and peripheral 5HT at the onset of serotonin syndrome evoked by MDMA. Data are expressed as mean ± s.e.m. (N= 4–6). Arrows indicate the time points of drug injection to rats (vehicle, 2 or 10 mg/kg, i.p.) while the horizontal bar represents the time period of drugs adding into the in vitro platelet test tube (vehicle control, 2 or 10 μM MDMA). A, Injection of MDMA produced a dose-dependent increase of extracellular 5HT in the prefrontal cortex. B, Injection produced a dose-dependent increase of unbound plasma 5HT. C, Injection had no effect on total plasma 5HT. D, Addition of MDMA directly to heparinized Ringer’s buffer produced a concentration-dependent increase of 5HT released from platelets. *p < 0.05, **p < 0.01, ***p < 0.001 vs. respective control.
Injection of MDMA also caused a dose-dependent increase in unbound plasma 5HT examined by microdialysis [F(2,15) = 74.227, P < 0.0001]. As shown in fig. 8B, the maximum increase in response to 10 mg/kg MDMA was greater than 10 fold above baseline. Despite this, the increase was significantly less than that in extracellular brain 5HT [F(1,10) = 5.087, P = 0.0477]. We next determined changes in total 5HT in plasma. Injection of MDMA at either dose had no significant effect on total plasma 5HT, compared to vehicle injection (fig. 8C). This conclusion was confirmed by statistical analysis, showing that the difference between treatments was not significant [F(2,9) = 1.476, P = 0.2789). Lastly, we tested whether 5HT-containing platelets were involved in and contributed to the increase in unbound 5HT in plasma. As shown in fig. 8D, MDMA at 2 and 10 μM evoked a concentration-dependent increase in 5HT released from platelets under our in vitro experimental conditions [F(1,10) = 233.875, P < 0.0001]. Further post-hoc Scheffe tests revealed that the significant effect was primarily at 10 μM, but not at 2 μM (fig. 8D)
Experiment 3: Syndrome induced by CLG+PRX
All animals in this set of experiments had been pretreated with 2 mg/kg CLG once daily for 3 consecutive days (detailed in Materials and Methods). On day 4, experiments started with two baseline collections followed by injections of 2 mg/kg CLG combined with vehicle, 5 mg/kg PRX or 15 mg/kg PRX.
Experiment 3a: Behavioral and EEG-based seizures
While injection of CLG+veh in CLG-pretreated animals had no effect on motor seizures, injection of CLG combined with 5 mg/kg PRX or 15 mg/kg PRX caused stage 1 and stage 4 behavioral seizures, respectively (table 3).
Table 3.
Behavioral seizure in response to CLG+PRX
| PRX doses | Scale (N=4) |
|---|---|
| 0 (water) | 0 |
| 5 mg/kg | 0.89 ± 0.10 |
| 15 mg/kg | 3.81 ± 0.04 |
Fig. 9A depicts raw EEG traces (30 sec/sweep) representing the time-periods of 0–60 min, 60–120 min and 300–360 min. Injection of CLG combined with 15 mg/kg PRX evoked high amplitude bursts 400 μV at a frequency of 2 Hz. Most of the bursts are type b-waves similar to those observed in the syndrome induced by 5HTP in CLG-pretreated animals (see Fig. 2B). We also observed a-waves. Interestingly, except for one case, c-waves were not often observed in 5HT syndrome induced by CLG+PRX.
Fig. 9.

Effect of CLG+PRX on EEG signals. A, Example of raw EEG traces in response to CLG+PRX injection. Traces are representative of 30-s periods of EEG signals recorded at the beginning (top trace), middle and end (bottom trace) of each 30-min time-frame. Time bar, 1 s; voltage bar, 0.2 mV. Abnormal bursts of synchronized EEG discharges were induced: a-waves (corresponding to forepaw treading), and b-waves (corresponding to head shakes). B, Analysis of the power spectral density (μV2/Hz) across EEG frequency between 0.5–30 Hz in the time-frame between 5–6 h. Inset shows the cumulative changes in delta, theta, alpha and beta bands. C, Time-course profile of normalized power density. *p < 0.05 vs. control (CLG+vehicle).
Fig. 9B depicts changes in power density plotted against delta, theta, alpha and beta bands over the time-frame of 300–360 min. Injection of CLG plus 15 mg/kg PRX had a significant effect on the delta band (P<0.05), but not other bands (fig. 9B inset). To minimize individual variables or differences, the density changes were normalized as a percentage relative to the respective baseline as depicted in fig. 9C. Statistical analysis revealed that there is a significant difference between treatments [F(2,14) = 11.68, P = 0.001]. Specifically, the power density (reflecting EEG amplitude) was reduced in response to CLG+PRX at the PRX dose of 5 mg/kg. In contrast, there was an increase in the power density following CLG combined with 15 mg/kg PRX.
Experiment 3b: Tremor activity
Tremor activity was determined in rats in the time-frame of 0–30, 30–60 and 60–90 min after being challenged with 2 mg/kg CLG combined with vehicle (fig. 10A) or with 15 mg/kg PRX (fig. 10B). Although muscular activity appeared to be changed at the beginning of measurement following CLG+vehicle, the effect did not last long and disappeared 30 min after injection. In contrast, the challenge injection of 2 mg/kg CLG combined with 15 mg/kg PRX produced a vigorous tremor response throughout the 90 min measurement period. Tremor activity in the time-frame of 30–60 min was then expressed as power density plotted against tremor frequency between 5–25 Hz. As shown in fig. 10C, CLG+PRX elicited changes in tremor activity across all frequency levels. Additionally, although no seizure-like EEG activity was found in response to CLG plus 5 mg/kg PRX (see fig. 9C), we observed that this dose combination caused changes in tremor activity. The observation was confirmed by offline power spectral analysis, demonstrating that there are a significant difference between treatments over this time- frame [F(2,13) = 27.716, P < 0.0001]. Lastly, time course of tremor response to MDMA was determined as shown in fig. 10D. Statistical analysis revealed significant effects of drug doses [F(2,13) = 17.331, P = 0.0002] and sampling time [F(2,26) = 18.418, P < 0.0001].
Fig. 10.

Tremor activity measured by a force-plate actometer in the syndrome caused by CLG+PRX. A–B, Example of 3 continuous traces recorded at the beginning of each 30-min time-frame in response to CLG+PRX at the PRX dose of 0 (vehicle; A) and 15 mg/kg (B). Time bar, 1 s; force bar, % body weight (% bw). B, Irregular traces with variation in amplitude indicative of neuromuscular hyperactivity. C, Analysis of the force power across frequency between 5–25 Hz at the time-frame between 60–90 min. D, Time-course profile of tremor activity. *p < 0.05, **p < 0.01, and ***p < 0.001 vs. control animals (CLG+vehicle).
Experiment 3c: 5HT measurement
As the next step, extracellular 5HT in the prefrontal cortex was used to estimate the severity of serotonin syndrome caused by CLG+PRX. The basal level in rats pretreated with CLG daily for 3 days was at 3.35 pg/60 min/sample (±0.34; n=16). Challenge injections on day 4 with CLG+PRX at the PRX doses of 5 and 15 mg/kg caused a dose-dependent increase (fig. 11A). Statistical analysis indicated that there was a significant difference between treatments [Fdose(2,13) = 46.211, P < 0.0001]. Specifically, both 5 mg/kg and 15 mg/kg PRX increased cortical 5HT in a time-dependent manner [Ftime(5,65) = 22.273, P < 0.0001]. The maximum increase was nearly 10-fold following 5 mg/kg PRX and 26–fold following 15 mg/kg PRX in combination with 2 mg/kg CLG. In the case of 15 mg/kg PRX combined with CLG, we noted that the total duration of the increased 5HT levels at over 10-fold above baseline (indicative of “excessive 5HT”) was at least 6 h throughout the experiment.
Fig. 11.

Changes in both central and peripheral 5HT in the serotonin syndrome evoked by CLG+PRX. Data are expressed as mean ± s.e.m. (N= 4–7). Arrows indicate the time points of drug injection to rats (2 mg/kg CLG combined with vehicle or PRX at doses of 5 or 15 mg/kg.) while the horizontal bar represent the time period of drugs adding into the in vitro platelet test tube (2 μM CLG alone or combined with 5 or 15 μM PRX). A, Injection of CLG+PRX produced a dose-dependent increase of extracellular 5HT in the prefrontal cortex. B, Injection produced a dose-dependent increase of unbound plasma 5HT. C, Injection had a small but significant effect on total plasma 5HT. D, Addition of CLG+PRX directly to heparinized Ringer’s buffer produced a concentration-dependent increase of 5HT released from platelets. *p < 0.05, **p < 0.01, ***p < 0.001 vs. respective control.
Unbound 5HT in plasma was then estimated by microdialysis. As shown in fig. 11B, unbound 5HT was significantly increased in a dose-dependent manner [F(2,15) = 43.127, P < 0.0001]. However, the maximum increase was only 8-fold above baseline. Clearly, the increase to this level was significantly lower than that for extracellular brain 5HT [5 mg/kg PRX+CLG, F(1,9) = 36.861, P = 0.0002; 15 mg/kg PRX+CLG, F(1,8) = 91.263, P < 0.0001]. Next, total 5HT in plasma was assayed at 1 h intervals. As shown in fig. 11C, the challenge injection of CLG+PRX on day 4 caused a significant increase in a dose- dependent manner [F(2, 12) = 14.574, P = 0.0006]. Specifically, CLG+PRX at the PRX dose of 15 mg/kg, but not 5 mg/kg, was found to cause an increase in total plasma 5HT. Apparently, the change was also less than that for extracellular brain 5HT [5 mg/kg PRX+CLG, F(1,7) = 33.47, P = 0.0007; 15 mg/kg PRX+CLG, F(1,8) = 165.242, P < 0.0001]. Lastly, we tested a possible role of 5HT-containing platelets in contributing to unbound plasma 5HT in response to PRX in combination with CLG. As shown in fig. 11D, there was a concentration-dependent increase in 5HT released from platelets following 5 μM and 15 μM of PRX in combination with 2 μM CLG [F(2,15) = 22.676, P < 0.0001]. The maximum increase was nearly 3-fold above baseline.
Discussion
The main purpose of this study was to characterize the onset of serotonin syndrome employing a laboratory setting, which may be valuable in the future for developing early detection of this iatrogenic illness in human patients. To carry this out, four classes of 5HT-promoting drugs were employed in three groups to elicit serotonin syndrome in rats. The syndrome induced by each group of drugs was characterized by examining behavioral and EEG-based seizures, evaluating tremor activity and measuring changes in extracellular brain 5HT, unbound and total plasma 5HT and 5HT released from platelets. We found that EEG-based seizures, tremor activity and unbound plasma 5HT were detected with a high sensitivity in our laboratory setting. However, changes of total plasma 5HT were not consistent across groups, suggesting that when plasma 5HT is used for estimating the syndrome onset, only unbound 5HT should be taken into account.
Changes in EEG activity in serotonin syndrome
We found that increased EEG amplitudes (mainly bursts of EEG activity) were strongly associated with seizures in the severe syndrome, although further characterization of such activity is warranted. In this study, seizure bursts were described as a-, b- and c-waves based on the temporal order of their presence in the syndrome produced by CLG+5HTP. Comparing wave patterns produced by the drugs, it appears that CLG+5HTP shared more similarities with CLG+PRX than MDMA. For instance, the b-waves were predominantly found in the syndrome induced by both of the drug combinations, but were much less prevalent in the MDMA-induced syndrome. The mechanism underlying this difference is not known. Microdialysis studies showed that all three groups produced an excessive increase in brain 5HT, suggesting that it is unlikely that the amount of 5HT released from presynaptic serotonergic neurons was responsible for the difference. Given that the animals used for 5HTP or PRX experiments were pretreated with CLG, it is possible that the pretreatments that could potentially sensitize postsynaptic neurons were likely to be a determining factor involved in the pattern of EEG discharges. In addition to drug pretreatments, other factors may also sensitize postsynaptic neurons. In support of this possibility, we found that EEG seizures were induced by 10 mg/kg MDMA in animals at the warm temperature of 32 °C, but not at the normal ambient temperature of 22 °C. This is consistent with previous studies demonstrating that warm environments may enhance the responsivity of the postsynaptic 5HT2ARs which are vulnerable to induction of serotonergic neurotoxicity (Zhang and Tao 2011). Future studies will be needed to more precisely evaluate the contribution of these potential mechanisms to the increase in the ability of 5HT2ARs to initiate an EEG discharge during the syndrome.
We found that seizure bursts took place mainly in the delta band (0.5–4 Hz), consistent with other studies conducted by epileptogenic drugs (Luttjohann et al. 2009; Veauthier et al. 2009). In previous studies, investigation of seizures related to serotonin syndrome mainly relied on analysis of EEG discharge patterns (Giorgi et al. 2005) and there were no quantitative measures that allowed one study to be compared to others. In this investigation, we successfully developed a computational procedure that transforms seizure-like graphic waves into a digital form, particularly at the onset of the syndrome. We noticed that the digital results of EEG seizure did not correspond to the motor seizure measurements (Racine’s scale) when determined by direct observation of the animals. For instance, EEG seizures were apparent only when the motor seizure intensity was greater than stage 3 at which the body trunk of rats appeared to have had relatively vigorous involuntary contraction and twitches in addition to tremor in extremities. Since tremor activity (e.g., clonus, myoclonus) was one of the criteria in determining the motor seizure intensity (Racine 1972), it is essential to test how changes in tremor activity were relevant to EEG seizures. By measuring tremor activity with a force plate actometer, it was found that some drug doses, such as MDMA at 22 °C (see fig. 7D) or CLG combined with 5 mg/kg PRX (fig. 10D), were sufficient to induce tremors but failed to evoke EEG seizures, suggesting that these two activities were not always coincident under our experimental conditions. Taken together, the results of the present study suggest that while high amplitude discharges indicative of seizure bursts in the brain may be associated with a severe syndrome, tremor activity in conjunction with reduced EEG amplitude tend to be indicative of a mild syndrome.
Role of extracellular brain 5HT in the development of serotonin syndrome
Although the normal range of extracellular 5HT in the human brain is not certain, preclinical studies on rats have demonstrated that 5HT in the cerebrospinal fluid is constantly at a low nanomolar to subnanomolar level (Adell et al. 1991; Tao et al. 2000; Tao and Ma 2012). A small elevation of extracellular 5HT [e.g., 1–5 fold; (Rutter and Auerbach 1993; Kirby and Lucki 1997)] could be therapeutic for mental disorders such as depression. However, excessive 5HT release is problematic, potentially causing serotonin syndrome. Unlike many other neurological disorders, the serotonin syndrome is iatrogenic and never happens naturally. This raises a question as to how much extracellular brain 5HT would be considered too much and under what circumstances these excessive concentrations could cause the syndrome. Our data obtained from CLG+5HTP and CLG+PRX studies showed that symptoms (i.e., head shakes and myoclonus) of the syndrome were not elicited unless extracellular brain 5HT was markedly elevated to at least 10-fold above baseline, consistent with previous studies (Zhang et al. 2009; Tao and Ma 2012). To our surprise, no symptom was detected in rats treated with 2 mg/kg MDMA even though there was a 10-fold increase in 5HT. This suggests that, in addition to a threshold 5HT level, other factors also contribute to the induction of the behavioral syndrome. One pharmacological aspect of MDMA that was strikingly different from CLG+5HTP or CLG+PRX was that the effect of 2 mg/kg MDMA on elevating 5HT was very transient, lasting for only 30 min. This comparison is highly suggestive of an important role of the temporal duration of the elevation in 5HT, implying that normal functional operation of postsynaptic neurons and relevant circuits is only sustainable in the face of excessive 5HT for a short period of time. In support of this concept, “binge” dosing (3 or more doses in one session) was often used to elicit a long lasting increase in extracellular brain 5HT for achieving a recreational or neurological response (Baumann et al. 2008b). In addition to 5HT, MDMA also causes excessive increases in extracellular dopamine and noradrenalin (Baumann et al. 2008a; Starr et al. 2012). It is well known that behavioral responses can be altered in complex ways due to the interaction between serotonergic and catecholaminergic systems. Future studies should investigate whether and how elevations in catecholamine levels influence symptoms of the syndrome.
Relationship between plasma 5HT and syndrome severity
Our data suggested that, except for CLG+5HTP, changes of total plasma 5HT were not robust, particularly in response to MDMA administration. Similar observations have been reported in investigations into another 5HT-promoting drug, namely fenfluramine (Martin and Artigas 1992; Rothman et al. 2000). Nevertheless, our findings suggest that, under our experimental conditions, the measurement of total plasma 5HT would not provide valuable information with respect to diagnosis, prognosis or treatment of the serotonin syndrome caused by 5HT-promoting drugs. In contrast, the unbound plasma 5HT was significantly elevated by all drug groups. However, the response was relatively low compared to that in the CNS. The lower response of plasma 5HT to drugs can be easily interpreted in several ways. For instance, the plasma 5HT concentration is normally at the micromolar (μM) level, which appears to be many hundreds or thousands of times greater than that in the CNS. Thus, although a large quantity of 5HT molecules had been in fact released into the plasma, the levels of increase in terms of fold above baseline were still relative small. 5HT molecules can either be bound to plasma proteins whereby the molecules have lost their function or they can remain free in plasma to play a functional role. In humans, unbound plasma 5HT is estimated to be 72–76% of the total (Anderson et al. 1987; Breyer-Pfaff et al. 1989). In this study, we estimated in rats that unbound 5HT comprised 63% of the total molecules, indicating that 5HT assigned to unbound and bound pools could differ between species. Furthermore, pharmacological properties of these drugs could have an effect on the 5HT assignment as bound or unbound. This possibility was supported by the findings that injection of CLG+5HTP produced a change in unbound 5HT similar to the total, suggesting that the increased 5HT molecules were almost equally assigned into unbound and bound pools. In contrast, 5HT increased by CLG+PRX and by MDMA is mainly in the unbound pool. Nevertheless, the measurement of changes in unbound 5HT, but not in the bound or total 5HT, represents a valuable approach for estimating the onset of the syndrome.
The lower response of plasma 5HT to 5HT-promoting drugs may also be ascribed to loosely-coupled pathways of 5HT synthesis, reuptake and breakdown in the peripheral system. Unlike the CNS in which 5HT pathways are exclusively integrated in serotonergic neurons, peripheral 5HT pathways utilize a variety of organs and cells between which metabolites are communicated through the circulatory system. For instance, 5HT is synthesized mainly in the enterochromaffin cells in the gastrointestinal tract and stored largely in other cell types including epithelial cells and platelets after it has exerted its functional role in the intestines (Lesurtel et al. 2008; Linder et al. 2009). Unbound 5HT is metabolized by monoamine oxidase in intestinal tissues or the liver through the portal circulation (Lesurtel et al. 2008; Bertrand and Bertrand 2010). In addition, hepatic glucuronidases also participate in 5HT degradation (Bertrand and Bertrand 2010), indicating that an inhibition of monoamine oxidase would not efficiently prevent 5HT degradation in the plasma. Taken together, it appears that many organs and cells through a variety of mechanisms keep the plasma 5HT pool tightly in check in order to prevent fluctuations. This interpretation is further supported by our findings that the contribution of platelet 5HT to plasma 5HT in response to 5HT-promoting drugs varies widely, suggesting that some 5HT-promoting drugs may act mainly on platelet cells while other drugs mainly affect other cell types such as enterochromaffin cells.
Conclusion
Analyses of EEG activity at the onset of serotonin syndrome revealed two distinct responses: a reduction in EEG amplitude reflective of mild syndrome and by contrast increased amplitude (seizure bursts) indicative of severe syndrome. Interestingly, MDMA at the high dose tested caused no EEG seizures unless injection was given at the warm ambient temperature of 32 °C. These findings are in agreement with previous reports demonstrating that symptoms and signs of the serotonin syndrome can be altered by ambient temperatures (Malberg and Seiden 1998; Krishnamoorthy et al. 2010). In addition, studies based on the force-plate actometer revealed the possibility that tremor activity measurement is also appropriate for detecting the onset of the syndrome. Furthermore, the measurement of changes in unbound plasma 5HT may be an important step to determine the onset of the syndrome. In summary the study indicates that it is likely that the onset of 5HT syndrome can be determined by using laboratory measurements.
Acknowledgments
This work was supported by NIH grand (R15DA029863). We would like to thank the National Institute on Drug Abuse (Rockville, MD) for providing (±)3,4-methylenedioxymethamphetamine (±MDMA) to this work. Authors wish to acknowledge Nabeel Markatia for his engaged and skillful technical assistance.
Footnotes
Conflicts of interest: The authors declare no conflicts of interest.
References
- Adell A, Carceller A, Artigas F. Regional distribution of extracellular 5-hydroxytryptamine and 5-hydroxyindoleacetic acid in the brain of freely moving rats. J Neurochem. 1991;56:709–712. doi: 10.1111/j.1471-4159.1991.tb08208.x. [DOI] [PubMed] [Google Scholar]
- Aikins DE, Jackson ED, Christensen A, Walderhaug E, Afroz S, Neumeister A. Differential conditioned fear response predicts duloxetine treatment outcome in male veterans with PTSD: a pilot study. Psychiatry Res. 2011;188:453–455. doi: 10.1016/j.psychres.2011.05.009. [DOI] [PubMed] [Google Scholar]
- Anderson GM, Feibel FC, Cohen DJ. Determination of serotonin in whole blood, platelet-rich plasma, platelet-poor plasma and plasma ultrafiltrate. Life Sci. 1987;40:1063–1070. doi: 10.1016/0024-3205(87)90568-6. [DOI] [PubMed] [Google Scholar]
- Baumann MH, Clark RD, Rothman RB. Locomotor stimulation produced by 3,4-methylenedioxymethamphetamine (MDMA) is correlated with dialysate levels of serotonin and dopamine in rat brain. Pharmacol Biochem Behav. 2008a;90:208–217. doi: 10.1016/j.pbb.2008.02.018. [DOI] [PMC free article] [PubMed] [Google Scholar]
- Baumann MH, Clark RD, Franken FH, Rutter JJ, Rothman RB. Tolerance to 3,4-methylenedioxymethamphetamine in rats exposed to single high-dose binges. Neuroscience. 2008b;152:773–784. doi: 10.1016/j.neuroscience.2008.01.007. [DOI] [PMC free article] [PubMed] [Google Scholar]
- Ben-Abraham R, Szold O, Rudick V, Weinbroum AA. ‘Ecstasy’ intoxication: life-threatening manifestations and resuscitative measures in the intensive care setting. Eur J Emerg Med. 2003;10:309–313. doi: 10.1097/00063110-200312000-00013. [DOI] [PubMed] [Google Scholar]
- Bertrand PP, Bertrand RL. Serotonin release and uptake in the gastrointestinal tract. Auton Neurosci. 2010;153:47–57. doi: 10.1016/j.autneu.2009.08.002. [DOI] [PubMed] [Google Scholar]
- Boyer EW, Shannon M. The serotonin syndrome. N Engl J Med. 2005;352:1112–1120. doi: 10.1056/NEJMra041867. [DOI] [PubMed] [Google Scholar]
- Breyer-Pfaff U, Fauss C, Bohne HP. Serum albumin stimulates serotonin uptake into human blood platelets. Life Sci. 1989;44:1251–1258. doi: 10.1016/0024-3205(89)90361-5. [DOI] [PubMed] [Google Scholar]
- Duffy MR, Swart M. Severe Ecstasy poisoning in a toddler. Anaesthesia. 2006;61:498–501. doi: 10.1111/j.1365-2044.2006.04620.x. [DOI] [PubMed] [Google Scholar]
- Fletcher PJ, Yu PH. Enhancement of 5-HT-induced anorexia: a test of the reversibility of monoamine oxidase inhibitors. Psychopharmacology (Berl) 1989;98:265–268. doi: 10.1007/BF00444703. [DOI] [PubMed] [Google Scholar]
- Fowler SC, Birkestrand BR, Chen R, Moss SJ, Vorontsova E, Wang G, Zarcone TJ. A force-plate actometer for quantitating rodent behaviors: illustrative data on locomotion, rotation, spatial patterning, stereotypies, and tremor. J Neurosci Methods. 2001;107:107–124. doi: 10.1016/s0165-0270(01)00359-4. [DOI] [PubMed] [Google Scholar]
- George M, Al-Duaij N, O’Donnell KA, Shannon MW. Obtundation and seizure following ondansetron overdose in an infant. Clin Toxicol (Phila) 2008;46:1064–1066. doi: 10.1080/15563650802304401. [DOI] [PubMed] [Google Scholar]
- Gillman PK. Monoamine oxidase inhibitors, opioid analgesics and serotonin toxicity. Br J Anaesth. 2005;95:434–441. doi: 10.1093/bja/aei210. [DOI] [PubMed] [Google Scholar]
- Giorgi FS, Pizzanelli C, Ferrucci M, Lazzeri G, Faetti M, Giusiani M, Pontarelli F, Busceti CL, Murri L, Fornai F. Previous exposure to (±) 3,4-methylenedioxymethamphetamine produces long-lasting alteration in limbic brain excitability measured by electroencephalogram spectrum analysis, brain metabolism and seizure susceptibility. Neuroscience. 2005;136:43–53. doi: 10.1016/j.neuroscience.2005.07.036. [DOI] [PubMed] [Google Scholar]
- Jacobs KM, Donoghue JP. Reshaping the cortical motor map by unmasking latent intracortical connections. Science. 1991;251:944–947. doi: 10.1126/science.2000496. [DOI] [PubMed] [Google Scholar]
- Kirby LG, Lucki I. Interaction between the forced swimming test and fluoxetine treatment on extracellular 5-hydroxytryptamine and 5-hydroxyindoleacetic acid in the rat. J Pharmacol Exp Ther. 1997;282:967–976. [PubMed] [Google Scholar]
- Krishnamoorthy S, Ma Z, Zhang G, Wei J, Auerbach SB, Tao R. Involvement of 5-HT2A receptors in the serotonin (5-HT) syndrome caused by excessive 5-HT efflux in rat brain. Basic Clin Pharmacol Toxicol. 2010;107:830–841. doi: 10.1111/j.1742-7843.2010.00586.x. [DOI] [PubMed] [Google Scholar]
- Lesurtel M, Soll C, Graf R, Clavien PA. Role of serotonin in the hepato-gastroIntestinal tract: an old molecule for new perspectives. Cell Mol Life Sci. 2008;65:940–952. doi: 10.1007/s00018-007-7377-3. [DOI] [PMC free article] [PubMed] [Google Scholar]
- Linder AE, Beggs KM, Burnett RJ, Watts SW. Body distribution of infused serotonin in rats. Clin Exp Pharmacol Physiol. 2009;36:599–601. doi: 10.1111/j.1440-1681.2009.05147.x. [DOI] [PubMed] [Google Scholar]
- Luttjohann A, Fabene PF, van Luijtelaar G. A revised Racine’s scale for PTZ-induced seizures in rats. Physiol Behav. 2009;98:579–586. doi: 10.1016/j.physbeh.2009.09.005. [DOI] [PubMed] [Google Scholar]
- Ma Z, Zhang G, Jenney C, Krishnamoorthy S, Tao R. Characterization of serotonin-toxicity syndrome (toxidrome) elicited by 5-hydroxy-l-tryptophan in clorgyline-pretreated rats. Eur J Pharmacol. 2008;588:198–206. doi: 10.1016/j.ejphar.2008.04.004. [DOI] [PMC free article] [PubMed] [Google Scholar]
- Malberg JE, Seiden LS. Small changes in ambient temperature cause large changes in 3,4-methylenedioxymethamphetamine (MDMA)-induced serotonin neurotoxicity and core body temperature in the rat. J Neurosci. 1998;18:5086–5094. doi: 10.1523/JNEUROSCI.18-13-05086.1998. [DOI] [PMC free article] [PubMed] [Google Scholar]
- Martin F, Artigas F. Simultaneous effects of p-chloroamphetamine, d-fenfluramine, and reserpine on free and stored 5-hydroxytryptamine in brain and blood. J Neurochem. 1992;59:1138–1144. doi: 10.1111/j.1471-4159.1992.tb08356.x. [DOI] [PubMed] [Google Scholar]
- Mills KC. Serotonin syndrome. Am Fam Physician. 1995;52:1475–1482. [PubMed] [Google Scholar]
- Morrison EK, Rowe AS. Probable drug-drug interaction leading to serotonin syndrome in a patient treated with concomitant buspirone and linezolid in the setting of therapeutic hypothermia. J Clin Pharm Ther. 2012 doi: 10.1111/j.1365-2710.2012.01344.x. [DOI] [PubMed] [Google Scholar]
- Parker G, Brotchie H. Mood effects of the amino acids tryptophan and tyrosine: ‘Food for Thought’ III. Acta Psychiatr Scand. 2011;124:417–426. doi: 10.1111/j.1600-0447.2011.01706.x. [DOI] [PubMed] [Google Scholar]
- Parrott AC. Recreational Ecstasy/MDMA, the serotonin syndrome, and serotonergic neurotoxicity. Pharmacol Biochem Behav. 2002;71:837–844. doi: 10.1016/s0091-3057(01)00711-0. [DOI] [PubMed] [Google Scholar]
- Racine RJ. Modification of seizure activity by electrical stimulation. II. Motor seizure. Electroencephalogr Clin Neurophysiol. 1972;32:281–294. doi: 10.1016/0013-4694(72)90177-0. [DOI] [PubMed] [Google Scholar]
- Rothman RB, Redmon JB, Raatz SK, Kwong CA, Swanson JE, Bantle JP. Chronic treatment with phentermine combined with fenfluramine lowers plasma serotonin. Am J Cardiol. 2000;85:913–915. A910. doi: 10.1016/s0002-9149(99)00896-6. [DOI] [PubMed] [Google Scholar]
- Rutter JJ, Auerbach SB. Acute uptake inhibition increases extracellular serotonin in the rat forebrain. J Pharmacol Exp Ther. 1993;265:1319–1324. [PubMed] [Google Scholar]
- Shioda K, Nisijima K, Yoshino T, Kato S. Extracellular serotonin, dopamine and glutamate levels are elevated in the hypothalamus in a serotonin syndrome animal model induced by tranylcypromine and fluoxetine. Prog Neuropsychopharmacol Biol Psychiatry. 2004;28:633–640. doi: 10.1016/j.pnpbp.2004.01.013. [DOI] [PubMed] [Google Scholar]
- Starr MA, Page ME, Waterhouse BD. Effects of repeated 3,4-methylenedioxymethamphetamine administration on neurotransmitter efflux and sensory-evoked discharge in the ventral posterior medial thalamus. J Pharmacol Exp Ther. 2012;340:73–82. doi: 10.1124/jpet.111.185728. [DOI] [PMC free article] [PubMed] [Google Scholar]
- Tao R, Ma Z. How much serotonin in the CNS is too much? In: Mantamadiotis T, editor. When Things Go Wrong: Diseases and Disorders of the Human Brain. Intech; Croatia: 2012. pp. 49–68. [Google Scholar]
- Tao R, Ma Z, Auerbach SB. Differential effect of local infusion of serotonin reuptake inhibitors in the raphe versus forebrain and the role of depolarization-induced release in increased extracellular serotonin. J Pharmacol Exp Ther. 2000;294:571–579. [PubMed] [Google Scholar]
- Turner EH, Loftis JM, Blackwell AD. Serotonin a la carte: supplementation with the serotonin precursor 5-hydroxytryptophan. Pharmacol Ther. 2006;109:325–338. doi: 10.1016/j.pharmthera.2005.06.004. [DOI] [PubMed] [Google Scholar]
- Veauthier J, Haettig H, Meencke HJ. Impact of levetiracetam add-on therapy on different EEG occipital frequencies in epileptic patients. Seizure. 2009;18:392–395. doi: 10.1016/j.seizure.2009.02.001. [DOI] [PubMed] [Google Scholar]
- Yubero-Lahoz S, Ayestas MA, Jr, Blough BE, Partilla JS, Rothman RB, de la Torre R, Baumann MH. Effects of MDMA and related analogs on plasma 5-HT: relevance to 5-HT transporters in blood and brain. Eur J Pharmacol. 2012;674:337–344. doi: 10.1016/j.ejphar.2011.10.033. [DOI] [PMC free article] [PubMed] [Google Scholar]
- Zhang G, Tao R. Enhanced responsivity of 5-HT2A receptors at warm ambient temperatures is responsible for the augmentation of the 1-(2,5-dimethoxy-4-iodophenyl)-2-aminopropane (DOI)-induced hyperthermia. Neurosci Lett. 2011;490:68–71. doi: 10.1016/j.neulet.2010.12.028. [DOI] [PMC free article] [PubMed] [Google Scholar]
- Zhang G, Krishnamoorthy S, Ma Z, Vukovich NP, Huang X, Tao R. Assessment of 5-hydroxytryptamine efflux in rat brain during a mild, moderate and severe serotonin-toxicity syndrome. Eur J Pharmacol. 2009;615:66–75. doi: 10.1016/j.ejphar.2009.05.008. [DOI] [PMC free article] [PubMed] [Google Scholar]
- Zolkowska D, Rothman RB, Baumann MH. Amphetamine analogs increase plasma serotonin: implications for cardiac and pulmonary disease. J Pharmacol Exp Ther. 2006;318:604–610. doi: 10.1124/jpet.106.101618. [DOI] [PubMed] [Google Scholar]