

Abstract
• Background and Aims Landrace populations represent an important intra-crop reservoir of biodiversity and source of novel gene alleles for use in breeding programmes. Here the aim was to measure the diversity of a wheat landrace, ‘Barbela’, from the north of Portugal.
• Methods DNA was extracted from 59 accessions of Barbela collected across its geographical range. Diversity was measured by microsatellite length polymorphisms using 27 primer pairs amplifying 34 polymorphic microsatellite loci.
• Key Results High levels of polymorphism were found, with an average polymorphism information content of 0·52; an average of 4·77 alleles (range 2–11) were present at each locus, and half of these loci showed an additional allele in the reference variety ‘Chinese Spring’.
• Conclusions ‘Barbela’ is maintained from seeds collected by farmers, but it maintains high allelic variation, and no groupings of accessions were detected when analysed by geographical region, farm or climate, indicating that the wheat landrace is a homogeneous entity. The diversity within the farmer-maintained landrace demonstrates the importance of characterization and maintenance of landrace collections before valuable genetic combinations are lost as uniform commercial crops are introduced.
Key words: Biodiversity, wheat, landrace, microsatellites, plant breeding
INTRODUCTION
Old bread wheat (Triticum aestivum) landrace populations represent an important genetic resource that can be used to improve modern varieties (Feldman and Sears, 1981) by introducing new alleles or combinations of genes. This heterogeneity has not been analysed systematically (Nevo and Payne, 1987), and such landraces may include genetic sources of biotic and abiotic stress resistance, especially in environments not tested in major breeding programmes, and also quality, yield and resistance genes. Diversity levels of populations may change rapidly with changing environment, with socio-economic factors such as the introduction of new varieties, the movement of people with their germplasm, and commercial marketing of both seed for planting and the grain produced, or with changing agronomic practice including cultivation methods and use of fertilizers or pesticides. However, there is no clear evidence that crossing of elite varieties in major wheat breeding programmes has lead to any systematic narrowing of overall diversity over the last 100 years (Donini et al., 2000; Christiansen et al., 2002).
Within defined populations, limited plant diversity studies have been conducted based on morphological (phenotype) analysis and sometimes cytogenetics, pedigree records or biochemical (e.g. isozyme) analysis (Thomas et al., 1993; Volis et al., 2001). Genome-marker technologies are particularly valuable for analysis of crops such as wheat with relatively low levels of genetic diversity (Plaschke et al., 1995; Röder et al., 1995; Korzun et al., 1997) and clonal species including many grasses (Li and Ge, 2001), where there are few morphological markers. DNA markers may eliminate the limitations associated with both polymorphism level and numbers of morphological and biochemical markers, especially for screening diversity within landraces. Markers that detect high levels of polymorphism between cultivars help to improve the efficiency and accuracy of genetic similarity estimates. Bread wheat, however, exhibits an extremely low level of variation when genetic markers based on restriction fragment length polymorphism (RFLP) are used (Bryan et al., 1999), but is much more polymorphic with respect to microsatellite makers.
Microsatellites or simple sequence repeats (SSRs), short tandemly repeated sequence motifs with a repeat length of a few base pairs (1–6 bp) flanked by conserved single-copy DNA sequence regions, are often highly variable in the number of repeats they contain and hence show high levels of genetic variation. They are abundant and widely distributed in most eukaryotic genomes, and the hypervariability of microsatellites and their usefulness in the construction of genetic maps has been shown in many species ranging from the cereals to trees (Saghai-Maroof et al., 1994; Bruschi et al., 2003).
‘Barbela’ is a collective name for a Portuguese wheat landrace that has been referred to in the literature for more than one century (Lapa, 1865; Coutinho, 1884), and at least four morphological variants have been described (Vasconcelos, 1933). A large germplasm collection of the ‘Barbela’ wheat landrace was made across the north inner region of Portugal, based on individual spikes collected in farmers' fields (Guedes-Pinto et al., 1998). ‘Barbela’ has some introgression from rye (Ribeiro-Carvalho et al., 1997, 2001), which could be associated with good agronomic performance (see review in Ribeiro-Carvalho et al., 2001), with phenotypic plasticity allowing wide adaptation to different edapho-climatic conditions. Igrejas (1997) and Nascimento et al. (1998) have studied the diversity of wheat storage proteins comprising high- and low-molecular weight glutenin subunits (HMW and LMW-GS) and ω gliadins, in 155 lines of the same collection of this landrace, and identified 57 different patterns.
Assessment of the extent of genetic variability within a variety of landrace has important consequences for plant breeding and conservation of genetic resources. It is useful in the characterization of individual accessions and cultivars and as a general guide in the choice of parents for breeding hybrids. It is important to have this information for germplasm collections, to determine the range of diversity in accessions relative to that in the field, and to determine levels and changes in diversity among farms (particularly for landraces), in wild populations and during long-term maintenance of collections. In this study, the aim was to apply microsatellite markers, for the estimation of genetic diversity in a ‘Barbela’ germplasm collection, to assess levels of genetic variation between populations.
MATERIALS AND METHODS
Plant material
Fifty-nine lines of Triticum aestivum ‘Barbela’ wheat were selected at random from 4000 accessions of single spikes collected from various fields of three sub-regions (agrarians) in the north inner region of Portugal (Fig. 1, and indicated next to line designations in Fig. 2) under ‘Project Barbela’ (PDRITM II; see Guedes-Pinto et al., 1998). Code numbers of collection fields are indicated by the second number of the line designation (Fig. 2), and detailed localities are available from Project Barbela, UTAD, Portugal. Additional lines studied included wheat ‘Chinese Spring’ and the Portuguese rye ‘Gimonde’. Relevant ‘Chinese Spring’ aneuploids and rye substitution lines were used to check amplification bands originated from chromosomes as expected.
Fig. 1.

Northern part of Portugal showing the three sub-regions where ‘Barbela’ landrace collections were made: Planalto (Mogadouro seven accessions, Mirandês 28 accessions), Terra Quente (ten accessions) and Terra Fria (13 accessions).
Fig. 2.
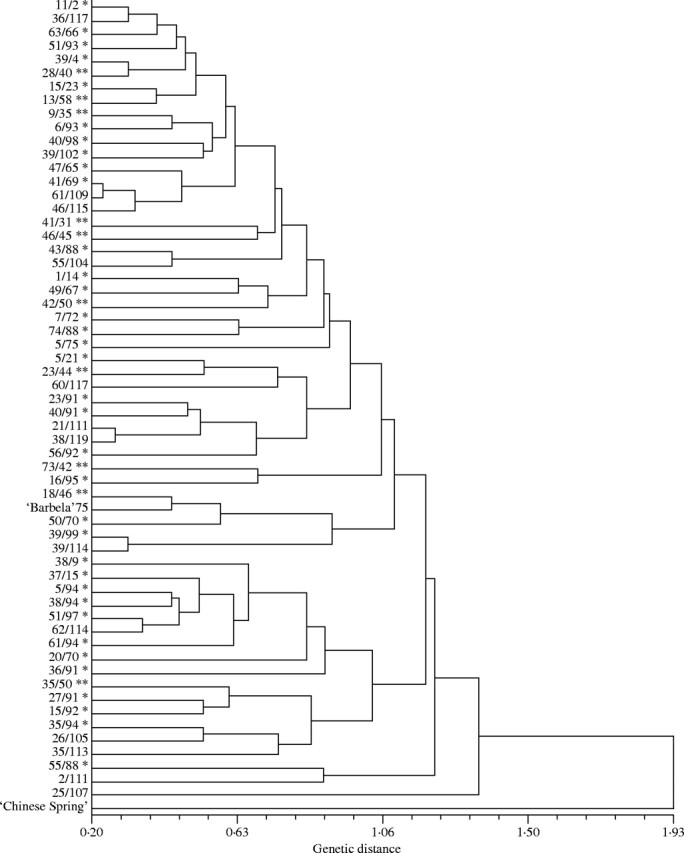
Dendrogram of 59 ‘Barbela’ wheat landrace collections and the unrelated wheat ‘Chinese Spring’ based on the genetic dissimilarity calculated from the data of 34 microsatellite loci, using UPGMA clustering method (Nei, 1972). Origin of line indicated by * Planalto, ** Tera Quente, and no mark Terra Fria or ‘Chinese Spring’.
Molecular analysis
Genomic DNA was extracted from fresh leaves following the procedure of Sharp et al. (1988) with minor modifications. A total of 57 primer pairs flanking microsatellites described in Bryan et al. (1997), Röder et al. (1998) and Pestsova et al. (2000) were tested, and 27 were selected for detailed analysis because of successful amplification, presence of polymorphism, a well-resolved fragment pattern and genomic location. Their sequences and chromosome arm locations are shown in Table 1.
Table 1.
Description of microsatellite markers, motifs, chromosome map location and fragment size reported by the authors (GWM, Röder et al., 1998; GDM, Pestsova et al., 2000; PSP, Bryan et al., 1997)
| Micro-satellite | Published information |
‘Barbela’ lines from this studies |
||||||||
|---|---|---|---|---|---|---|---|---|---|---|
| Motifs |
Chromosome location |
Fragment size (bp) (cultivar)* |
Fragment size (bp) |
No. of alleles |
PIC |
|||||
| GWM3 | (CA)18 | 3DL | − (S); 84 (O) | 74–110 | 6 | 0·26 | ||||
| GWM30 | (AT)19 (GT)15 | 3AS | 205 (S); 196 (O) | 209–281 | 5 | 0·68 | ||||
| GWM46 | (GA)2 GC (GA)33 | 7BL | 179 (S); 186 (O) | 154–160 | 2 | 0·14 | ||||
| GDM93† | (GA)16 | 2A | 134 (S); – (O) | 100–128 | 7 | 0·56 | ||||
| 4B | 215 (S); 217 (O) | 217–225 | 3 | 0·17 | ||||||
| GWM106 | (GA)24 | 1DS | 81 (S); – (O) | 121–139 | 4 | 0·59 | ||||
| GWM111 | (CT)32 (GT)17 | 7DL | 184 (S); 206 (O) | 206–216 | 5 | 0·52 | ||||
| GWM154 | (GA)37imp | 5AS | 120 (S); 102 (O) | 102–128 | 4 | 0·68 | ||||
| GWM161 | (CT)15 | 3DS | 145 (S); 154 (O) | 148–154 | 3 | 0·49 | ||||
| GWM192 | (CT)46 | 5DS | 232 (S); 191 (O) | 190–210 | 4 | 0·55 | ||||
| GWM272 | (CA)17 | 5DL | 140 (S); 138 (O) | 140–148 | 2 | 0·50 | ||||
| GWM276 | (CT)24 | 7AL | 101 (S); 109 (O) | 118–139 | 9 | 0·81 | ||||
| GWM301 | (GA)31 (G)12 | 2DL | 210 (S); – O | 196–226 | 6 | 0·76 | ||||
| GWM304 | (CT)22 | 5AS | 208 (S); 202 (O) | 200–206 | 5 | 0·71 | ||||
| GWM311 | (GA)29 | 2AL | 120 (S); – (O) | 120–136 | 7 | 0·61 | ||||
| 2DL | 143 (S); 157 (O) | 143–171 | 4 | 0·51 | ||||||
| GWM320 | (GT)9 (GA)15 | 2DL | 226 (S) | 224–232 | 5 | 0·65 | ||||
| GWM349 | (GA)34 | 2DL | 243 (O) | 243–275 | 6 | 0·72 | ||||
| GWM361 | (GA)20imp | 6BS | 123 (S); 125 (O) | 131–139 | 3 | 0·63 | ||||
| GWM382 | (GA)26 | 2AL | 86 (S) | 86–96 | 3 | 0·45 | ||||
| 2BL | 184 (S) | 184–190 | 3 | 0·61 | ||||||
| 2DL | 108 (S) | 108–134 | 3 | 0·46 | ||||||
| GWM539 | (GA)27 | 2DL | 157 (S); 143 (O) | 109–159 | 9 | 0·86 | ||||
| GWM570 | (CT)14 (GT)18 | 6AL | 143 (S); 149 (O) | 136–158 | 7 | 0·76 | ||||
| GWM610 | (GA)17imp | 4AL | 162 (S); 172 (O) | 164–200 | 9 | 0·82 | ||||
| GWM645 | (CT)23imp | 3DL | 145 (S); 161 (O) | 135–161 | 6 | 0·70 | ||||
| PSP2999 | (CAG)5 (CAA)8 | 1AS | 150 (CS) | 138–173 | 11 | 0·74 | ||||
| PSP3000 | (CAA)15 | 1BS | 286 (CS) | 282–290 | 3 | 0·14 | ||||
| PSP3029 | (AG)17 | 2AL | 150 (CS) | 144–150 | 2 | 0·10 | ||||
| 6AL | 166 (CS) | 166–170 | 2 | 0·06 | ||||||
| 6AS | 245 (CS) | 241–253 | 6 | 0·60 | ||||||
| PSP3030 | (AG)15 | 4BL | 208 (CS) | 212–220 | 3 | 0·28 | ||||
| 3BS | 172 (CS) | 174–178 | 2 | 0·16 | ||||||
| PSP3050 | (CT)12 (AT)13 | 7AS | 160 (CS) | 160–170 | 3 | 0·54 | ||||
For the 59 ‘Barbela’ lines, fragment size range, number of alleles detected and polymorphism information content (PIC, see text) are given.
S, Synthetic hexaploid wheat; O, ‘Opata’; CS, ‘Chinese Spring’; –, null allele.
Two loci were not mapped to a specific arm.
PCR amplification and product analysis
PCR amplifications were carried out in 15-μL reaction volumes using the reaction mixture of Röder et al. (1998): 250 nm of each primer, 0·2 mm of each dNTP, 1·5 mm MgCl2, 1 U Taq polymerase (Roche), and 50–100 ng genomic DNA from the lines studied. A PCR protocol was used: 3 min at 94 °C, than 45 cycles (or 35 cycles for PSP primers) were performed for 1 min at 94 °C, 1 min at the annealing temperature (55–63 °C as published), and 2 min at 72 °C, followed by a final extension step of 10 min at 72 °C in a MJ Research or Biometra thermocycler.
Amplification products were separated on a 6 % denaturing polyacrylamide (19 : 1 acrylamide : Bis) gels 20 × 30 cm long, containing 8 m urea and 1× TBE buffer (90 mm Tris-borate, 2 mm EDTA), 0·35 mm thick cast between glass plates. Along with size marker tracks (1 kb DNA ladder), 5 μL of each sample [2·5 μL of loading buffer (98 % formamide, 10 mm EDTA 0·025 %, xylene cyanol 0·025 %, bromophenol blue) and 2·5 μL of PCR products] was loaded after a 3-min denaturation at 95 °C in a thermocycler, and kept on ice until loading. Samples of 5 μL were separated by electrophoresis in 1× TBE buffer at 80 W constant power for 80 min. Products were visualised by silver staining as described by Bassam et al. (1991). Briefly, gels were fixed for 30 min in 10 % acetic acid, rinsed three times with water and stained in 0·1 % silver nitrate and 0·05 % formaldehyde for 30 min. After a quick rinse (<10 s) microsatellites were revealed by the addition of developer (3 % sodium carbonate, 0·05 % formaldehyde, 2 mg L−1 of sodium thiosulphate). Image development, at a maximum temperature of 12 °C, was allowed for 3–10 min. The reaction was stopped by addition of acetic acid (10 %), gels were rinsed in water, and dried at room temperature. Permanent images were made using Kodak duplicating film or a flatbed scanner. The presence or absence of bands in the published size region (Table 1) was scored, taking polymorphisms and allelic differences into account.
Statistical analysis
The number of di- or tri-nucleotides of the SSRs over all 59 ‘Barbela’ lines and for each locus were calculated based on the data for each locus given by the original authors (see Table 1), assuming that size differences of fragments (other than absence) are only due to alterations in the repeat number of the appropriate microsatellite sequence. Genetic dissimilarity (GD) between ‘Barbela’ lines was calculated according to the model presented by Nei (1972, 1978), and Wright (1978). The presence or absence of each fragment was scored in binary data matrix. Genotypes were grouped by cluster analysis according to their relationship, using the average linkage between groups fusion method [UPGMA (unweighted pair group method with arithmetic average)] in NTSYS-pc, version 2-10a (Rolph, 2000).
Polymorphism information contents (PIC; Botstein et al., 1980; or gene diversity of Weir, 1990) were calculated and used to represent the value of a marker for detecting polymorphism within a population, depending on the number of detectable alleles and their frequency distribution. The occurrence of rare alleles has less impact on PIC than alleles occurring with high frequency. Here we used the simplified formula of Anderson et al. (1993), assuming that the inbred wheat lines are homozygous. For marker i, the PIC was calculated using
 |
where pij is the frequency of the jth allele for marker i summed across n patterns. This value provides an estimate of discriminatory power of a microsatellite locus by taking into account not only the number of alleles per locus, but also their relative frequencies in the population studied.
RESULTS
Microsatellites
The 27 microsatellites gave informative results and were used to analyse the 59 lines of ‘Barbela’ in detail (Table 1); the chosen microsatellites were located on 18 (of 21 possible) different chromosomes (seven in A, six in B and five in D genomes) and at least 22 different chromosome arms (two loci were not mapped to arms). Products from all informative primer pairs tended towards showing multiple products and multiple loci with stuttering—‘Type 2’ described by Stephenson et al. (1998)—although some showed co-migrating prominent bands. The band sizes were readily interpretable from the polyacrylamide gels used. A total of 34 loci and 162 alleles were detected with these 27 microsatellites (Table 2). An additional 17 alleles of the same loci were detected in ‘Chinese Spring’.
Table 2.
Partial analysis of PIC for genomes, chromosomes, chromosome arms and chromosome 2DL
| Category |
No. of loci |
Total no. of alleles |
Mean PIC per locus (± s.d.) |
Mean no. of alleles per locus (± s.d.) |
|---|---|---|---|---|
| All genomes | 34 | 162 | 0·52 (±0·23) | 4·77 (±2·36) |
| A genome | 14 | 80 | 0·58 (±0·24) | 5·71 (±2·29) |
| B genome | 7 | 19 | 0·30 (±0·22) | 2·71 (±0·49) |
| D genome | 13 | 63 | 0·58 (±0·16) | 4·85 (±1·82) |
| 2DL | 6 | 33 | 0·66 (±0·15) | 5·50 (±2·07) |
| All chromosomes (without 2DL) | 28 | 129 | 0·50 (±0·24) | 4·61 (±2·42) |
| Short arms | 12 | 53 | 0·54 (±0·20) | 4·42 (±2·35) |
| Long arms | 20 | 99 | 0·53 (±0·25) | 4·95 (±2·44) |
Table 1 gives the characteristics of the PCR-amplified fragments including the published information based on ‘Chinese Spring’, ‘Opata’ and a synthetic hexaploid, and the fragment sizes, allele size range, the number of alleles and PIC value for the amplified products in ‘Barbela’ lines in this study. The number of alleles per microsatellite ranged from two to 11 with an average of 4·77 alleles per locus (Table 2). Two microsatellites detected three loci, one in three homoeologous group 2 chromosomes and the other to 2AL and the two arms of 6A. Another three microsatellites detected two loci, one in homoeologous chromosomes 2D and 2A and the other two in different chromosomes. The 22 remaining microsatellite markers detected a single locus.
Polymorphism information content
The average value for PIC for all microsatellites used was 0·52 (Table 2). Three microsatellites, all with nine alleles, had a PIC value higher than 0·80 (Table 1). The microsatellite with 11 alleles had a PIC value of 0·74, lower because many alleles were rare. For chromosome arms, the highest PIC was 0·86 on chromosome 2DL (a chromosome known to include a rye chromosome segment in some of the lines; Ribeiro-Carvalho et al., 2001), with a range down to chromosomes 6AL and 2AL with PICs <0·1 (Table 1). Across the A, B and D genomes, the distribution of PIC values ranged from 0·30 to 0·58 with mean alleles per locus for the genomes A, B and D of 5·71, 2·71 and 4·85, respectively (Table 2). The PIC mean was similar for genomes A and D and significantly lower (Fischer's F-test, P < 0·05) for the B genome. The means of PIC values and the number of alleles were similar in the short and long arms. Six microsatellites were analysed on chromosome arm 2DL, showing high PIC values with 0·66 and 5·5 alleles per locus (Table 2), values that are higher, but not significantly so, than the average for all chromosome arms (0·49 and 4·61 respectively). On chromosome arm 2DL the allelic sizes of the six microsatellites enabled 22 individual genotypes and 17 groups from a total of 59 genotypes and ‘Chinese Spring’ to be distiguished.
Within each of the three sub-regions (Fig. 1, and asterisks in Fig. 2), the PIC values (Table 3) were similar (F-test, P ≫ 0·05). Of individual microsatellites, the highest PIC value and allelic value were shown by GWM539 in all three sub-regions (Planalto, Terra Fria and Terra Quente), whereas the lowest PIC and allelic number were not exclusively the same (Table 3). Three or four spikes were sampled from three populations (a population equated to a single farmer's field), and these gave lower PIC values of 0·26 (population 91 with four lines), 0·25 (population 94 with four lines), and 0·34 (population 88 with three lines). Among these three populations, the highest PIC value (0·67) was shown by six microsatellites in population 88, GWM304 and GWM192 in population 91, and GWM610 in population 94.
Table 3.
Mean, highest and lowest polymorphism information content and mean highest and lowest number of alleles for ‘Barbela’ lines from three different sub-regions of the north inner region of Portugal (Fig. 1)
| Sub-regions |
No of lines |
Mean PIC |
Highest PIC |
Lowest PIC |
Highest no. of alleles |
Lowest no. of alleles |
Mean no. of alleles |
||||||||
|---|---|---|---|---|---|---|---|---|---|---|---|---|---|---|---|
| Planalto (Mogadouro and Miranda) | Xgwm382-2DL | 2 | |||||||||||||
| Xpsp3000-1BS | 2 | ||||||||||||||
| Xpsp3029-2AL | 2 | ||||||||||||||
| 35 | 0·52 (±0·23) | Xgwm539-2DL | 0·85 | Xpsp3029-6AL | 0·1 | Xgwm539-2DL | 9 | Xpsp3029-6AL | 2 | 4·77 (±2·36) | |||||
| Xgwm276-7AL | 9 | Xpsp3030-3BS Xgwm272-2DL | 22 | ||||||||||||
|
Xgwm46-7BL |
2 |
||||||||||||||
| Terra Quente | Xpsp3029-2AL | 0 | Xpsp3029-2AL | 1 | |||||||||||
| 10 | 0·43 (±0·23) | Xgwm539-2DL | 0·82 | Xpsp3029-6AL | 0 | Xpsp2999-1AS | 6 | Xpsp3029-6AL | 1 | 2·74 (±1·29) | |||||
| Xpsp3030-3BS | 0 | Xgwm539-2DL | 6 | Xpsp3030-3BS | 1 | ||||||||||
|
Xpsp3030-4BL |
0 |
Xpsp3030-4BL |
1 |
||||||||||||
| Xgdm93-4B | 0 | Xgwm276-7AL | 7 | Xgdm93-4B | 1 | ||||||||||
| Terra Fria | 13 | 0·49 (±0·23) | Xgwm539-2DL | 0·83 | Xgwm3-3DL | 0 | Xgwm539-2DL | 7 | Xgwm3-3DL | 1 | 3·21 (±1·55) | ||||
| Xpsp3029-6AL | 0 | Xpsp3029-6AL | 1 | ||||||||||||
Dendrograms
The scores of microsatellite alleles were used to generate dendrograms showing relationships of the ‘Barbela’ lines and ‘Chinese Spring’ wheat with three different algorithms in the program NTSYS-pc (Nei, 1972, 1978; Wright, 1978). Results and conclusions were similar in all trees, and only the one based on Nei (1972) is shown here (Fig. 2). The coefficient of dissimilarity for all the possible 1711 pairs of genotypes ranged from 0·23 to 2·43, and no well-supported clusters were identified among the 59 accessions. ‘Chinese Spring’ was distinct from the ‘Barbela’ lines. A division of the ‘Barbela’ lines into groups from the three sub-regions (Fig. 1) revealed no clusters in the dendrogram.
DISCUSSION
Twenty-seven microsatellite primer sets detected 34 microsatellite loci and 162 alleles in 59 lines of the wheat landrace ‘Barbela’. Polymorphism was high and each line was distinct. Genomic SSR markers have been used for discriminating between genotypes in bread wheat (Plaschke et al., 1995; Röder et al., 1995; Bryan et al., 1997; Prasad et al., 2000; Stachel et al., 2000), and the present results show that the same markers are informative even in wheat genotypes that are distant from most cultivars. Minimal attempts were made to adjust microsatellite amplification conditions in ‘Barbela’, so about half of the initial 57 primer pairs tested were discarded after the first screen. Missing amplification products for some primers and some lines are most likely due to sequence alterations in primer sequences (such as point mutations, deletions, inversions, or rye introgression; see below).
Throughout the range of the landrace, there was a similar level of polymorphism, and no clear branches in trees of relationships (Fig. 2) divided accessions from the different geographic regions (Table 3), indicating the landrace is a homogeneous genetic entity within regions, fields and populations. The ‘Barbela’ accessions group away from the outgroup wheat variety ‘Chinese Spring’ (which showed alleles unrelated to those in ‘Barbela’ in half of the microsatellites analysed). The average PIC in the present study was 0·52 from the ‘Barbela’ accessions, somewhat lower in this single aggregate landrace than the 0·63 that Röder et al. (1995) found with 15 primer pairs among a set of 18 wheat varieties, and the 0·58 found by Bryan et al. (1997) in wheat varieties (monomorphic loci were excluded in all analyses). Thus the single landrace ‘Barbela’ showed a PIC value that was only slightly lower than that between different commercial wheat cultivars that are in principle more genetically heterogeneous. A survey using 55 more diverse wheat genotypes from 29 countries from six continents gave a higher average PIC of 0·71 (Prasad et al., 2000). It is worth noting that a Portuguese landrace, ‘Tremês mole’ (also reported as ‘Tremez molle’) included in the study of Prasad et al. (2000) was unique and diverse with respect to other genotypes. There is novel variation within ‘Barbela’ that is useable by breeders, and the landrace is more homogeneous than the diverse wheat lines used in broader surveys of diversity. This indicates that the farmers maintain diversity within the selection they make to maintain the characteristics of the ‘Barbela’ landrace. The high levels and similarity of the variation from different areas contrasts with the situation in non-cultivated species including grasses (e.g. Psammochloa; Li and Ge, 2001) and oaks (Bruschi et al., 2003) where molecular marker (genetic) distances correlate with physical and geographical distances between accessions.
The B genome showed a lower PIC than the other genomes (Table 2), although Bryan et al. (1997) and Stachel et al. (2000) found the lowest PIC values in the D genome (0·38 vs. 0·49, and 0·48 vs. 0·62, respectively). It has been reported that some ‘Barbela’ lines show introgression of rye chromatin in a distal position on 2DL (Ribeiro-Carvalho et al., 2001) and this may relate to the higher variation seen in the D genome. Genetic diversity is often related to recombination frequency and, with the physical length of the chromosome arm, as long arms accommodate more cross-overs with less interference. Lukaszewski and Curtis (1993) reported that recombination in the short arms was concentrated in terminal regions and was virtually absent in proximal and interstitial positions, while interstitial recombination was consistently detectable on long arms. In the present case, neither the B genome nor long chromosome arms showed any tendency for higher PIC values or more alleles per locus (Table 2) than short arms. Like Röder et al. (1995), Bryan et al. (1997) and Stachel et al. (2000), no correlation was found between the length of the microsatellite repeat and the level of polymorphism, as estimated by the number of alleles or by PIC values. Also, as in previous studies (Prasad et al., 2000), there was no direct correlation between the number of alleles at a locus and the PIC value.
In conclusion, it has been shown that using a small number of microsatellite markers allows detection and measurement of polymorphism and genetic diversity among accessions of the wheat landrace ‘Barbela’. Agronomic, societal and genetic factors are probably all involved in maintaining both the identity and the variability of the ‘Barbela’ landrace. Its good agronomic characteristics on marginal wheat lands are likely to mean that collections are distributed by farmers, and season-to-season variation may select for high genetic variation and perhaps heterozygosity, thus avoiding genetic bottlenecks. The regional distribution only on marginal lands may help ensure integrity of the landrace. The high genetic diversity of ‘Barbela’, some accessions of which include rye introgression, demonstrates the importance of maintenance, and characterization of landrace collections before unique alleles and novel genetic combinations are lost, as uniform varieties are introduced following better communications and commercial pressure.
Acknowledgments
We are grateful to Michelle Leverington, John Innes Centre for providing primers. We thank the Portuguese Ministry of Science and Technology ‘Fundacão para a Ciência e Tecnologia’ PRAXIS XXI/BD/15968/98 and PRAXIS XXI/C/AGR/11290/98. We thank the British Council Treaty of Windsor programme for support of our collaboration.
LITERATURE CITED
- Anderson JA, Churchill GA, Autrique JE, Tanksley SD, Sorrells ME. 1993. Optimizing parental selection for genetic linkage maps. Genome 36: 181–186. [DOI] [PubMed] [Google Scholar]
- Bassam BJ, Caetano-Anollés G, Gresshoff PM. 1991. Fast and sensitive silver staining of DNA in polyacrylamide gels. Analytical Biochemistry 196: 80–83. [DOI] [PubMed] [Google Scholar]
- Botstein D, White RL, Skolnick M, Davis RE. 1980. Construction of a genetic linkage map in man using restriction fragment length polymorphisms. American Journal of Human Genetics 32: 314–331. [PMC free article] [PubMed] [Google Scholar]
- Bruschi P, Vendramin GG, Bussotti F, Grossoni P. 2003. Morphological and molecular diversity among Italian populations of Quercus petraea (Fagaceae). Annals of Botany 91: 707–716. [DOI] [PMC free article] [PubMed] [Google Scholar]
- Bryan GJ, Collins A, Stephenson P, Orry O, Smith JB, Gale MD. 1997. Isolation and characterisation of microsatellites from hexaploid wheat. Theoretical and Applied Genetics 94: 557–563. [Google Scholar]
- Bryan GJ, Stephenson P, Collins A, Kirby J, Smith JB, Gale MD. 1999. Low levels of DNA sequence variation among adapted genotypes of hexaploid wheat. Theoretical and Applied Genetics 99: 192–198. [Google Scholar]
- Christiansen MJ, Andersen SB, Ortiz R. 2002. Diversity changes in an intensively bred wheat germplasm during the 20th century. Molecular Breeding 9: 1–11. [Google Scholar]
- Coutinho AXP. 1884.Os fenos espontâneos e as palhas de trigo, em Portugal. Estudos Agronómicos, Lisboa: Imprensa Nacional. [Google Scholar]
- Donini P, Law JR, Koebner RMD, Revees JC, Cooke RJ. 2000. Temporal trends in the diversity of UK wheat. Theoretical and Applied Genetics 100: 912–917. [Google Scholar]
- Feldman M, Sears ER. 1981. The wild gene resources of wheat. Scientific American 244: 102–112. [Google Scholar]
- Guedes-Pinto H, Ribeiro-Carvalho C, Pinto-Carnide O, Igrejas G, Nascimento M, Carnide VP, Harrison G, Heslop-Harrison JS, Gateau I, Branlard G. 1998. Studies of Barbela wheat, an old Portuguese landrace with rye introgression. In: Lelley T, ed. Current topics in plant cytogenetics related to plant improvement. Vienna: Universitätsverlag, 175–181. [Google Scholar]
- Igrejas G, Branlard G, Carnide V, Gateau I, Guedes-Pinto H. 1997. Storage protein diversity within the old Portuguese bread wheat Barbela population. Journal of Genetics and Breeding 51: 167–173. [Google Scholar]
- Korzun V, Borner A, Worland AJ, Law CN, Röder MS. 1997. Application of microsatellite markers to distinguish inter-varietal chromosome substitution lines of wheat (Triticum aestivum L.). Euphytica 95: 149–155. [Google Scholar]
- Lapa JIF. 1865.Memória sobre o estudo industrial e químico dos trigos Portugueses. Lisboa, Portugal: Tipografia Academia. [Google Scholar]
- Li A, Ge S. 2001. Genetic variation and clonal diversity of Psammochloa villosa (Poaceae) detected by ISSR markers. Annals of Botany 87: 585–590. [Google Scholar]
- Lukaszewski AJ, Curtis CA. 1993. Physical distribution of recombination in B-genome chromosomes of tetraploid wheat. Theoretical and Applied Genetics 86: 121–127. [DOI] [PubMed] [Google Scholar]
- Nascimento MP, Carnide VP, Igrejas G, Guedes-Pinto H. 1998. High-molecular-weight glutenin subunit variation in the Portuguese wheat landrace Barbela. Cereal Research Communications 26: 211–216. [Google Scholar]
- Nei M. 1972. Genetic distance between populations. American Naturalist 106: 283–292. [Google Scholar]
- Nei M. 1978. Estimation of average heterozygosity and genetic distance from small number of individuals. Genetics 89: 583–590. [DOI] [PMC free article] [PubMed] [Google Scholar]
- Nevo E, Payne PI. 1987. Wheat storage proteins – diversity of HMW glutenin subunits in wild emmer from Israel. I. Geographical patterns and ecological predictability. Theoretical and Applied Genetics 74: 827–836. [DOI] [PubMed] [Google Scholar]
- Pestsova E, Ganal MW, Röder MS. 2000. Isolation and mapping of microsatellite markers specific for the D genome of bread wheat. Genome 43: 689–697. [PubMed] [Google Scholar]
- Plaschke J, Ganal MW, Röder MS. 1995. Detection of genetic diversity in closely-related bread wheat using microsatellite markers. Theoretical and Applied Genetics 91: 1001–1007. [DOI] [PubMed] [Google Scholar]
- Prasad M, Varshney RK, Roy JK, Balyan HS, Gupta PK. 2000. The use of microsatellites for detecting DNA polymorphism, genotype identification and genetic diversity in wheat. Theoretical and Applied Genetics 100: 594–592. [Google Scholar]
- Ribeiro-Carvalho C, Guedes-Pinto H, Harrison G, Heslop-Harrison JS. 1997. Wheat-rye chromosome translocations involving small terminal and intercalary rye chromosome segments in the Portuguese wheat landrace Barbela. Heredity 78: 539–546. [Google Scholar]
- Ribeiro-Carvalho C, Guedes-Pinto H, Heslop-Harrison JS, Schwarzacher T. 2001. Introgression of rye chromatin on chromosome 2D in the Portuguese wheat landrace ‘Barbela’. Genome 44: 1122–1128. [PubMed] [Google Scholar]
- Röder MS, Korzun V, Wendhake K, Plaschke J, Tixier MH, Leroy P, Ganal MW. 1998. A microsatellite map of wheat. Genetics 149: 2007–2023. [DOI] [PMC free article] [PubMed] [Google Scholar]
- Röder MS, Plaschke J, Konig SU, Borner A, Sorrels ME, Tanksley SD, Ganal MW. 1995. Abundance, variability and chromosomal location of microsatellites in wheat. Molecular and General Genetics 246: 327–333. [DOI] [PubMed] [Google Scholar]
- Rolph FJ. 2000.NTSYS, Numerical taxonomy and multivarietal analysis system (2.1). New York, USA: Exeter Software. [Google Scholar]
- Saghai-Maroof MA, Biyashev RM, Yang GP, Zhang Q, Allard RW. 1994. Extraordinarily polymorphic microsatellite DNA in barley: species diversity, chromosomal locations, and population dynamics. Proceedings of the National Academy of Sciences of the USA 91: 5466–5470. [DOI] [PMC free article] [PubMed] [Google Scholar]
- Sharp PJ, Kreis M, Shewry P, Gale MD. 1988. Location of β-amylase sequence in wheat and its relatives. Theoretical and Applied Genetics 75: 289–290. [Google Scholar]
- Stachel M, Lelley T, Grausgruber H, Vollmann J. 2000. Application of microsatellites in wheat (Triticum aestivum L.) for studying genetic differentiation caused by selection for adaptation and use. Theoretical and Applied Genetics 100: 242–248. [Google Scholar]
- Stephenson P, Bryan G, Kirby J, Collins A, Devos K, Busso C, Gale M. 1998. Fifty new microsatellite loci for the wheat genetic map. Theoretical and Applied Genetics 97: 946–949. [Google Scholar]
- Thomas BR, Ford VS, Pickerskly E, Gottlieb, LD. 1993. Molecular characterization of duplicate cytosolic phosphoglucose isomerase genes in Clarkia and comparison to the single-gene in Arabidopsis Genetics 135: 895–905. [DOI] [PMC free article] [PubMed] [Google Scholar]
- Vasconcelos JC. 1933.Trigos Portugueses ou de há muito cultivados no País Subsídios para o seu estudo botânico. Separata do boletim de Agricultura Ano I (1–2), 1 série, Lisboa: Direcção Geral de Acção Social Agrária. [Google Scholar]
- Volis S, Mendlinger S, Turuspekov Y, Esnazarov U, Abugalieva S, Orlovsky N. 2001. Allozyme variation in Turkmenian populations of wild barley, Hordeum spontaneum Koch. Annals of Botany 87: 435–446. [Google Scholar]
- Weir BS. 1990.Genetic data analysis. Methods for discrete genetic data. Sunderland, MA: Sinauer Associates. [DOI] [PubMed] [Google Scholar]
- Wright S. 1978.Evolution and the genetics of populations. Vol. 4. Variability within and among natural populations. Chicago: University of Chicago Press. [Google Scholar]