

Abstract
• Background and Aims Exposure to low temperatures (LT) produces innumerable changes in morphological, biochemical and physiological characteristics of plants, with the result that it has been difficult to separate cause and effect adjustments to LT. Phenotypic studies have shown that the LT-induced protective mechanisms in cereals are developmentally regulated and involve an acclimation process that can be stopped, reversed and restarted. The present study was initiated to separate the developmental factors determining duration from those responsible for rate of acclimation, to provide the opportunity for a more in depth analysis of the critical mechanisms that regulate LT tolerance in wheat (Triticum aestivum).
• Methods The non-hardy spring wheat cultivar ‘Manitou’ and the very cold-hardy winter wheat cultivar ‘Norstar’ were used to produce reciprocal near-isogenic lines (NILs) in which the vrn-A1 (winter) alleles of ‘Norstar’ were inserted into the non-hardy ‘Manitou’ genetic background and the Vrn-A1 (spring) alleles of ‘Manitou’ were inserted in the hardy ‘Norstar’ genetic background so that the effects of duration and rate of LT acclimation could be quantified.
• Key Results Comparison of the acclimation curves of the NILs and their parents grown at 2, 6 and 10 °C established that the full expression of LT-induced genetic systems was revealed only under genotypically dependent optimum combinations of time and temperature. Both duration and rate of acclimation were found to contribute significantly to the 13·8 °C difference in lowest survival temperature between ‘Norstar’ and ‘Manitou’.
• Conclusions Duration of LT acclimation was dependent upon the rate of phenological development, which, in turn, was determined by acclimation temperatures and vernalization requirements. Rate of acclimation was faster for genotypes with the ‘Norstar’ genetic background but the ability to sustain a high rate of acclimation was dependent upon the length of the vegetative stage. Complex time/temperature relationships and unexplained genetic interactions indicated that detailed functional genomic or phenomic analyses of natural allelic variation will be required to identify the critical genetic components of a highly integrated system, which is regulated by environmentally responsive, complex pathways.
Key words: Low-temperature tolerance, Vrn-A1, near-isogenic lines, developmental regulation, vernalization, cold acclimation, Triticum aestivum, wheat
INTRODUCTION
Low-temperature (LT) tolerance is a complex quantitative character that is expressed following exposure of plants to temperatures that approach freezing. The biochemical, physiological and morphological changes associated with LT tolerance clearly affect active growth and development and, as a result, a plant must be programmed to recognize and respond to temperatures that are favourable for growth and to the environmental cues that signal seasonal changes. In wheat and its relatives, LT acclimation is normally described as a cumulative process that is initiated below approx. 10 °C (Fowler et al., 1999). There is an inverse relationship between temperature and acclimation rate and, when plants are grown at constant temperatures in the acclimation range, the most rapid changes in LT tolerance occur during the initial stages of acclimation. Exposure of hardened plants to higher temperatures results in rapid de-acclimation, but the process of LT acclimation can be re-initiated by exposing plants that are still in the vegetative stage to inducing temperatures. However, winter cereal plants gradually lose their ability to tolerate below-freezing temperatures when they are maintained for long periods of time (i.e. over winter) at temperatures that normally promote LT acclimation.
Time sequence studies have shown that LT-induced gene expression is developmentally regulated (Fowler et al., 1996a) and that the decline in LT response during winter is due to an inability of cereals to maintain a high level of LT-tolerance gene expression once vernalization (Fowler et al., 1996b) and photoperiod (Mahfoozi et al., 2000, 2001b; Fowler et al., 2001) requirements have been satisfied. It has been demonstrated that the expression of wheat genes with sequence homology to members of the AP1 branch of plant MADS-box meristem identity genes is regulated by both photoperiod and cumulative low temperatures, and that the accumulation of their encoded products is associated with the progressive repression of cold-induced genes and a decrease in LT tolerance (Danyluk et al., 2003). It has also been shown that the photoperiod and vernalization genes influence the expression of LT-induced genes in cereals through separate pathways that eventually converge to activate genes controlling plant development (Fowler et al., 2001). In both instances, delay in the transition from the vegetative to the reproductive stage causes increases in LT tolerance that are sustained for longer in plants that have a vernalization or photoperiod requirement. This indicates that the developmental genes determine the duration of expression of LT-induced structural genes. In winter-habit genotypes, photoperiod sensitivity influences LT-tolerance gene expression even before vernalization saturation (Mahfoozi et al., 2001b), implying that vernalization is progressive and that plant development can be influenced by photoperiod during the vernalization process.
These observations confirm that the factors responsible for LT tolerance affect active growth, and that the linkage of LT-tolerance expression to phenological development is adaptive for the environment for which the genotype was selected or in which it evolved. For example, plants germinating in the spring do not have a requirement for a high level of LT tolerance, as they complete their life cycle during the summer and early autumn; a high level of LT tolerance is no longer required in over-wintering cereals after the onset of warm conditions in the spring when rapid growth and reproduction begin. In fact, for species adapted to regions with long, mild winters, a high level of freezing tolerance may be less important than a photoperiod, dormancy or vernalization requirement that prevents the plants from entering the extremely cold-sensitive reproductive growth stage until the risk of LT damage has passed.
A long-term research challenge has been to isolate the different variables involved in the expression of plant LT tolerance so that the critical responses to the environment can be identified and exploited in crop improvement programmes. A basic understanding of the LT responses in cereals has allowed the construction of a field-validated LT-tolerance simulation model (Fowler et al., 1999), where the developmental genes (for vernalization, photoperiod, etc.) are assumed to be responsible for the duration of expression of LT-induced structural genes (Fowler et al., 1996b; Mahfoozi et al., 2000), whereas the rate of acquisition of LT tolerance is determined by genotypic differences in cold-hardiness potential. Vernalization requirements prevent the plant from initiating reproductive development during periods that are favourable for growth and development in the autumn and early winter (Fowler et al., 1996a, b), and photoperiod sensitivity allows plants to maintain a high level of LT-gene expression for longer under short day, compared with long day, environments (Mahfoozi et al., 2000). In each case, delay in the transition from the vegetative to the reproductive phase results in increased LT tolerance that is sustained for longer than in plants that do not have a vernalization or photoperiod requirement. The fact that only two types of variable are required to simulate plant LT response in the model suggests that the genetic basis for this environmentally induced character is quite simple. However, dependence upon a highly integrated system of structural, regulatory and developmental genes that allow full expression of LT-induced genes only when they are required in the life cycle has meant that the genetic control of this character has been difficult to explain.
Reports from phenotypic studies suggest that genes on as many as 15 out of 21 chromosomes affect LT tolerance in wheat (Stushnoff et al., 1984; Sutka, 1994). Although quantitative genetic studies indicate that LT tolerance is primarily under additive multigenic control, major effects associated with the Vrn-A1 region on chromosome 5A have proved to be an important exception to this rule; at least one gene on chromosome 5A of wheat has a dominant effect for LT tolerance that is normally expressed in association with the recessive vrn-A1 allele for winter growth habit (Brule-Babel and Fowler, 1988; Sutka and Snape, 1989). Also, in spite of the apparent abundance of genetic variation for this character, molecular mapping studies indicate that only the homoeoallelic series of genes associated with winter/spring-growth habit on the group 5 chromosomes has a major influence on LT tolerance (Toth et al., 2003). A set of reciprocal near-isogenic lines, in which Vrn-A1 alleles have been inserted into cold tender and hardy genetic backgrounds has allowed quantification of the effects of the Vrn-A1 region on LT acclimation in two genetic backgrounds that represent extremes in LT tolerance (Limin and Fowler, 2002). This paper reports the results of a detailed study that was designed to separate out the factors determining duration and rate of LT acclimation, thereby providing the opportunity for a more in-depth analysis of the critical variables that determine LT tolerance in wheat.
MATERIALS AND METHODS
Reciprocal near-isogenic lines
Reciprocal near-isogenic lines (NILs) of Triticum aestivum L. were produced for this experiment using the non-hardy spring-habit (Vrn-A1) cultivar ‘Manitou’ and the very cold-hardy winter-habit (vrn-A1) cultivar ‘Norstar’ to determine the effect of spring/winter-habit-determining alleles in each genetic background. Vrn1 genes on homoeologous chromosomes have previously (Brule-Babel and Fowler, 1988) been shown to be recessive in ‘Norstar’, making Vrn-A1 allelic differences responsible for determination of growth habit in these parents. The parent cultivars were crossed to produce an initial hybrid that was then backcrossed to each parent. In subsequent generations, each cultivar was crossed to the BCF1 of the previous generation based on selection for heterozygosity (Vrn1/vrn1) at the Vrn-A1 locus. When ‘Norstar’ was the recurrent parent, heterozygosity at the Vrn-A1 locus was based on the spring habit, which would be Vrn1/vrn1, due to the dominance of the spring-habit allele, whereas all other progeny would be of winter habit. When ‘Manitou’ was the recurrent parent, heterozygosity (Vrn1/vrn1) at the Vrn-A1 locus was based on the heterozygotes' flowering time, which was several weeks later than that of the homozygous (Vrn1/Vrn1) spring habit. This phenotype-based selection ensured that the donor parent allele was incorporated into the genetic background of the recurrent parent (Limin and Fowler, 2002). Ten backcrosses were made to each recurrent parent, heterozygous plants of each reciprocal line were self-pollinated and the progeny grown out. Homozygous winter-and spring-growth-habit plants were selected from the selfed progeny of each reciprocal line.
This procedure resulted in reciprocal NILs in which, theoretically, 99·95 % of the recurrent parent DNA is recovered. These reciprocal NILs, based on the Vrn-A1 locus, produced, in essence, a winter-habit type of non-hardy ‘Manitou’ (‘Manitou’ with the vrn-A1 allele of ‘Norstar’ = winter ‘Manitou’) and a spring-habit type of the hardy winter ‘Norstar’ (‘Norstar’ with Vrn-A1 from ‘Manitou’ = spring ‘Norstar’). The non-hardy spring-habit ‘Manitou’, the very cold-hardy winter-habit ‘Norstar’, and the two reciprocal NILs that differed in vernalization requirement were used in these studies.
Experimental design and data analyses
The experimental design for these studies was a 4 (genotypes) × 16 (acclimation periods) × 3 (acclimation temperatures) factorial in a two replicate randomized complete block design. The parental cultivars, ‘Norstar’ and ‘Manitou’, and the NILs, spring ‘Norstar’ and winter ‘Manitou’, were evaluated over 16 acclimation periods (0, 2, 7, 14, 21, 28, 35, 42, 49, 56, 63, 70, 77, 84, 91 and 98 d) and at three acclimation temperatures (2, 6 and 10 °C). Analyses of variance were conducted to determine the level of significance of differences due to genotype, acclimation period and acclimation temperature and their interactions. Where significant differences were identified, regression analyses of treatment means were used to plot curves that gave the best description of the shape and behaviour of the responses. A sigmoid four-parameter equation was employed to describe the relationship between final leaf number (FLN) and days of acclimation at 2, 6 and 10 °C:
 |
The peak four parameter Weibull equation was used to describe the relationship between LT50 and days of acclimation at 2, 6 and 10 °C:
 |
Non-linear regression procedures outlined by SigmaPlot (2000) were used to provide least squares estimates of the regression coefficients in these equations.
LT50 and vernalization determination
Imbibed seeds for double-ridge analyses and LT50 studies were held in the dark for 2 d at 4 °C and then transferred to an incubator and held for 1 d at 22 °C. Actively germinating seeds were transferred, embryo down, to Plexiglass trays with holes backed by a 1·6-mm mesh screen (Fowler et al., 1983) and returned to germinating conditions for 2 d (until their roots were 1–2 cm long). These seedlings were grown for 10 d in hydroponic tanks filled with continuously aerated one-half strength modified Hoagland's solution (Brule-Babel and Fowler, 1988) at 20 °C in 16-h days at 320 µmol m−2 s−1 PPFD, by which time they had three or four fully expanded leaves and visible crowns. They were then transferred to 2, 6 and 10 °C chambers under a 16-h photoperiod and 220 µmol m−2 s−1 PPFD and sampled at regular intervals.
The procedure outlined by Limin and Fowler (1988) was used to determine the LT50 (temperature at which 50 % of the plants are killed by LT stress) of each genotype at the end of each LT acclimation period. Crowns were covered in moist sand in aluminium weighing cans and placed in a programmable freezer that was held at −3 °C for 12 h. After 12 h they were cooled at a rate of 2 °C h−1 down to −17 °C, then cooled at a rate of 8 °C h−1. Five crowns were removed from the freezer at 2 °C intervals for each of five test temperatures selected for each genotype in each treatment. Samples were then thawed overnight at 4 °C. Thawed crowns were transplanted into 52 × 26 × 6 cm black plastic trays (Kord Products, Bramalea, ON, Canada) containing ‘Redi-earth’ (W. R. Grace and Co. of Canada Ltd, Ajax, ON, Canada) for re-growth. The boxes were placed in a growth room maintained at 20 °C with a 20-h day and 4-h night. Plant recovery was rated (alive vs. dead) after 3 weeks, and LT50 was calculated for each sample. LT50 values were determined for the four genotypes for the 16 acclimation periods at 2, 6 and 10 °C.
Two sets of phenological observations were made to determine (1) double-ridge formation and (2) FLN. For the ‘double-ridge’ method (Kirby and Appleyard, 1987), the stage of shoot apex development was determined on crown samples of plants grown under the conditions for LT acclimation described above. A minimum of two plants from each of the four genotypes was sampled for dissection at each of the 16 acclimation periods at 2, 6 and 10 °C and mean number of days to double-ridge formation was recorded to establish the influence of LT growth on rate of phenological development. Although double-ridge formation is not a true index of the start of reproductive development, it is the first visible indication that the signal to initiate reproductive development has been received. As such, it provides a useful method for comparing the phase of phenological development of genotypes with large differences in vegetative/reproductive transition. Time to vernalization saturation was estimated using the FLN procedure described by Wang et al. (1995). Germinated seeds for FLN measurements were grown at 20 °C in 16-h photoperiod for 13 d in pots (two plants per pot), exposed to 2, 6 or 10 °C as outlined in the acclimation regime above, and then transferred weekly to 20 °C chambers under conditions favouring floral induction (20 °C, 16-h photoperiod). The tops of the pots were wrapped in aluminium foil to minimize radiant heat absorption from the lights, and the plants were uniformly fertilized with ‘Osmocote’ (Chisso-Asahi Fertilizer Co., Tokyo, Japan) sustained-release fertilizer and a nutrient-complete (‘Tune-up’ TM, Plant Products Ltd, Brampton, ON, Canada) water-soluble solution as required. Leaves were numbered and the plants were grown until the flag leaf emerged and the FLN on the main shoot could be determined. Saturation of the vernalization requirement was considered complete for each genotype once the cold treatment no longer reduced its FLN. Stage of apical development was also determined for each set of plants grown at 20 °C for 10 d after they had been removed from vernalization at 2, 6 or 10 °C and the mean number of days to double-ridge formation was recorded.
RESULTS AND DISCUSSION
Phenological development
Analysis of variance for FLN showed that the effects of genotype, acclimation period and the genotype × acclimation period interaction were highly significant (P < 0·001). The effect of acclimation temperature on FLN was not significant (P > 0·05) but the genotype × acclimation temperature and genotype × acclimation period × acclimation temperature interactions were all highly significant (P < 0·001). Analyses of the FLN response curves revealed that differences in the responses of the spring- and winter-habit genotypes were mainly responsible for these important interactions (Fig. 1).
Fig. 1.

Final leaf number of ‘Manitou’, winter ‘Manitou’, ‘Norstar’ and spring ‘Norstar’ acclimated at 2, 6 and 10 °C for 0–98 d and then moved to 20 °C (s.e. of data points = 0·35). See Table 1 for regression coefficients.
Once the vernalization requirement has been satisfied, the plant can enter the reproductive phase rapidly under conditions favouring floral induction (Hay and Kirby, 1991; Mahfoozi et al., 2001a). Thus vernalization can be considered complete when an additional cold treatment fails to cause a further reduction in FLN (Wang et al., 1995; Brooking and Jamieson, 2002) and the achievement of vernalization saturation can be established by determining when the lowest FLN is reached. As reported by Limin and Fowler (2002), replacing the vrn-A1 region of ‘Norstar’ with the Vrn-A1 region from ‘Manitou’ created a spring-habit ‘Norstar’ (spring ‘Norstar’) without a vernalization response, in contrast to the strong vernalization requirement in the ‘Norstar’ parent (Fig. 1). As expected, ‘Manitou’ and the spring ‘Norstar’ lines reached their lowest leaf number without being exposed to acclimating temperatures, indicating that they do not have a vernalization requirement. However, spring ‘Norstar’ (Vrn-A1) produced 10·3 leaves compared with 8·0 leaves for ‘Manitou’ (Fig. 1) indicating that the ‘Norstar’ genetic background had a significant (P < 0·001) influence on FLN that was independent of the vernalization response.
Replacing the Vrn-A1 region of ‘Manitou’ with the vrn-A1 region from ‘Norstar’ converted ‘Manitou’ into a vernalization-responsive winter-habit type (winter ‘Manitou’). In earlier studies, Limin and Fowler (2002) reported that the mean leaf number at vernalization saturation was reduced from 22·5 to 13·1 for ‘Norstar’ and 15·4 to 9·9 for winter ‘Manitou’ grown at 20 °C and 4 °C, respectively. The winter ‘Manitou’ reached its lowest leaf number after approx. 35 d of vernalization, whereas ‘Norstar’ required an extra week at 4 °C. Although both genotypes have the ‘Norstar’ vrn-A1 alleles, ‘Norstar’ produced 3·2 more leaves than winter ‘Manitou’. Similar responses were observed for both ‘Norstar’ and winter ‘Manitou’ when vernalized at 6 °C in the present study; however, the minimum FLNs were greater for both winter-habit genotypes at 10 °C than at 6 °C, and these, in turn, were greater than at 2 °C (Fig. 1; y0 in Table 1). The mean leaf number of ‘Norstar’ was reduced from 22·0 to 15·1 at 10 °C, 12·7 at 6 °C and 10·9 at 2 °C. Similar effects of temperature were observed for winter ‘Manitou’ where the mean leaf number was reduced from 15·8 to 10·5 at 10 °C, 9·5 at 6 °C and 8·7 at 2 °C.
Table 1.
Estimated regression coefficients (sigmoid four-parameter equation) for FLN of ‘Norstar’ and winter ‘Manitou’ acclimated at 2, 6 and 10 °C for 0–98 d (see Fig. 1)
| Regression coefficient |
||||||||||
|---|---|---|---|---|---|---|---|---|---|---|
| Cultivar |
Vernalization temperature (°C) |
a |
b |
x0 |
y0* |
R2 |
||||
| Winter ‘Manitou’ | 10 | 6·54 | −8·51 | 13·1 | 10·5 | 0·961 | ||||
| 6 | 6·38 | −3·78 | 16·1 | 9·5 | 0·993 | |||||
| 2 | 7·59 | −6·23 | 21·6 | 8·7 | 0·993 | |||||
| ‘Norstar’ | 10 | 8·81 | −8·55 | 11·2 | 15·1 | 0·965 | ||||
| 6 | 9·68 | −5·07 | 17·0 | 12·7 | 0·987 | |||||
| 2 | 13·09 | −8·83 | 17·4 | 10·9 | 0·983 | |||||
Estimate of lowest final leaf number.
The FLN for the winter genotypes increased as vernalization temperature increased; however, the actual days to vernalization saturation, as measured by time to FLN, remained relatively unchanged (Fig. 1), although days to double-ridge formation after removal to 20 °C suggested that there may have been more rapid phenological development when plants were vernalized at 6 °C (Table 2). FLN measurements indicated that winter ‘Manitou’ did not reach vernalization saturation until approx. 42 d, whereas ‘Norstar’ was approx. 1 week later when grown at 2, 6 and 10 °C (Fig. 1). In contrast, dissection of shoot apices revealed that double-ridge formation was delayed when both spring and winter genotypes were held at constant vernalization temperatures of 10 °C or less, even after vernalization saturation was complete in the winter-habit plants (Table 2). This indicates that low temperatures extended the vegetative phase and delayed transition to the reproductive phase, even though both the spring and winter-habit plants were fully capable of reproductive transition when transferred to 20 °C (floral induction conditions). These observations are in agreement with earlier observations that both temperature and photoperiod affect the fate of shoot primordia after they have received the signal to switch from the vegetative to the reproductive phase but have not committed to the double-ridge stage (Gott et al., 1955; Hempel et al., 1998; Mahfoozi et al., 2001b).
Table 2.
Apical development of ‘Manitou’, spring ‘Norstar’, winter ‘Manitou’ and ‘Norstar’ when (a) vernalized at 2, 6 or 10 °C or (b) vernalized at 2, 6 or 10 °C for the time indicated and then moved to 20 °C for 10 d
| Mean number of days to double-ridge formation |
|||||||||||
|---|---|---|---|---|---|---|---|---|---|---|---|
| (a) Constant temperature (°C) |
(b) Vernalization (°C) plus 10 d at 20 °C |
||||||||||
| Genotype |
2 |
6 |
10 |
2 |
6 |
10 |
|||||
| ‘Manitou’ | 52 | 28 | 12 | 0 | 0 | 0 | |||||
| Spring ‘Norstar’ | 70 | 35 | 18 | 4 | 3 | 3 | |||||
| Winter ‘Manitou’ | 98 | 60 | 60 | 39 | 32 | 44 | |||||
| ‘Norstar’ | >98 | 84 | 77 | 63 | 56 | 60 | |||||
Vernalization requirement is the key difference between spring and winter-habit genotypes in cereals, and the phenotypic expression of this character has been studied in detail (McIntosh et al., 1998). As indicated earlier, the vrn-A1 of ‘Norstar’ is recessive to the Vrn-A1 of ‘Manitou’ making Vrn-A1 allelic differences responsible for the determination of growth habit in these genotypes (Brule-Babel and Fowler, 1988). The inability to recover completely what is supposedly a single growth-habit gene in the backcross programme, that produced the NILs in the present study, raises a number of questions with regard to the complexity of interactions among genes in the flowering pathway. There are at least 80 genes and loci and a number of genetic pathways known to affect flowering time in the model plant Arabidopsis thaliana (Simpson et al., 1999; Simpson and Dean, 2002; Ratcliffe et al., 2003) and it should not be unexpected to find as complex a regulatory system in wheat. Using the Arabidopsis model as a basis for discussion, it can be seen that a comparable picture is unfolding in wheat (Fowler and Limin, 2003). Multiple copies of an autonomous flower-promoting pathway gene that is orthologous (diverging after a speciation event) to those found in arabidopsis are located in the Vrn1 regions of the wheat genome (Limin et al., 2003). This type of genetic redundancy is not uncommon and it is thought to provide raw material for evolution (Haake et al., 2002; Martinez-Castilla and Alvarez-Buylla, 2003). Clusters of autonomous flower-promoting pathway orthologues that are tightly linked to the major growth-habit gene, Vrn-A1, would be expected to segregate as a group in spring × winter crosses suggesting the existence of a single gene that is dominant for spring habit when a broad classification of spring and winter habit is used. However, close examination of early-generation spring and winter populations has revealed a wide range of variation in the vegetative/reproductive transition that can be explained by different degrees of erosion (break-up of tight linkage blocks due to recombination) of the autonomous pathway linkage blocks (Limin et al., 2003). A gradual erosion, or addition of tightly linked autonomous flowering pathway alleles, which promote or delay the vegetative/reproductive transition, provides one possible explanation for the inability to recover fully the spring or winter phenotypes of the Vrn-A1 locus (spring ‘Norstar’ vs. ‘Manitou’, winter ‘Manitou’ vs. ‘Norstar’) in the backcross programme that produced the NILs in the present study (Fig. 1).
LT tolerance
A rapid initial rate of LT acclimation, which gradually slowed and was followed by a loss in LT tolerance after the vegetative/reproductive transition, resulted in the typical curvilinear relationship between LT50 and days of acclimation (Fowler et al., 1996b) when temperatures were held constant at 2, 6 and 10 °C (Fig. 2). Analysis of variance for LT50 showed that genotype, acclimation period, acclimation temperature and all interactions had highly significant effects (P < 0·001), indicating that there were important genotypic differences in both the magnitude and pattern of LT50 response to temperature. These results were not unexpected because the genotypes and the range of acclimating temperatures were selected to maximize differences.
Fig. 2.
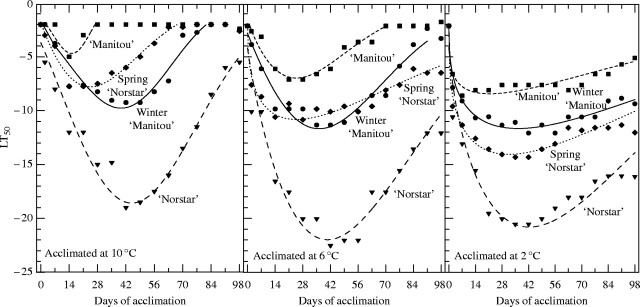
Low-temperature tolerance (LT50) of ‘Norstar’, spring ‘Norstar’, ‘Manitou’ and winter ‘Manitou’ acclimated at 2, 6 and 10 °C for 0 to 98 d (s.e. of data points = 0·65). See Table 3 for regression coefficients.
The mean difference in minimum LT50 between ‘Manitou’ and ‘Norstar’ was 13·8 °C for the three acclimation temperatures considered in this study (a in Table 3). This wide range in LT tolerance, and use of NILs for the Vrn-A1 region of a hardy winter and tender spring-habit wheat, allowed separation of the effects of the genetic factors responsible for the differences in duration and rate of acclimation. The effect of an extended vegetative period due to a vernalization requirement was clearly evident in the longer time to lowest LT50 in the winter-habit genotypes compared with their spring NILs (Fig. 2). Insertion of the ‘Norstar’ vrn-A1 region into ‘Manitou’ produced a winter ‘Manitou’ that reached lowest LT50 after 36–40 d compared with from 41 to 45 d for ‘Norstar’ (Fig. 2 and Table 3). A longer vegetative period, during which the LT-tolerance genes were expressed at a high level due to a vernalization requirement, provided an explanation for the improved LT tolerance of winter ‘Manitou’ compared with ‘Manitou’ at all acclimating temperatures.
Table 3.
Estimated regression coefficients (peak four-parameter Weibull equation) for LT50 of ‘Manitou’, ‘Norstar’, winter ‘Manitou’ and spring ‘Norstar’ acclimated at 2, 6 and 10 °C for 0–98 d (see Fig. 2)
| Regression coefficient |
||||||||||
|---|---|---|---|---|---|---|---|---|---|---|
| Cultivar |
Acclimation temperature (°C) |
a* |
b |
C |
x0† |
R2 |
||||
| ‘Manitou’ | 10 | −4·7 | 33·0 | 3·80 | 14·3 | 0·947 | ||||
| 6 | −6·9 | 43·4 | 1·72 | 24·3 | 0·914 | |||||
| 2 | −8·3 | 112·1 | 1·17 | 21·6 | 0·886 | |||||
| Spring ‘Norstar’ | 10 | −7·8 | 41·6 | 1·84 | 24·2 | 0·954 | ||||
| 6 | −10·7 | 83·9 | 1·27 | 24·8 | 0·916 | |||||
| 2 | −14·0 | 114·8 | 1·25 | 31·7 | 0·939 | |||||
| Winter ‘Manitou’ | 10 | −9·8 | 74·5 | 3·23 | 39·6 | 0·920 | ||||
| 6 | −11·6 | 60·2 | 1·95 | 36·2 | 0·939 | |||||
| 2 | 11·6 | 123·7 | 1·27 | 36·5 | 0·947 | |||||
| ‘Norstar’ | 10 | −18·6 | 71·0 | 2·38 | 44·6 | 0·969 | ||||
| 6 | −22·0 | 71·5 | 1·71 | 40·5 | 0·929 | |||||
| 2 | −20·8 | 89·8 | 1·50 | 42·3 | 0·920 | |||||
Estimate of lowest LT50.
Estimate of days to reach lowest LT50.
The more rapid rate of acclimation associated with genetic backgrounds such as ‘Norstar’ compared with winter ‘Manitou’ (Fig. 2) provided an explanation for the differences observed in the cold hardiness potential of genotypes with a vernalization requirement. The genetic advantage provided by the ‘Norstar’ background was also clearly evident in the increased initial (0–14 d) rate of acclimation in spring ‘Norstar’ compared with ‘Manitou’, especially when acclimated at 6 °C and 10 °C (Fig. 2). An analysis of variance using only the 0–14 day, 6 and 10 °C data revealed that differences in LT50 due to growth habit (‘Manitou’ and spring ‘Norstar’ vs. ‘Norstar’ and winter ‘Manitou’) were not significant (P > 0·05) during this period, whereas the ‘Norstar’ background (‘Norstar’ and spring ‘Norstar’) provided a significant (P < 0·01) advantage over that of ‘Manitou’ (‘Manitou’ and winter ‘Manitou’). However, the ability of genotypes with a ‘Norstar’ background to sustain such a high initial rate of acclimation was dependent on the length of the vegetative stage. A longer vegetative stage, involving the production of an extra 2·3 leaves (Fig. 1), combined with a faster rate of acclimation to ensure that spring ‘Norstar’ had much lower values of LT50 than ‘Manitou’ under all three acclimation regimes (Fig. 2).
A clear example of the importance of a positive rate-determining genetic background was demonstrated when the LT50 values of winter ‘Manitou’ and spring ‘Norstar’ plants, following acclimation at 2, 6 and 10 °C, were compared. An extended vegetative period allowed winter ‘Manitou’ to acclimate to a lower LT50 than spring ‘Norstar’ (−9·8 vs. −7·8 °C; a in Table 3) at 10 °C (Fig. 2). In comparison, a more rapid rate of acclimation during the first 2 weeks at 6 °C allowed spring ‘Norstar’ to reduce (−11·6 vs. −10·7 °C, a in Table 3) the cold hardiness advantage showed by winter ‘Manitou’ at 10 °C (Fig. 2). The inverse relationship between acclimation rate and temperature (Fowler et al., 1999) and a major delay in commitment to the vegetative/reproductive transition of spring ‘Norstar’ meant that the more rapid rate of acclimation associated with the ‘Norstar’ genetic background allowed spring ‘Norstar’ to acclimate to even lower temperatures than winter ‘Manitou’ (−14·0 vs. −11·6 °C, a in Table 3) when grown at 2 °C (Fig. 2).
In winter-growth-habit genotypes, a vernalization requirement delays the vegetative/reproductive transition and allows LT-tolerance genes to maintain a high level of expression for a longer period of time at acclimation temperatures (Fowler et al., 1996a). Low acclimation temperatures can also delay the vegetative/reproductive transition (Table 2) and allow the spring-habit genotypes to maintain a high level of LT-tolerance gene expression for longer time. The increased expression of LT tolerance associated with the delayed transition from the vegetative to the reproductive stage was especially noticeable for spring ‘Norstar’ when the acclimating temperature was reduced to 2 °C in the present study (Fig. 2 and Table 3) supporting the hypothesis (Fowler et al., 1996a) that any factor that delays the transition from the vegetative to the reproductive stage increases the duration of expression of LT-tolerance genes in cereals exposed to acclimating temperatures.
Duration by rate of acclimation interactions
Exposure of plants to low temperatures produces many measurable changes in morphological, biochemical and physiological characters that are commonly highly correlated with plant freezing tolerance (Levitt, 1980). These complex responses have made it difficult to separate cause and effect adjustments to low temperatures. The duration of LT-tolerance gene expression has been shown to be determined by the rate of phenological development and the time to the vegetative reproductive transition, which, in turn, is a function of vernalization requirement, photoperiod requirement, leaf number, length of phyllochron (Limin and Fowler, 2002) and low temperatures that delay reproductive transition in spring-habit genotypes (Fig. 2 and Table 3). It has also been shown that the mechanism regulating the level of expression of LT-induced genes is associated with a gene(s) integrated into the developmental pathway and the rate of acclimation is determined by acclimation temperature and LT-tolerance genetic potential (Fowler et al., 1999; Fig. 2).
As indicated above, time sequence studies have shown that the transition from the vegetative to the reproductive phase is the critical switch that initiates the repression of LT-tolerance genes (Fowler et al., 2001; Danyluk et al., 2003). Consequently, full expression of LT tolerance occurs only in the vegetative phase whereas plants in the reproductive phase have a limited ability to acclimate to LT. This interaction makes LT-tolerance-related characters or genes appear to be associated with genes that determine flowering time, explaining the pleiotropic effect (growth habit and LT tolerance) attributed to genes like vrn-A1 (Brule-Babel and Fowler, 1988). Substitution of the Vrn-A1 region from ‘Manitou’ with the vrn-A1 region from ‘Norstar’ converted the spring-habit cultivar, ‘Manitou’, into a winter type (winter ‘Manitou’). This manipulation allowed the isolation of the duration effects of the Vrn-A1 region (Fig. 1) without changing the genes that determine the rate of LT acclimation. Conversely, substitution of the vrn-A1 region of ‘Norstar’ with the Vrn-A1 region from ‘Manitou’ converted the winter-habit cultivar, ‘Norstar’, into a spring-type (spring ‘Norstar’), which reduced the length of time to the vegetative reproductive transition of ‘Norstar’ (Fig. 1) without altering the genes that determine its rate of acclimation. Based on the results of this study, it can be concluded that the LT-tolerance rate-determining gene(s) can be separated from the Vrn-A1 region, but their location remains to be determined.
An LT-tolerance gene (designated Fr1 by Sutka and Snape, 1989) that is tightly linked to Vrn-A1 of chromosome 5A has been reported (Galiba et al., 1995). Related research has revealed a homoeologous series of frost-resistance genes that are closely linked to the Vrn genes on the group 5 chromosomes in hexaploid wheat (Toth et al., 2003), T. monococcum (Vagujfalvi et al., 2003) and barley (Hayes et al., 1993). However, most of the mapping studies have utilized spring/winter comparisons that include the confounding effects of duration of LT gene expression due to differences at the Vrn region; and winter/winter comparisons have accounted for only about 0·5 °C of the differences in LT tolerance (Storlie et al., 1998). The fact that phenotypic studies suggest that genes on as many as 15 out of 21 chromosomes have a largely quantitative effect on LT tolerance in wheat (Stushnoff et al., 1984; Sutka, 1994), whereas the major vrn and Fr genes are restricted to the group 5 chromosomes, also requires further explanation.
The results of this study support the hypothesis (Fowler et al., 1999) that developmental genes are responsible for the duration of expression of LT-tolerance genes, whereas the rate of acquisition of LT tolerance is determined by genotypic differences in acclimation potential. They also demonstrate that the genetic factors responsible for phenological development and rate of acclimation interact with environmental variables to determine LT-tolerance gene expression and plant LT tolerance, with the result that the full expression of LT-induced genetic systems can be observed only under genotypically dependent optimum combinations of time and temperature. The complex interactions among genotype, acclimation period and acclimation temperature revealed in the statistical analyses of the data in this study, combined with the inability to recover completely what is supposedly a single growth-habit gene in a backcross programme, suggests that additional detailed studies will be required to isolate the components of this highly integrated, environmentally responsive genetic system.
Acknowledgments
Financial support from a Genome Canada research grant is gratefully acknowledged. The excellent technical assistance of Garcia Schellhorn and Twyla Chastain is greatly appreciated. The helpful comments made by the reviewers are also gratefully acknowledged.
LITERATURE CITED
- Brooking IR, Jamieson PD. 2002. Temperature and photoperiod response of vernalization in near-isogenic lines of wheat. Field Crops Research 79: 21–38. [Google Scholar]
- Brule-Babel AL, Fowler DB. 1988. Genetic control of cold hardiness and vernalization requirement in winter wheat. Crop Science 28: 879–884. [Google Scholar]
- Danyluk J, Kane NA, Breton G, Limin AE, Fowler DB, Sarhan F. 2003.TaVRT-1, a putative transcription factor associated with vegetative to reproductive transition in cereals. Plant Physiology 132: 1–11. [DOI] [PMC free article] [PubMed] [Google Scholar]
- Fowler DB, Limin AE 2003. Functional genomics of low-temperature stress. In: Pogna NE, Romano M, Pogna EA, Galterio G, eds. Proceedings of the 10th International Wheat Genetics Symposium, Istituto Sperimentale per la Cerealicoltura, Rome, Italy, 949–951. [Google Scholar]
- Fowler DB, Breton G, Limin AE, Mahfoozi S, Sarhan F. 2001. Photoperiod and temperature interactions regulate low-temperature-induced gene expression in barley. Plant Physiology 127: 1676–1681. [PMC free article] [PubMed] [Google Scholar]
- Fowler DB, Chauvin LP, Limin AE, Sarhan F. 1996. The regulatory role of vernalization in the expression of low-temperature-induced genes in wheat and rye. Theoretical and Applied Genetics 93: 554–559. [DOI] [PubMed] [Google Scholar]
- Fowler DB, Limin AE, Gusta LV. 1983. Breeding for winter hardiness in wheat. In: Fowler DB, Gusta LV, Slinkard AE, Hobin BA, eds. New frontiers in winter wheat production. Saskatoon, Canada: Division of Extension and Community Relations, University of Saskatchewan, 136–148. [Google Scholar]
- Fowler DB, Limin AE, Ritchie JT. 1999. Low-temperature tolerance in cereals: model and genetic interpretation. Crop Science 39: 626–633. [Google Scholar]
- Fowler DB, Limin AE, Wang SY, Ward RW. 1996. Relationship between low-temperature tolerance and vernalization in wheat and rye. Canadian Journal of Plant Science 76: 37–42. [Google Scholar]
- Galiba G, Quarrie SA, Sutka J, Morgounov A, Snape JW. 1995. RFLP mapping of the vernalization (Vrn1) and frost resistance (Fr1) genes on chromosome 5A of wheat. Theoretical and Applied Genetics 90: 1174–1179. [DOI] [PubMed] [Google Scholar]
- Gott MB, Gregory FG, Purvis ON. 1955. Studies in vernalization of cereals. XIII. Photoperiodic control of stages in flowering between initiation and ear formation in vernalised and unvernalised Pektus winter rye. Annals of Botany 21: 87–126. [Google Scholar]
- Haake V, Cook D, Riechmann JL, Pineda O, Thomashow MF, Zhang JZ. 2002. Transcription factor CBF4 is a regulator of drought adaptation in Arabidopsis Plant Physiology 130: 639–648. [DOI] [PMC free article] [PubMed] [Google Scholar]
- Hay RKM, Kirby EJM. 1991. Convergence and synchrony – a review of the coordination of development in wheat. Australian Journal of Agricultural Research 42: 661–700. [Google Scholar]
- Hayes PM, Blake T, Chen THH, Tragoonrung S, Chen F, Pan A, Liu B. 1993. Quantitative trait loci on barley (Hordeum vulgare L.) chromosome 7 associated with components of winter hardiness. Genome 36: 66–71. [DOI] [PubMed] [Google Scholar]
- Hempel FD, Zambryski PC, Feldman LJ. 1998. Photoinduction of flower identity in vegetatively biased primordia. Plant Cell 10: 1663–1675. [DOI] [PMC free article] [PubMed] [Google Scholar]
- Kirby EJM, Appleyard M. 1987.Cereal development guide, 2nd edn. Stoneleigh, UK: Arable Unit, National Agricultural Centre. [Google Scholar]
- Levitt J. 1980. Chilling, freezing and high temperature stresses. In: Kozlowski TT, ed. Response of plants to environmental stresses, 2nd edn. New York: Academic Press, 67–344. [Google Scholar]
- Limin AE, Fowler DB. 1988. Cold hardiness expression in interspecific hybrids and amphiploids of the Triticeae Genome 30: 361–365. [Google Scholar]
- Limin AE, Fowler DB. 2002. Developmental traits affecting low-temperature tolerance response in near-isogenic lines for the vernalization locus Vrn-A1 in wheat (Triticum aestivum L. em Thell). Annals of Botany 89: 579–585. [DOI] [PMC free article] [PubMed] [Google Scholar]
- Limin AE, Gao M, Selvaraj G, Fowler DB. 2003. The phenotypically defined Vrn-1 region of wheat: evidence of multiple copies of Arabidopsis autonomous flowering pathway orthologs and their effect on flowering. In: Pogna NE, Romano M, Pogna EA, Galterio G, eds. Proceedings the 10th International Wheat Genetics Symposium, Istituto Sperimentale per la Cerealicoltura, Rome, Italy, 983–985. [Google Scholar]
- Mahfoozi S, Limin AE, Fowler DB. 2001. Developmental regulation of low-temperature tolerance in winter wheat. Annals of Botany 87: 751–757. [Google Scholar]
- Mahfoozi S, Limin AE, Fowler DB. 2001. Influence of vernalization and photoperiod responses on cold hardiness in winter cereals. Crop Science 41: 1006–1011. [Google Scholar]
- Mahfoozi S, Limin AE, Hayes PM, Hucl P, Fowler DB. 2000. Influence of photoperiod response on the expression of cold hardiness in cereals. Canadian Journal of Plant Science 80: 721–724. [Google Scholar]
- McIntosh RA, Hart GE, Gale MD. 1998. Catalogue of gene symbols for wheat. In: Li ZS, Xin ZY, eds. Proceedings of the 8th International Wheat Genetics Symposium. Beijing: Agricultural Scientech Press, 1333–1500. [Google Scholar]
- Martinez-Castilla LP, Alvarez-Buylla ER. 2003. Adaptive evolution in the Arabidopsis MADS-box gene family inferred from complete resolved progeny. Proceedings of the National Academy of Sciences of the USA 100: 13407–13412. [DOI] [PMC free article] [PubMed] [Google Scholar]
- Ratcliffe OJ, Kumimoto RW, Wong BJ, Riechmann JL. 2003. Analysis of the Arabidopsis MADS affecting flowering gene family: MAF2 prevents vernalization by short periods of cold. Plant Cell 15: 1159–1169. [DOI] [PMC free article] [PubMed] [Google Scholar]
- SigmaPlot. 2000. Regression equation library, SigmaPlot 2000 programming guide. Chicago, IL: SPSS Inc. [Google Scholar]
- Simpson GG, Dean C. 2002. Arabidopsis, the Rosetta stone of flowering time? Science 296: 285–289. [DOI] [PubMed] [Google Scholar]
- Simpson GG, Gendall AR, Dean C. 1999. When to switch to flowering. Annual Review of Cell Developmental Biology 15: 519–550. [DOI] [PubMed] [Google Scholar]
- Stushnoff C, Fowler DB, Brule-Babel A. 1984. Breeding and selection for resistence to low temperature. In: Vose PB, ed. Plant breeding – a contemporary basis. New York: Pergamon Press, 115–136. [Google Scholar]
- Storlie EW, Allan RE, Walker-Simmons MK. 1998. Effect of the Vrn1-Fr1 interval on cold hardiness levels in near-isogenic wheat lines. Crop Science 38: 483–488. [Google Scholar]
- Sutka J. 1994. Genetic control of frost tolerance in wheat (Triticum aestivum L.). Euphytica 77: 277–282. [Google Scholar]
- Sutka J, Snape JW. 1989. Location of a gene for frost resistance on chromosome 5A of wheat. Euphytica 42: 41–44. [Google Scholar]
- Toth B, Galiba G, Feher E, Sutka J, Snape JW. 2003. Mapping genes affecting flowering time and frost resistance on chromosome 5B in wheat. Theoretical and Applied Genetics 107: 509–514. [DOI] [PubMed] [Google Scholar]
- Vagujfalvi A, Galiba G, Cattivelli L, Dubcovsky J. 2003. The cold-regulated transcriptional activator Cbf3 is linked to the frost-tolerance locus Fr-A2 on wheat chromosome 5A. Molecular Genetics and Genomics 269: 60–67. [DOI] [PMC free article] [PubMed] [Google Scholar]
- Wang SY, Ward RW, Ritchie JT, Fisher RA, Schulthess U. 1995. Vernalization in wheat. I. A model based on the interchangeability of plant age and vernalization duration. Field Crop Research 41: 91–100. [Google Scholar]