

Abstract
• Background and Aims Data are presented from 39 species of mosses and 16 liverworts for ratios of chlorophylls and total carotenoids, and light saturation of photosynthetic electron flow or photosynthetic CO2 uptake, in relation to the postulate that bryophyte cells in general show shade-plant characteristics.
• Methods Pigment concentrations were measured by spectrophotometer in 80 % acetone extracts. Light-saturation curves were constructed by (modulated) chlorophyll florescence and for some species by infra-red gas analysis.
• Key Results The pigment measurements were widely variable but broadly in line with the findings of previous authors. Median values (mosses/liverworts) were: total chlorophyll, 1·64/3·76 mg g−1; chlorophyll a : b, 2·29/1·99; chlorophylls : carotenoids, 4·74/6·75). The PPFD values at 95 % saturation (estimated from fitted curves) also ranged widely, but were almost all <1000 µmol m−2 s−1; the median for mosses was 583 and for liverworts 214 µmol m−2 s−1. The two highest PPFD95% values were from Polytrichum species with lamella systems forming a ventilated photosynthetic tissue. Total chlorophyll, chlorophyll a : b and chlorophylls : carotenoids all correlated significantly with PPFD95%.
• Conclusions Bryophytes include but are not inherently shade plants. Light-saturation levels for species of open sun-exposed habitats are lower than for vascular sun plants and are probably limited by CO2 diffusion into unistratose leaves; this limit can only be exceeded by bryophytes with ventilated photosynthetic tissues which provide increased area for CO2 uptake.
Key words: Bryophytes, chlorophyll a : b ratio, chlorophyll : carotenoid ratio, chlorophyll fluorescence, liverworts, light responses, light saturation, mosses, NPQ, photoprotection, PPFD responses
INTRODUCTION
Bryophytes, even those of open, exposed habitats, have been seen as showing features that would generally be regarded as characteristic of shade plants (Valanne, 1984). They typically have low chlorophyll a : b ratios, reported values mostly lying within the range from 1·5 to 3·0 (Rastorfer, 1972; Rao et al., 1979; Martin, 1980; Aro, 1982; Martin and Churchill, 1982; Kershaw and Webber, 1986). This implies that the light-harvesting chlorophyll a : b protein complex makes up a large proportion of the total chlorophyll present. Light-response curves for bryophytes commonly show saturation of photosynthesis at rather low irradiances. Saturation levels around 20 % of full sunlight have been found by a number of investigators for a wide range of bryophytes, including species of open, brightly lit habitats such as Bryum argenteum (Rastorfer, 1970), Racomitrium lanuginosum (Kallio and Heinonen, 1975), Grimmia pulvinata and Tortula ruralis (Alpert and Oechel, 1987). In mosses from oak–hickory forest and exposed sandstone outcrops in Kansas, Martin and Churchill (1982) found generally higher chlorophyll a : b ratios on the exposed outcrops than in the forest. The forest mosses showed a striking increase in total chlorophyll concentration, and a (weaker) tendency for chlorophyll a : b ratios to increase, following canopy closure in spring. Kershaw and Webber (1986) demonstrated strong seasonal changes in the chlorophyll content and light-responses of Brachythecium rutabulum in an abandoned apple orchard in Ontario, but little change in the chlorophyll a : b ratio.
It is intuitively reasonable that poikilohydric photosynthetic organisms should be adapted to function at relatively low light levels. During periods of bright, dry sunny weather bryophytes will generally be dry and metabolically inactive. Most of their photosynthesis takes place in rainy or cloudy weather, when irradiance may often be <20 % of that in full sun. For bryophytes of dry habitats, the major physiological need during transient exposures to bright sunshine as the plant dries out is likely to be for photoprotection rather than energy capture. The bryophytes that, prima facie, might be expected to be best adapted to photosynthesize under high light conditions are the species of mires, springs and other wet habitats, which remain constantly moist in full sun.
In the present study we set out to explore further how the ratios of chlorophyll a to chlorophyll b, and of total chlorophylls to total carotenoids, are related to habitat and to the light-response of photosynthesis in bryophytes. Chlorophyll fluorescence provided a ready means of estimating photosynthetic electron flow (Schreiber et al., 1995; Maxwell and Johnson, 2000), making the screening of the light responses of a wide range of species relatively quick and easy. Fluorescence measurements, of course, include photorespiratory as well as photosynthetic electron flow, but this does not invalidate comparisons within or between-species; it simply puts them on a different basis. There are various other problems that may arise and precautions that need to be taken in the use of fluorescence measurements, which are discussed below. On the positive side, chlorophyll fluorescence provides its own additional insights into the responses of the photosynthetic system to increasing irradiance. In particular, the photochemical quenching parameter qP gives a measure of the oxidation state of the primary electron acceptor (QA), and non-photochemical quenching (NPQ) reflects the non-radiative dissipation of excitation energy (Björkman and Demmig-Adams, 1995; Gilmore, 1997). For comparison with the chlorophyll-fluorescence data, response curves of net photosynthesis and dark respiration were constructed for a few species by infra-red gas analysis.
The material studied, mostly collected in south-west England, covers a taxonomically wide range including examples of most of the major groups of bryophytes.
MATERIALS AND METHODS
Sources of material
All of the material was collected during 1999, most of it in Devon, south-west England (approx. 50°30′N, approx. 3°40′W); localities are given in Tables 1 and 2. A few gatherings came from the New Forest, Hants (50°50′N, 1°30′W), South Wales (51°50′N, 3°05′W), the Derbyshire Dales (53°15′N, 1°50′W) and the Yorkshire Pennines (54°05′N, 2°10′W) in the UK, and Felsőótárkány near Eger in northern Hungary (approx. 47°57′N, 20°27′E). Material was returned to the laboratory, re-moistened if necessary by spraying with distilled water, and placed in clear polyethylene bags on a north-facing window sill. Measurements for the light-response curves were made as soon as possible (generally within, at most, 2–3 d) to minimize the degree of acclimation that can take place over longer periods, and a sub-sample of shoots for pigment analysis was separated and allowed to dry naturally in subdued light, packeted and (apart from the few days in transit between the UK and Hungary) kept dry in a refrigerator until extraction for pigment analysis.
Table 1.
Mosses: collecting sites, ‘95 % saturation’ PPFD (calculated from fitted RETR curves), and pigment parameters
| Species |
Locality and date of collection |
Chlorophyll (mg g−1) |
Chl a : b |
Chl : Car |
PPFD at 95 % sat. µmol m−2 s−1 |
NPQ at 400 µmol m−2 s−1 |
1 – qP at 400 µmol m−2 s−1 |
|---|---|---|---|---|---|---|---|
| Andreaea rothii | Crockern Tor, Dartmoor, 20 Feb. (SX616757) | 1·05 ± 0·04 | 2·25 ± 0·04 | 3·09 ± 0·04 | 711 ± 245** | 7·80 ± 0·62 | 0·34 ± 0·06 |
| Anomodon viticulosus | Chudleigh, Devon, 5 Feb. (SX865787) | 2·48 ± 0·14 | 2·97 ± 0·02 | 4·59 ± 0·04 | 487 ± 12 | 7·30 ± 0·74† | 0·54 ± 0·02† |
| Aulacomnium palustre | Hatchet Pond, New Forest, Jan. (SU362062) | 0·54 ± 0·04 | – | 2·67 ± 0·10 | 1207 ± 162 | 4·23 ± 0·00 | – |
| Aulacomnium palustre | Bog below Haytor, 21 Aug. (SX757765) | 0·79 ± 0·06 | 2·18 ± 0·19 | 3·98 ± 0·44 | 817 ± 157* | 5·38 ± 0·78 | 0·29 ± 0·04 |
| Campylium stellatum | Stony Moors, New Forest, 9 Sep. (SZ214996) | 1·76 ± 0·11 | 2·58 ± 0·16 | 5·36 ± 0·15 | 638 ± 29* | 4·09 ± 0·57 | 0·36 ± 0·02 |
| Ctenidium molluscum | Miller's Dale, Derbyshire 12 Sep. (SK135733) | 1·43 ± 0·10 | 2·27 ± 0·01 | 4·98 ± 0·16 | 589 ± 161** | 7·55 ± 1·28 | 0·25 ± 0·10 |
| Dicranum majus | Stoke Woods, Exeter, Jan. (SX925961) | 2·51 ± 0·22 | 2·35 ± 0·08 | 5·74 ± 0·25 | 255 ± 5 | 3·71 ± 0·04 | – |
| Dicranum scoparium | Stoke Woods, Exeter, Jan. (SX925961) | 2·22 ± 0·29 | 3·18 ± 0·33 | 5·68 ± 0·36 | 295 ± 5 | 2·78 ± 0·02 | – |
| Encalypta streptocarpa | Chee Dale, Derbyshire 12 Sep. (SK123734) | 2·90 ± 0·21 | 2·01 ± 0·02 | 6·02 ± 0·04 | 480 ± 83 | 4·95 ± 0·76 | 0·41 ± 0·02 |
| Eurhynchium crassinervium | Black Head, Torquay, 11 Aug. (SX942643) | 3·89 ± 0·12 | 1·86 ± 0·23 | 7·63 ± 01·21 | 295 ± 11 | 4·13 ± 0·43 | 0·55 ± 0·01 |
| Fissidens dubius | Chee Dale, Derbyshire 12 Sep. (SK123734) | 4·04 ± 0·31 | 1·67 ± 0·16 | 9·08 ± 1·78 | 219 ± 61* | 6·03 ± 1·76 | 0·57 ± 0·15 |
| Grimmia pulvinata | Clyst St Mary, Devon, Jan. (SX971911) | 2·01 ± 0·26 | 2·88 ± 0·04 | 4·03 ± 0·11 | 525 ± 19 | – | – |
| Grimmia pulvinata | Clyst St Mary, Devon, Nov. (SX971911) | – | – | – | 904 ± 44** | 4·24 ± 1·14 | 0·29 ± 0·08 |
| Homalothecium sericeum | Chudleigh, Devon, 3 Jan. (SX865787) | 2·45 ± 0·15 | 2·96 ± 0·04 | 4·83 ± 0·04 | 546 ± 15 | – | – |
| Hookeria lucens | Stoke Woods, Exeter, Jan. (SX920959) | 7·90 ± 1·20 | 2·45 ± 0·03 | 5·84 ± 0·17 | 236 ± 5 | 2·89 ± 0·02 | – |
| Leucobryum glaucum | Stoke Woods, Exeter, Jan. (SX927962) | 1·95 ± 0·12 | 2·66 ± 0·10 | 4·43 ± 0·09 | 298 ± 36 | 9·24 ± 0·08 | – |
| Orthotrichum anomalum | Chudleigh, Devon, 3 Jan. (SX863787) | 3·07 ± 0·15 | 2·99 ± 0·06 | 3·80 ± 0·10 | 507 ± 21 | 3·20 ± 0·07 | – |
| Philonotis calcarea | Craig-y-Cilau, Powys, 19 Apr. (SO185165) | 1·07 ± 0·07 | 2·33 ± 0·09 | 4·57 ± 0·15 | 764 ± 185 | 3·98 ± 0·65 | 0·30 ± 0·01 |
| Philonotis fontana | Abergavenny, Gwent, 19 Apr. (SO269167) | 1·04 ± 0·11 | 2·23 ± 0·06 | 3·89 ± 0·25 | 688 ± 183 | 2·93 ± 0·66 | 0·37 ± 0·05 |
| Plagiomnium undulatum | Stoke Woods, Exeter, Jan. (SX920959) | 4·66 ± 0·37 | 1·72 ± 0·10 | 8·06 ± 1·03 | 251 ± 6 | – | – |
| Plagiomnium undulatum | Charles Wood, Fingle Bridge, Aug. (SX745894) | 3·93 ± 0·05 | 1·94 ± 0·10 | 7·49 ± 0·44 | 154 ± 25 | 2·49 ± 0·38 | 0·78 ± 0·01 |
| Plagiothecium undulatum | Charles Wood, Fingle Bridge, Aug. (SX745894) | 3·25 ± 0·81 | 1·79 ± 0·48 | 12·49 ± 4·88 | 110 ± 25 | 4·95 ± 1·22 | 0·81 ± 0·03 |
| Pleurochaete squarrosa | Chudleigh, Devon, 29 Nov. (SX863787) | 1·14 ± 0·02 | 2·78 ± 0·12 | 4·53 ± 0·04 | 691 ± 137* | 2·64 ± 0·54 | 0·39 ± 0·02 |
| Pogonatum urnigerum | White Wood, Holne, Dartmoor, Oct. (SX694722) | 2·45 ± 0·27 | 2·67 ± 0·10 | 4·05 ± 0·15 | 957 ± 96 | 1·89 ± 0·17 | 0·24 ± 0·03 |
| Polytrichum formosum | Stoke Woods, Exeter, 4 Nov. (SX925961) | 3·53 ± 0·08 | 2·14 ± 0·03 | 6·87 ± 0·07 | 518 ± 15 | 1·57 ± 0·23 | 0·53 ± 0·03 |
| Polytrichum juniperinum | Haytor Rocks, 21 Aug. (SX757771) | 2·24 ± 0·15 | 2·85 ± 0·10 | 5·07 ± 0·11 | 1621 ± 306 | 1·29 ± 0·12 | 0·21 ± 0·03 |
| Polytrichum piliferum | Haytor, 21 Aug. (SX770775) | 1·91 ± 0·42 | 2·10 ± 0·08 | 5·07 ± 0·24 | 2549 ± 847 | 1·06 ± 0·42 | 0·12 ± 0·03 |
| Racomitrium aquaticum | Haytor Rocks, 21 Aug. (SX757771) | 0·72 ± 0·04 | 2·80 ± 0·36 | 3·93 ± 0·51 | 617 ± 49** | 3·69 ± 0·72 | 0·30 ± 0·02 |
| Racomitrium lanuginosum | O Brook, Dartmoor, Feb. (SX664719) | 0·51 ± 0·07 | 2·20 ± 0·11 | 2·32 ± 0·20 | 858 ± 11** | 12·14 ± 4·16 | 0·30 ± 0·05 |
| Racomitrium lanuginosum | O Brook, Dartmoor, Aug. (SX664719) | 0·97 ± 0·11 | 1·85 ± 0·14 | 4·74 ± 0·36 | 607 ± 104** | 4·97 ± 0·84 | 0·35 ± 0·07 |
| Rhytidiadelphus loreus | White Wood, Holne, 8 Feb. (SX692721) | 1·63 ± 0·24 | 2·42 ± 0·06 | 5·18 ± 0·23 | 217 ± 5 | 4·11 ± 0·89† | 0·66 ± 0·03† |
| Schistidium apocarpum | Exeter University campus, 9 July (SX916940) | 1·22 ± 0·30 | 2·21 ± 0·27 | 4·13 ± 0·65 | 591 ± 92** | 5·30 ± 1·98 | 0·29 ± 0·01 |
| Scorpidium scorpioides | Hatchet Pond, New Forest, Jan. (SU362062) | 1·27 ± 0·08 | – | 3·23 ± 0·13 | 962 ± 71 | – | – |
| Scorpidium scorpioides | Stony Moors, New Forest, 9 Sep. (SZ214996) | 2·57 ± 0·26 | 2·27 ± 0·11 | 6·13 ± 0·27 | 705 ± 2 | 5·75 ± 2·20 | 0·26 ± 0·04 |
| Sphagnum cuspidatum | Bicton Common, 2 Nov. (SY041857) | 0·75 ± 0·20 | 2·31 ± 0·17 | 4·73 ± 1·54 | 495 ± 110** | 9·13 ± 3·16 | 0·36 ± 0·04 |
| Sphagnum denticulatum | Bog below Haytor, Aug. (SX757765) | 0·88 ± 0·13 | 3·03 ± 0·07 | 4·86 ± 0·38 | 543 ± 65** | 5·34 ± 1·06 | 0·39 ± 0·06 |
| Sphagnum papillosum | Hatchet Pond, New Forest, Jan. (SU362062) | 0·27 ± 0·01 | – | 4·18 ± 0·22 | 325 ± 35* | – | – |
| Sphagnum rubellum | Bog below Haytor, Aug. (SX757765) | 0·76 ± 0·04 | 1·04 ± 0·05 | 7·31 ± 0·59 | 530 ± 58 | 9·20 ± 1·43 | 0·30 ± 0·09 |
| Sphagnum rubellum | Bicton Common, 2 Nov. (SY041857) | 0·76 ± 0·11 | 2·10 ± 0·02 | 4·40 ± 0·11 | 576 ± 55** | 4·54 ± 0·77 | 0·46 ± 0·03 |
| Splachnum ampullaceum | Hatchet Pond, New Forest, Jan. (SU362062) | 1·37 ± 0·06 | 3·29 ± 0·32 | 3·38 ± 0·13 | 782 ± 30 | – | – |
| Syntrichia intermedia | Chudleigh, Devon, 3 Jan. (SX863787) | 6·26 ± 0·85 | 3·45 ± 0·11 | 4·28 ± 0·20 | 772 ± 21 | – | – |
| Syntrichia intermedia | Chudleigh, Devon, Nov. (SX863787) | – | – | – | 830 ± 110** | 4·96 ± 2·02 | 0·18 ± 0·06 |
| Syntrichia ruralis | Felsőtárkány, Hungary, 27 Oct. | 3·06 ± 0·23 | 2·47 ± 0·04 | 3·58 ± 0·13 | 935 ± 166** | 4·36 ± 1·48 | 0·22 ± 0·03 |
| Thamnobryum alopecurum | Stoke Woods, Exeter, Jan. (SX920959) | 1·64 ± 0·07 | 3·21 ± 0·17 | 5·15 ± 0·21 | 264 ± 2 | – | – |
| Thuidium tamariscinum | Charles Wood, Fingle Bridge, Aug. (SX745894) | 2·33 ± 0·29 | 2·14 ± 0·17 | 6·53 ± 0·58 | 197 ± 62 | 4·34 ± 1·33 | 0·67 ± 0·05 |
| Tortella tortuosa | Craig-y-Cilau, Brecon, 19 Apr. (SO188162) | 0·78 ± 0·10 | 2·46 ± 0·06 | 3·06 ± 0·19 | 658 ± 116* | 6·39 ± 1·14 | 0·37 ± 0·05 |
| Tortella tortuosa | W of Malham Tarn, Yorks. 14 June (SD876668) | 1·52 ± 0·33 | 1·98 ± 0·26 | 5·41 ± 0·79 | 671 ± 37* | 7·1 ± 0·85 | 0·27 ± 0·07 |
Species names follow Blockeel and Long (1998).
Asterisks indicate cases where the curves show some (*) or strongly marked (**) non-saturating electron flow at high irradiances.
Ordnance Survey of Great Britain national grid references are given in parentheses.
Data from another batch of material, March 1999.
Table 2.
Liverworts: collecting sites, ‘95 % saturation’ PPFD (calculated from fitted RETR curves), and pigment parameters
| Species |
Locality and date of collection |
Chlorophyll (mg g−1) |
Chl a : b |
Chl : Car. |
PPFD at 95 % sat. µmol m−2 s−1 |
NPQ at 400 µmol m−2 s−1 |
1–qP at 400 µmol m−2 s−1 |
|---|---|---|---|---|---|---|---|
| Conocephalum conicum | University glasshouses, Exeter | 5·31 ± 0·25 | 1·57 ± 0·05 | 11·06 ± 0·25 | 205 ± 122 | 2·56 ± 0·49 | 0·74 ± 0·04 |
| Frullania dilatata | Black Head, Torquay, 11 Aug. (SX942643) | 2·00 ± 0·23 | 2·47 ± 0·16 | 5·88 ± 1·97 | 223 ± 45 | 3·76 ± 1·01 | 0·63 ± 0·04 |
| Frullania tamarisci | Near Bench Tor, Holne, Sept. (SX696714) | 3·75 ± 0·12 | 2·04 ± 0·05 | 6·18 ± 0·21 | 679 ± 102** | 5·64 ± 1·55 | 0·40 ± 0·08 |
| Jubula hutchinsiae | Fingle Bridge, 15 Aug. (SX745897) | 5·82 ± 0·09 | 1·40 ± 0·01 | 12·06 ± 0·19 | 79 ± 31 | 1·10 ± 0·37 | 0·89 ± 0·05 |
| Lunularia cruciata | Chudleigh, Jan. (SX865787) | 3·03 ± 0·34 | 2·20 ± 0·18 | 7·38 ± 0·97 | 472 ± 4 | 1·85 ± 0·03 | – |
| Marchantia polymorpha | University glasshouses, Exeter (ex Malham Tarn) | 3·97 ± 1·02 | 2·13 ± 0·56 | 8·23 ± 1·02 | 327 ± 36 | 2·11 ± 0·10 | 0·57 ± 0·03 |
| Marchesinia mackaii | Anstey's Cove, Torquay, 11 Aug. (SX936644) | 3·62 ± 0·20 | 1·54 ± 0·02 | 10·52 ± 0·28 | 193 ± 27 | 2·46 ± 0·35 | 0·69 ± 0·06 |
| Metzgeria furcata | Chudleigh, 3 Jan. (SX865787) | 4·19 ± 0·20 | 1·94 ± 0·07 | 6·30 ± 0·26 | 180 ± 3 | – | – |
| Metzgeria furcata (lighter) | Black Head, Torquay, 11 Aug. (SX942643) | 4·12 ± 1·53 | 1·94 ± 0·38 | 6·59 ± 2·77 | 300 ± 18 | 5·99 ± 0·86 | 0·53 ± 0·05 |
| Metzgeria furcata (shadier) | Black Head, Torquay, 11 Aug. (SX942643) | 4·17 ± 0·11 | 1·98 ± 0·05 | 5·75 ± 0·16 | 222 ± 29 | 4·21 ± 1·19 | 0·63 ± 0·06 |
| Pellia epiphylla | Stoke Woods, Exeter, Jan. (SX920959) | 4·10 ± 0·46 | 1·88 ± 0·17 | 8·11 ± 0·86 | 199 ± 3 | 1·80 ± 0·01 | – |
| Plagiochila asplenioides | Stoke Woods, Exeter, Jan. (SX920959) | 3·77 ± 0·17 | 2·00 ± 0·08 | 7·64 ± 0·61 | 127 ± 0 | 4·53 ± 0·03 | – |
| Porella arboris-vitae | Black Head, Torquay, 11 Aug. (SX942643) | 2·73 ± 0·19 | 2·21 ± 0·10 | 5·77 ± 0·25 | 159 ± 6 | 3·18 ± 0·70 | 0·74 ± 0·01 |
| Porella platyphylla | Felsőtárkány, Hungary, 27 Oct. | 3·33 ± 0·09 | 2·14 ± 0·02 | 3·82 ± 0·03 | 442 ± 68 | 6·03 ± 2·87 | 0·50 ± 0·04 |
| Saccogyna viticulosa | Charles Wood, Fingle Bridge, Aug. (SX745894) | 3·62 ± 0·12 | 1·88 ± 0·04 | 6·90 ± 0·18 | 151 ± 25 | 2·49 ± 0·32 | 0·76 ± 0·05 |
| Scapania compacta | Near Bench Tor, Holne, Sept. (SX696714) | 1·58 ± 0·09 | 2·28 ± 0·15 | 5·51 ± 0·42 | 455 ± 118** | 4·11 ± 0·72 | 0·48 ± 0·09 |
| Targionia hypophylla | Kennford, Aug. (SX916864) | 1·43 ± 0·07 | 2·37 ± 0·15 | 5·02 ± 0·34 | 597 ± 187 | 1·70 ± 0·75 | 0·43 ± 0·08 |
| Trichocolea tomentella | Charles Wood, Fingle Bridge, Aug. (SX745894) | 5·30 ± 0·08 | 1·57 ± 0·01 | 9·84 ± 0·01 | 90 ± 6 | 1·54 ± 0·23 | 0·83 ± 0·01 |
Species names follow Blockeel and Long (1998).
Conventions as in Table 1.
Pigment analyses
Pigment analyses followed Lichtenthaler and Wellburn (1983). The dry bryophyte samples were extracted in 80 % ammoniacal acetone and absorbance at 470, 646 and 663 nm read on a spectrophotometer (Varian Cary 3E).
Chlorophyll-fluorescence measurements
Chlorophyll fluorescence measurements were made using a modulated chlorophyll fluorometer (FMS1; Hansatech Ltd, King's Lynn, UK). The bryophyte material was placed in standard Hansatech leaf clips. Photosynthetic photon flux density (PPFD) response curves were constructed using the scripting facility of the fluorometer to expose a sample of material to successively higher actinic light levels, with 6 min equilibration at each level before measurement. The leaf clip and fibre-optic head of the fluorometer were loosely wrapped in moist tissue and cling film during the measurements to minimize drying of the bryophyte material. Photon flux density values (400–700 nm) at the leaf clip for each actinic light setting were measured using the 3 mm diameter sensor provided with the Hansatech PAR (photosynthetically active radiation)/temperature leaf clip assembly.
In general, bryophytes from shady habitats (and some species in all situations) gave typical ‘saturation’ curves when the relative electron transfer rate (RETR) was plotted against PPFD (Fig. 1A–D). These were closely fitted by exponential curves of the form y = A(1 – e−kx), where y = RETR, x = PPFD, A is the asymptote of RETR, and k a rate constant such that Ak is the initial slope. However, a number of species, especially from exposed habitats, gave a good fit to a curve of this kind up to approx. 400 µmol m−2 s−1 PPFD, but failed to saturate at higher irradiances (Fig. 1E and F; species marked with asterisks in Table 1). Various lines of evidence have suggested that this non-saturating electron flow might be to O2, but accounted for neither by photorespiration nor the Mehler reaction (Marschall et al., 2000). However, the evidence is inconclusive, and the problem remains unresolved. Nevertheless, the parameters of the curves fitted at low to moderate irradiances are generally consistent with expectation from light conditions in the habitats of the plants, and must bear some functional relationship to their photosynthetic adaptation. Pragmatically, we therefore accepted the lower part of the response curve [giving a good fit to the exponential curve, with an initial slope (Ak) close to the dark-adapted value of Fv/Fm (generally approx. 0·75–0·85)] as a semi-empirical measure of the PPFD response of the photosynthetic system. The notional ‘95 % saturation’ irradiance figure calculated from this curve for all of the species should be seen as a convenient parameter which is intuitively easy to relate to, rather than as a rigorous measure of photosynthetic performance.
Fig. 1.
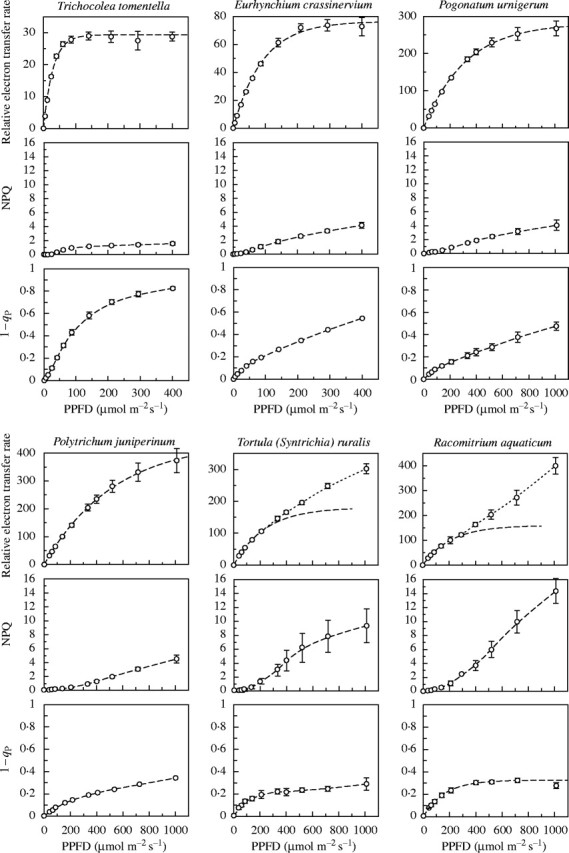
PPFD response curves of relative electron flow (RETR), NPQ and 1 – qP, from chlorophyll-fluorescence measurements for six representative species. Note the different x-axis scales of the first two sets of curves, and the varying y-axis scales of the RETR graphs. The y-axis scales for NPQ and 1 – qP are the same throughout. The RETR curves for Eurhynchium crassinervium, Pogonatum urnigerum and Polytrichum juniperinum are fitted to all the data points, that for Trichocolea tomentella is fitted to the first eight data points, and the curves for Tortula ruralis and Racomitrium aquaticum to the first five (giving an initial slope Ak ∼ 0·75; including further data points for these species gave progressively poorer fits to the initial slope).
Gas-exchange measurements
Gas exchange measurements were made with a portable infra-red gas analyser (Type LCA-2: ADC, Hoddesdon, Herts, UK), in differential mode, using a small leaf-disc chamber in Eger or a Parkinson leaf chamber (ADC; broad-leaf type) in Exeter, with quartz-halogen fibre-optic light sources (Schott KL 1500). Photon flux was measured with a LI-170 quantum meter (Lambda Instrument Co., Lincoln, NB, USA).
RESULTS
The major results are presented in Tables 1–3; the measurements and the more immediate correlations between them are discussed briefly below. Wider and more general relationships and implications are considered in the Discussion.
Table 3.
| Statistic |
Chlorophyll (mg g−1 d. wt) |
Chlorophyll a : b |
Chlorophyll: carotenoids |
PPFD at 95 % saturation (µmol m−2 s−1) |
||||
|---|---|---|---|---|---|---|---|---|
| Mosses | ||||||||
| Mean | 2·08 | 2·39 | 5·15 | 621 | ||||
| s.d. | 1·54 | 0·51 | 1·82 | 413 | ||||
| Minimum | 0·27 | 1·04 | 2·32 | 110 | ||||
| 1st quartile | 0·97 | 2·10 | 4·05 | 305 | ||||
| Median | 1·64 | 2·29 | 4·74 | 583 | ||||
| 3rd quartile | 2·51 | 2·80 | 5·74 | 754 | ||||
| Maximum | 7·90 | 3·45 | 12·49 | 2549 | ||||
| Liverworts | ||||||||
| Mean | 3·66 | 1·98 | 7·36 | 283 | ||||
| s.d. | 1·20 | 0·30 | 2·24 | 175 | ||||
| Minimum | 1·43 | 1·40 | 3·82 | 79 | ||||
| 1st quartile | 3·11 | 1·88 | 5·80 | 164 | ||||
| Median | 3·76 | 1·99 | 6·75 | 214 | ||||
| 3rd quartile | 4·16 | 2·18 | 8·20 | 413 | ||||
| Maximum | 5·82 | 2·47 | 12·06 | 679 | ||||
Chlorophyll concentration and chlorophyll a : b ratio
Chlorophyll concentration is very variable, with an overall median value of 1·64 mg g−1 d. wt. The figures are low by vascular-plant standards (by a factor of approx. 3), largely because bryophytes, with their generally unistratose leaves, have a much higher proportion of cell wall to cell contents than most vascular plants (Green and Lange, 1995; Martin and Adamson, 2001). The average chlorophyll content is higher in liverworts than in mosses. Mosses of shady habitats mostly fall into the upper half of the data. Chlorophyll content is notably low in Sphagnum, and is low too in Racomitrium and in many species of mires, grasslands and other brightly illuminated habitats. However, there are some conspicuous exceptions to these generalizations. The Polytrichaceae, with their mesophyll-like ventilated photosynthetic tissues, embrace a wide range of shade adaptation but all have a relatively high chlorophyll content, as do several small-cushion desiccation-tolerant mosses of exposed habitats such as Orthotrichum anomalum and Syntrichia intermedia. Over all, the present results are broadly in the same range as those of Martin and Churchill (1982) and Martin and Adamson (2001).
The chlorophyll a : b quotients are also broadly in the same range as others have found for bryophytes, with median figures of 2·29 for mosses and 1·99 for liverworts (Table 3). Amongst the mosses, a few conspicuously low values are associated with species growing in shady habitats (e.g. Eurhynchium crassinervium, Plagiomnium undulatum, Plagiothecium undulatum) but there is much apparently random variation. Much the same is true of the liverworts. In both groups there is some tendency for species with complex ventilated photosynthetic tissues (Polytrichaceae, Marchantiales) to have rather high chlorophyll a : b ratios.
Chlorophyll : carotenoid ratio
The ratio of total chlorophylls to total carotenoids also varies widely, but there is a very clear relationship with habitat. The highest values are strikingly associated with species growing in more or less deep shade (e.g. the moss Plagiothecium undulatum and the liverworts Jubula hutchinsiae and Marchesinia mackaii), and the lowest values with species of brightly lit situations (e.g. the mosses Andreaea rothii, Aulacomnium palustre, Orthotrichum anomalum, Philonotis fontana, Racomitrium spp., Scorpidium scorpioides and Syntrichia ruralis). Polytrichum piliferum and P. juniperinum, species of open moorland but with chlorophyll : carotenoid ratios above the median for mosses, stand the most noticeably outside the general trend.
Light responses of RETR and photosynthetic C fixation
As a glance at Fig. 1 and Tables 4 and 5 shows, bryophytes range very widely in their photosynthetic light responses. The highest 95 % saturation values, approximating to full sunlight, were from Polytrichum species of exposed moorland habitats. However, most of the species give very much lower values than this, and as Fig. 2 shows all but three lie below 1000 µmol m−2 s−1. There is some indication of bimodality in the data for the mosses, with a strong peak below 300, and another above 500 µmol m−2 s−1. All the species making up the lower peak were from shady woodland and, for most, that is their normal habitat. Those making up the higher peak included a few which are common in woodland (Anomodon viticulosus, Polytrichum formosum) but extend into less shady places; most are species of more open, brightly illuminated situations. However, almost all of these showed 95 % saturation at less than half the irradiance levels common in sunny summer weather with white clouds. The only questions relate to the species marked with asterisks in Tables 1 and 2, where the light-response curve was fitted to the lower data points, and RETR did not saturate at high irradiance. Figure 3 shows response curves of CO2 exchange for three of these species, measured by infra-red gas analysis. All of these showed saturation at PPFD levels near or below those listed in Table 1. The species with 95 % saturation values above 1000 µmol m−2 s−1 will be discussed further below.
Table 4.
Species with mean NPQ >8·0 at 1010 µmol m−2 s−1 PPFD
| Species |
NPQ at 1010 µmol m−2 s−1 |
|---|---|
| Andreaea rothii (Crockern Tor) | 15·77 ± 6·02 |
| Aulacomnium palustre (Haytor) | 10·95 ± 0·52 |
| Ctenidium molluscum (Miller's Dale) | 11·08 ± 1·99 |
| Encalypta streptocarpa (Chee Dale) | 8·37 ± 1·87 |
| Fissidens dubius (Chee Dale) | 8·25 ± 1·93 |
| Grimmia pulvinata (Clyst St Mary, Nov.) | 8·55 ± 0·57 |
| Philonotis calcarea (Craig-y-Cilau) | 8·74 ± 0·54 |
| Racomitrium aquaticum (Haytor) | 14·37 ± 1·77 |
| R. lanuginosum (O Brook, Feb.) | 17·41 ± 3·09 |
| R. lanuginosum (O Brook, Aug.) | 12·38 ± 1·12 |
| Schistidium apocarpum (Exeter) | 12·85 ± 2·07 |
| Scorpidium scorpioides (Stony Moors) | 10·86 ± 3·19 |
| Sphagnum cuspidatum (Bicton Common) | 14·98 ± 1·23 |
| S. rubellum (Haytor) | 10·53 ± 0·98 |
| Syntrichia intermedia (Chudleigh, Nov.) | 10·77 ± 1·01 |
| S. ruralis (Felsőtárkány) | 9·36 ± 2·42 |
| Tortella tortuosa (Craig-y-Cilau) | 13·68 ± 1·89 |
| T. tortuosa (Malham Tarn) | 13·91 ± 2·15 |
Table 5.
Some species with high PPFD95% for which high-irradiance measurements are available, but which have lower NPQ levels
| Campylium stellatum (Stony Moors) | 7·06 ± 0·41 |
|---|---|
| Philonotis fontana (Abergavenny) | 6·52 ± 0·50 |
| Pleurochaete squarrosa (Chudleigh) | 5·95 ± 1·35 |
| Pogonatum urnigerum (Holne) | 4·05 ± 0·74 |
| Polytrichum formosum (Exeter) | 3·17 ± 0·41 |
| P. juniperinum (Haytor) | 4·49 ± 0·59 |
| P. piliferum (Haytor) | 3·96 ± 1·15 |
Fig. 2.
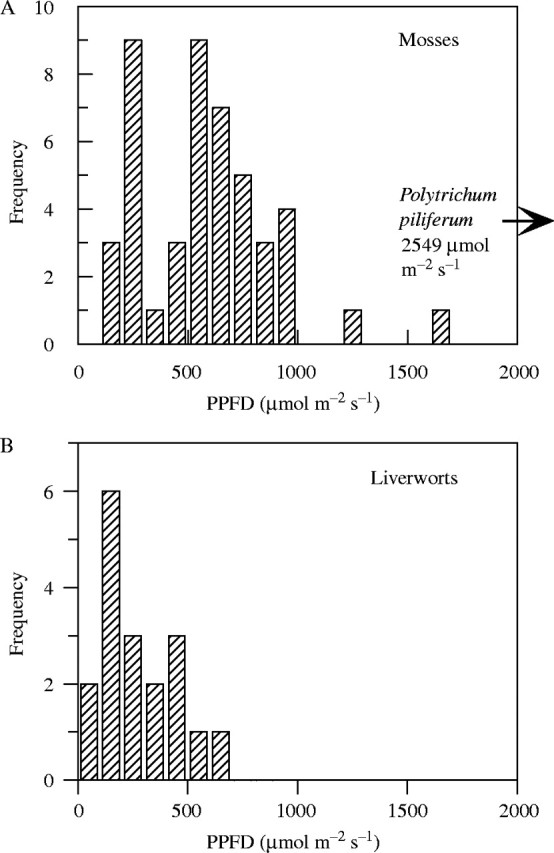
Frequency distribution of 95 % saturation values for photosynthetic electron transport (PPFD95%) in (A) mosses and (B) liverworts.
Fig. 3.

Light-response curves for photosynthetic CO2 assimilation, measured by infra-red gas analysis. All are from the same localities as in Tables 1 and 2, but except for (C) on different sampling occasions. In general, ‘photosynthesis’ (plotted as a fraction of the asymptote of the fitted curve) has been taken as the sum of net CO2 uptake and dark respiration, adjusted in (C) where the form of the curve indicated that dark respiration was over-estimated. (A) Andreaea rothii, PPFD95% 551 µmol m−2 s−1; (B) Racomitrium aquaticum, PPFD95% 583 µmol m−2 s−1; (C) Tortula (Syntrichia) ruralis, PPFD95% 832 µmol m−2 s−1; (D) Marchantia polymorpha PPFD95% 228 µmol m−2 s−1.
Other chlorophyll-fluorescence parameters
Non-photochemical quenching, NPQ, is primarily a measure of non-radiative dissipation of excitation energy, and may be seen as essentially photo-protective (Demmig-Adams, 1998). Many mosses and liverworts gave values of approx. 3–4 at 400 µmol m−2 s−1, in the more shade-adapted species increasing little further at higher irradiances. Lower values were seen in some species of deep shade (e.g. Hookeria lucens, Jubula hutchinsiae, Trichocolea tomentella) and in Polytrichaceae amongst the mosses and Marchantiales (Conocephalum, Lunularia, Marchantia, Targionia) among the liverworts, both groups with ventilated photosynthetic tissues analogous to a mesophyll. However, many species of sun-exposed habitats gave NPQ values of 10 or more at high irradiance (Fig. 1 and Tables 4 and 5). The high NPQ values relax to low levels within a few minutes in darkness (M. C. F. Proctor, unpubl. res., on Schistidium apocarpum and Tortula [Syntrichia] ruralis], suggesting a high level of photoprotection in these species.
The parameter 1 – qP is a measure of the reduction state of the first electron acceptor of PSII. High values may be seen as a symptom of light stress and, at moderate irradiances, are characteristic of species of deep shade (e.g. Plagiothecium undulatum, Jubula hutchinsiae, Trichocolea tomentella). Low values are seen in species of open sunny habitats (e.g. Aulacomnium palustre, Grimmia pulvinata, Schistidium apocarpum, Scorpidium scorpioides, Syntrichia spp.) and in the Polytrichaceae.
Correlations between pigment and light-response measurements
The quantities measured and calculated all span a wide range of values, with strongly skewed frequency distributions, and linear scatter diagrams of pairs of variables are quite uninformative. However, good correlations emerge when the data are log transformed (Fig. 4). The relationship of chlorophyll content to PPFD95% is highly significant, although diffuse and with some wide outliers. The overall correlation of the chlorophyll a : b ratio to PPFD95% is again clear and highly significant, but the relationship is weak among the mosses taken alone, though stronger in the liverworts; the regression slopes for the mosses and liverworts are statistically different but only at the 5 % level and it would probably be unwise to read too much into this difference. The relationship of the chlorophyll : carotenoid ratio to PPFD95% is very clear; all the regression lines are highly significant, and very similar. An almost equally strong relationship emerges between the chlorophyll : carotenoid ratio and chlorophyll a : b. Here again the slopes for mosses and liverworts differ at P < 0·05, but inspection of the diagram suggests that this difference may not be significant biologically.
Fig. 4.

Logarithmic plots of pigment parameters and PPFD95%. Bold lines are linear regressions for the whole data (slopes all significant at P < 0·001); lighter full lines are regressions for mosses (open points), pecked lines are regressions for liverworts (filled points). (A) Chlorophyll (mg g−1) and PPFD95%; slopes of regressions for mosses and liverworts both P < 0·02, difference of slopes not significant. (B) Chlorophyll a : b and PPFD95%; slope for mosses not significant, for liverworts P < 0·01, difference P < 0·05. (C) Quotient (total chlorophylls) : (total carotenoids) and PPFD95%; slope for mosses P < 0·001, for liverworts P < 0·01, difference not significant. (D) Quotient (total chlorophylls) : (total carotenoids) and chlorophyll a : b; Slopes for mosses and liverworts both P < 0·01, difference P < 0·05.
DISCUSSION
How far do the results bear out the proposition that bryophytes are shade plants? The pigment data are widely variable, but generally in line with previous findings for bryophytes where comparable data are available. Mean chlorophyll a : b ratios for mosses in our data (2·39, s.d. = 0·51) are close to those of a sample of 31 species from Kansas (2·51, s.d. = 0·22) (Martin and Churchill, 1982). Eleven species from North Carolina ranged from 1·4 to 2·1 (Martin 1980), all within the range of our data. In a seasonal study of 15 aquatic bryophytes from Spain, Martínez-Abaigar et al. (1994) found an overall range of chlorophyll a : b ratios from 1·94 to 3·33. These figures for bryophytes are generally low by vascular-plant standards, but there is a large overlap between the two groups. In eight Malayan ferns, Nasrulhaq-Boyce and Haji Mohamed (1987) found chlorophyll a : b ratios from 2·1 to 2·9, with a slightly higher mean in sun (2·70) than in shade (2·33) species. Extreme-shade ferns can have chlorophyll a : b ratios well down in the bryophyte range; Nasrulhaq and Duckett (1991) found a ratio of 1·8 in the Malayan rainforest fern Teratophyllum (and 2·2 in the lycopod Selaginella willdenowii), and Johnson et al. (2000) found ratios of 1·58 and 2·00 in gametophytes and sporophytes, respectively, of Trichomanes speciosum. In a survey of 20 vascular-plant species (all angiosperms) from the Sheffield area, Johnson et al. (1993a) found chlorophyll a : b ratios ranging from 2·12 to 3·29 (mean 2·74, s.d. = 0·36); in light-acclimation experiments on six species from the same area, Murchie and Horton (1997) found average chlorophyll a : b ratios of 3·61 in moderate and 3·23 in low-light treatments. Johnson et al. (1993a) and Murchie and Horton (1997) found only a weak association between the chlorophyll a : b ratio and shade tolerance; the correlation between the chlorophyll a : b ratio and PPFD95% was similarly weak among the mosses in our data, but was stronger in the liverworts and in the data as a whole.
Johnson et al. (1993a) found a very close correlation between total chlorophylls and total carotenoids in their sample of vascular plants, hence rather little variation in the chlorophyll : carotenoid ratio (mean 4·00, s.d. = 0·77). This contrasts with the higher mean and very much greater variability in the present bryophyte data. Johnson et al. (1993a) found highly significant correlations of the proportions of lutein (positive) and the xanthophyll-cycle pigments (negative) with shade tolerance, but Rosevear et al. (2001) concluded from growth experiments that environment is more important than genetic predisposition in determining leaf pigment content. Environmental influences undoubtedly play a part in bryophytes, but are very unlikely to be the sole (or even the main) cause of the variation seen here. Either way, it is reasonable to surmise (which invites testing) that at least a part of the very wide range in the chlorophyll : carotenoid ratio seen in bryophytes is due to large amounts of xanthophyll-cycle pigments in the species of sunny sites, particularly in view of the extreme NPQ levels shown by many of these plants at high irradiance (Demmig-Adams, 1998). The highest (saturation) values of NPQ found by Johnson et al. (1993b) in their sample of 20 vascular plants was approx. 4·5. At high irradiance, values of 10–15 or more are commonplace in bryophytes of sunny sites, implying very high levels of photoprotection.
It is clear from Fig. 2 that (with a few exceptions) even bryophytes from the most sun-exposed sites are not true ‘sun plants’. In bryophytes PPFD95% rarely exceeds 1000 µmol m−2 s−1, whereas vascular sun plants commonly reach saturation only at irradiances approaching full sunlight. Measurements using the same methods as for the bryophytes gave PPFD95% values of 1355 µmol m−2 s−1 for Fraxinus excelsior, 2125 µmol m−2 s−1 for Malus domestica ‘Discovery’ and 1349 µmol m−2 s−1 for Typha angustifolia (M. C. F. Proctor, unpubl. res.). However, it is also clear that there is a very wide range in the light responses of bryophytes, related to habitat – and that species with PPFD95% in the range 600–1000 µmol m−2 s−1 hardly qualify as ‘shade plants’. Wide variation in the number of chloroplasts per cell between sun and shade mosses has been reported by Duckett and Renzaglia (1988) and Robertson and Duckett (in Nasrulhaq-Boyce and Duckett, 1991). On the evidence of our sample, liverworts are generally more shade-adapted than mosses, but with a large overlap between the two groups. There is no clear evidence of any significant general differences between mosses and liverworts in the interrelationships of total chlorophyll (mg g−1), the chlorophyll a : b ratio, and the ratio of total chlorophylls to total carotenoids.
For fundamental physical reasons, small ectohydric plants with unistratose leaves, in which external capillary water plays a physiologically essential role, are inherently best adapted to function at rather low radiation incomes (Proctor and Tuba, 2002). On the one hand, high net radiation (W m−2) leads to high evaporation. On the other, high rates of photosynthetic CO2 uptake at high PPFD (µmol m−2 s−1) are readily met by the deep ventilated mesophyll of a vascular sun plant, but may not be met by the unistratose (but relatively thick walled) leaves of a bryophyte (Nobel, 1977). This is likely to be true even taking into account a ‘leaf-area index’ of 5 or more for the bryophyte—analogous to the mesophyll : leaf area ratio for a leaf (Proctor, 2000; Nobel, 1974). It is probably the fundamental limitation of bryophytes growing in permanently wet situations in which water is not a problem. It may not be a significant ecological constraint in the field because bryophytes of wet places are largely confined to nutrient-poor habitats, since they are unable to compete with the tall dense growth of vascular plants in fertile sites.
The desiccation-tolerant species of dry sunny places face the additional constraint that they quickly dry out in sunshine and, for most of the time the sun is shining, they will be dry and metabolically inactive. Natural selection might therefore be expected to have optimized the photosynthetic system for rainy and overcast conditions leading to lower saturation levels for photosynthesis than in species of permanently wet places. The present data do not support this idea, although the mosses of sunny desiccation-prone sites tend to be those in which there is greatest uncertainty in their light responses (double asterisks in Table 1). The gas-exchange measurements (Fig. 3) confirm at least that the saturation levels in Table 1 cannot be too low, and are probably not greatly at variance with actual rates of photosynthesis. The high values of NPQ typically seen in these plants can be seen as reflecting the need for protection against the combined stress of bright light and repeated cycles of drying and re-wetting, but the high chlorophyll contents found in several of the species are surprising. Their physiology needs further critical study.
The Polytrichaceae, with a ventilated photosynthetic tissue formed by lamellae on the upper leaf surface, in effect provide a test of the hypothesis that the rate of photosynthesis of bryophytes with unistratose leaves is limited by CO2 diffusion. With relatively high chlorophyll content, PPFD95% extending far beyond the range normal for other mosses, and low NPQ and 1 – qP, they more nearly approach the photosynthetic adaptation of vascular plants than any other bryophytes. The lamella systems of Polytrichaceae evidently correspond with a major shift in photosynthetic physiology relative to other mosses. But Polytrichaceae are typically also desiccation tolerant; the shoots dry out quickly and there is no indication that the lamellae significantly retard water loss. Thus the lamellae should be seen primarily as an adaptation enhancing CO2 uptake at high irradiance for a given water loss, rather than as an adaptation to control water loss as such. The present data have little to say about the other group of bryophytes with ventilated photosynthetic tissues, the Marchantiales. World-wide, these liverworts are primarily plants of permanently or seasonally moist open habitats, from the lowland tropics to temperate and alpine regions. They are prominent, for instance, in the winter flora of the Mediterranean, but they extend into permanently moist woodland habitats, where Conocephalum is common on stream banks. On our limited sample, the Marchantiales do not stand out from the other liverworts as do the Polytrichales from other mosses. However, they vary widely in the development of ventilated photosynthetic tissue in the thallus – lacking in the deep shade-adapted Dumortiera hirsuta, well developed in, for example, Lunularia cruciata, Targionia hypophylla and species of Riccia – and they would repay further exploration (Green and Lange, 1995). Notably, the Polytrichales and the Marchantiales both include gregarious, fast-growing invasive species of open habitats. Polytrichum species often cover large tracts of ground after forest or moorland fire (Maltby et al., 1990), and Marchantia, Lunularia and Conocephalum can be troublesome weeds of flower pots and nursery gardens.
Sphagnum is a special case. The species have relatively low PPFD95%, but high NPQ indicating a high level of photoprotection consistent with their unshaded habitat. The low saturation values for photosynthesis probably reflect high diffusion resistance to CO2 uptake—but this may be only a secondary limitation because low availability of N and P impose their own constraints on possible rates of production in most bog habitats. For all bryophytes, the photosynthetic parameters must be, to some extent, interlinked by the combination of natural selection and physiological control processes. This is underlined by the narrow range of discrimination against the heavy isotope 13C over a broad range of bryophytes and C3 flowering plants, in spite of wide variation in chlorophyll content, in morphology, and in the adaptations of different taxonomic groups and species to the availability of light and water (Rundel et al., 1979; Farquhar et al., 1989; Proctor et al., 1992; Price et al., 1997).
Supplementary Material
Acknowledgments
The award of a Hungarian Békésy postdoctoral fellowship to M.M is gratefully acknowledged.
LITERATURE CITED
- Alpert P, Oechel WC. 1987. Comparative patterns of net photosynthesis in an assemblage of mosses with contrasting microdistributions. American Journal of Botany 74: 1787–1796. [Google Scholar]
- Aro E-M. 1982. A comparison of the chlorophyll-protein composition and chloroplast ultrastructure in two bryophytes and two higher plants. Zeitschrift für Pflanzenphysiologie 108: 97–105. [Google Scholar]
- Bjorkman O, Demmig-Adams B. 1995. Regulation of photosynthetic light energy capture, conversion, and dissipation in leaves of higher plants. In: Schulze E-D, Caldwell MM, eds. Ecophysiology of photosynthesis. Berlin: Springer-Verlag, 17–47. [Google Scholar]
- Blockeel TL, Long DG. 1998.A check-list and census catalogue of British and Irish bryophytes., Cardiff: British Bryological Society. [Google Scholar]
- Demmig-Adams B. 1998. Survey of thermal energy dissipation and pigment composition in sun and shade leaves. Plant and Cell Physiology 39: 474–482. [Google Scholar]
- Duckett JG, Renzaglia KS. 1988. Ultrastructure and development of plastids in bryophytes. Advances in Bryology 3: 33–93. [Google Scholar]
- Farquhar GD, Ehleringer JR, Hubick KT. 1989. Carbon isotope discrimination and photosynthesis. Annual Review of Plant Physiology and Plant Molecular Biology 40: 503–537. [Google Scholar]
- Gilmore AM. 1997. Mechanistic aspects of xanthophyll cycle-dependent photoprotection in higher plant chloroplasts and leaves. Physiologia Plantarum 99: 197–209. [Google Scholar]
- Green TGA, Lange OL. 1995. Photosynthesis in poikilohydric plants: a comparison of lichens and bryophytes. In: Schulze E-D, Caldwell MM, eds. Ecophysiology of photosynthesis. Berlin: Springer-Verlag, 319–341. [Google Scholar]
- Johnson GN, Rumsey FJ, Headley AD, Sheffield E. 2000. Adaptations to extreme low light in the fern Trichomanes speciosum New Phytologist 148: 423–431. [DOI] [PubMed] [Google Scholar]
- Johnson GN, Scholes JD, Horton P, Young AJ. 1993. Relationships between carotenoid composition and growth habit in British plant species. Plant, Cell and Environment 16: 681–686. [Google Scholar]
- Johnson GN, Young AJ, Scholes JD, Horton P. 1993. The dissipation of excess excitation energy in British plant species. Plant, Cell and Environment 16: 673–679. [Google Scholar]
- Kallio P, Heinonen S. 1975. CO2 exchange and growth of Rhacomitrium lanuginosum and Dicranum elongatum In: Wiegolaski FE, ed. Fennoscandian tundra ecosystems. Berlin: Springer-Verlag, 138–148. [Google Scholar]
- Kershaw KA, Webber MR. 1986. Seasonal changes in the chlorophyll content and quantum efficiency of the moss Brachythecium rutabulum Journal of Bryology 14: 151–158. [Google Scholar]
- Lichtenthaler H, Wellburn AR. 1983. Determination of total carotenoids and chlorophyll a and b of leaf extracts in different solvents. Biochemical Society Transactions 603: 591–593. [Google Scholar]
- Maltby E, Legg CJ, Proctor MCF. 1990. The ecology of severe moorland fire on the North York Moors: effects of the 1976 fires, and subsequent surface vegetation development. Journal of Ecology 78: 490–518. [Google Scholar]
- Marschall M, Proctor MCF, Smirnoff N. 2000. Aspects of the photosynthetic responses of bryophytes. Journal of Experimental Botany 51 (suppl.): 58. [Google Scholar]
- Martin CE. 1980. Chlorophyll a : b ratios of eleven North Carolina mosses. Bryologist 83: 84–87. [Google Scholar]
- Martin CE, Adamson VJ. 2001. Photosynthetic capacity of mosses relative to vascular plants. Journal of Bryology 23: 319–323. [Google Scholar]
- Martin CE, Churchill SP. 1982. Chlorophyll concentrations and a : b ratios in mosses collected from exposed and shaded habitats in Kansas. Journal of Bryology 12: 297–304. [Google Scholar]
- Martínez-Abaigar J, Núñez-Olivera E, Sánchez-Díaz M. 1994. Seasonal changes in photosynthetic pigment composition of aquatic bryophytes. Journal of Bryology 18: 97–113. [Google Scholar]
- Maxwell K, Johnson GN. 2000. Chlorophyll fluorescence—a practical guide. Journal of Experimental Botany 51: 659–668. [DOI] [PubMed] [Google Scholar]
- Murchie EH, Horton P. 1997. Acclimation of photosynthesis to irradiance and spectral quality in British plant species: chlorophyll content, photosynthetic capacity and habitat preference. Plant, Cell and Environment 20: 438–448. [Google Scholar]
- Nasrulhaq-Boyce A, Duckett JG. 1991. Dimorphic epidermal cell chloroplasts in the mesophyll-less leaves of an extreme-shade tropical fern. New Phytologist 119: 433–444. [Google Scholar]
- Nasrulhaq-Boyce A, Haji Mohamed MA. 1987. Photosynthetic and respiratory characteristics of Malayan sun and shade ferns. New Phytologist 105: 81–88. [DOI] [PubMed] [Google Scholar]
- Nobel PS. 1974.Introduction to biophysical plant physiology. San Francisco: W.H. Freeman and Co. [Google Scholar]
- Nobel PS. 1977. Internal leaf area and cellular CO2 resistance: photosynthetic implications of variations with growth conditions and plant species. Physiologia Plantarum 40: 137–144. [Google Scholar]
- Price GD, McKenzie JE, Pilcher JR, Hoper ST. 1997. Carbon-isotope variation in Sphagnum from hummock-hollow complexes: implications for Holocene climatic reconstruction. The Holocene 7: 229–233. [Google Scholar]
- Proctor MCF. 2000. Physiological ecology. In: Shaw AJ, Goffinet B, eds. Bryophyte biology. Cambridge: Cambridge University Press, 225–247. [Google Scholar]
- Proctor MCF, Tuba Z. 2002. Poikilohydry and homoihydry: antithesis or spectrum of possibilities? New Phytologist 156: 327–349. [DOI] [PubMed] [Google Scholar]
- Proctor MCF, Raven JA, Rice SK. 1992. Stable carbon isotope discrimination measurements in Sphagnum and other bryophytes—physiological and ecological implications. Journal of Bryology 17: 193–202. [Google Scholar]
- Rao KR, Kumar NR, Reddy AN. 1979. Studies of photosynthesis in some liverworts. Bryologist 82: 286–289. [Google Scholar]
- Rastorfer JR. 1970. Effects of light intensity and temperature on photosynthesis and respiration of two east Antarctic mosses, Bryum argenteum and B. antarcticum Bryologist 73: 544–556. [Google Scholar]
- Rastorfer JR. 1972. Comparative physiology of four west Antarctic mosses. Antarctic Research Series 20: 143–161. [Google Scholar]
- Rosevear MJ, Young AJ, Johnson GN. 2001. Growth conditions are more important than species origin in determining leaf pigment content of British plant species. Functional Ecology 15: 474–480. [Google Scholar]
- Rundel PW, Stichler W, Zander RH, Ziegler H. 1979. Carbon and hydrogen isotope ratios of bryophytes from arid and humid regions. Oecologia 44: 91–94. [DOI] [PubMed] [Google Scholar]
- Schreiber U, Bilger W, Neubauer C. 1995. Chlorophyll fluorescence as a nonintrusive indicator for rapid assessment of in vivo photosynthesis. In: Schulze E-D, Caldwell MM, eds. Ecophysiology of photosynthesis. Berlin: Springer-Verlag, 49–70. [Google Scholar]
- Valanne N. 1984. Photosynthesis and photosynthetic products in mosses. In Dyer AF, Duckett JG, eds. The experimental biology of bryophytes. London: Academic Press, 257–273. [Google Scholar]
Associated Data
This section collects any data citations, data availability statements, or supplementary materials included in this article.