

Abstract
Eight‐week‐old vegetative plants of Arabidopsis thaliana, ecotype Columbia, were induced to flower by a single long day (LD). In this experimental system, it is known that the last component of the floral stimulus moves from the leaves to the apex 24–36 h after the start of the LD, and the first floral meristem is initiated by the shoot apical meristem (SAM) at 44–56 h (Corbesier et al., 1996, The Plant Journal 9: 947–952). Here we show that the rate of cell division is increased at floral transition in all SAM parts but not in the sub‐apical pith cells. Mitotic activity starts to increase 24 h after the start of the LD and is two‐ to three‐fold higher at peak times than that in non‐induced plants. This activation is followed by the start of SAM enlargement at 44 h, SAM doming at 48 h, and the elongation of apical internodes (bolting) at 52 h.
Key words: Arabidopsis thaliana, bolting, cell division, floral transition, growth fraction, meristem zones, shoot apical meristem, sub‐apical pith
INTRODUCTION
Stimulation of cell division and changes in size and shape in various parts of the shoot apex are known to be common features of the floral transition in many—if not all—plant species (Lyndon and Francis, 1984; Lyndon and Battey, 1985; Bernier, 1988; Francis, 1992; Francis and Herbert, 1993). As a rule, acceleration of the cell division cycle in the shoot apical meristem (SAM) is a very early event of the floral transition which precedes, by many hours, sometimes by days, the earliest growth changes affecting various apex parts as well as the initiation of the first reproductive structures. Thus, it was proposed that an increase in the cell division rate is a prerequisite for the subsequent morphological changes at the SAM floral transition (Francis, 1992; Bernier, 1997).
A similar situation might prevail in Arabidopsis thaliana. Besnard‐Wibaut (1970, 1977) noted increased percentages of nuclei incorporating labelled thymidine (presumably indicative of increased mitotic frequency) in several zones of the arabidopsis SAM in response to floral induction. On the other hand, Vaughan (1955), Miksche and Brown (1965) and Hempel and Feldman (1994) reported SAM enlargement and mounding‐up before initiation of the first floral meristem, as well as elongation of rib meristem cells causing the elongation of the stem axis (bolting). These studies left many questions unanswered, such as (1) where does the mitotic frequency start to increase in the SAM; (2) when does this increase happen relative to other events of the floral transition, e.g. the movement of the floral stimulus from leaves to apex, and the start of floral meristem initiation by the SAM; and (3) when do changes in SAM size and shape, as well as stem axis height, start relative to the above events?
The aim of this work was to answer these questions using the experimental system of synchronous floral induction in arabidopsis by one long day (LD) devised by Corbesier et al. (1996). In this system the start of the inductive LD is considered as hour zero and all plants flower when exposed to this LD, whereas those not exposed to it remain in a vegetative state for a further 1·5 months. Movement of the last component of the floral stimulus out of the leaves exposed to the LD occurs 24–36 h after the start of the LD, and initiation of the first floral meristem by the SAM occurs at 44–56 h.
MATERIALS AND METHODS
Plant material
Plants of Arabidopsis thaliana, ecotype Columbia, kindly provided by C. R. Somerville, were raised from vernalized seeds as described by Corbesier et al. (1996). They were maintained in the vegetative condition by continuous growth in 8‐h short days (SDs) (light period 0830–1630 h). When 8 weeks old, one batch of plants was induced to flower by exposure to a single 22‐h LD (light period 0830–0230 h) while another batch was kept in 8‐h SDs.
Histological methods
Apices of induced plants were harvested every 4 h from 20 to 72 h after the start of the LD. Apices of non‐induced plants were harvested at the same times. They were fixed in 2 % formaldehyde in 100 mm phosphate buffer, pH 7·2, sliced longitudinally into 10‐µm sections and stained with 0·1 % calcofluor (to show the general morphology of the apex), or in Navashin’ fixative (chromic acid 1 % : formaldehyde 37 % : HAc) (10 : 4 : 1 v/v/v), sliced longitudinally into 5‐µm sections and stained with haematoxylin (for description of SAM organization), or in formalin–acetic acid–alcohol (FAA) (2 : 1 : 17 v/v/v) and stained by the Feulgen reaction (for determination of mitotic indices, labelling indices—DNA synthetic indices—and growth fraction).
Mitotic indices were determined by recording mitotic figures (except prophases) separately in the central and peripheral zones as well as in the rib meristem of the SAM. These three zones were delineated on the basis of their histological characters (cell size, shape and stainability, nucleus size) (Fig. 1A and B). Only the most median section of each apex was considered. There were six apices per batch.
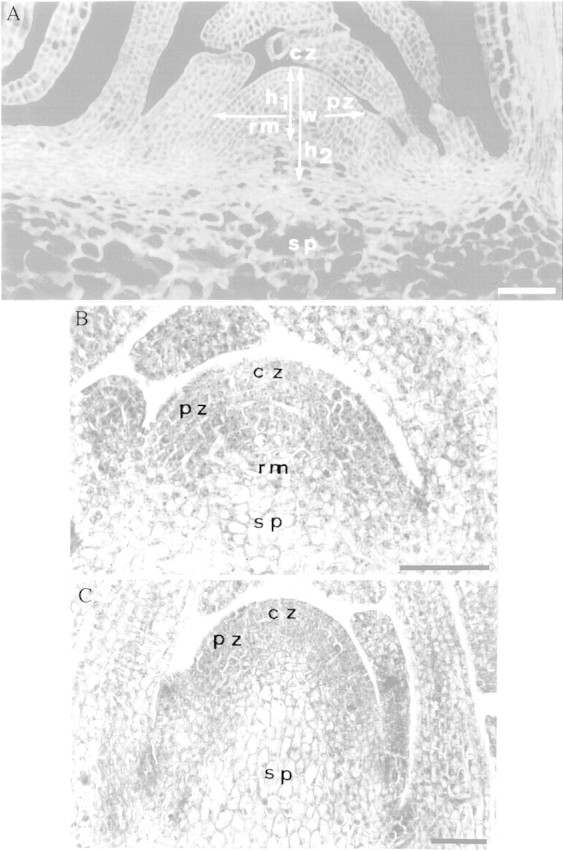
Fig. 1. Median longitudinal sections through apices of non‐induced plants (A and B) and an induced plant collected at 68 h after the start of the LD (C). Section A was stained with calcofluor and sections B and C with haematoxylin. Bar = 50 µm. cz, Central zone; h1, height of the SAM; h2, height of the stem axis; pz, peripheral zone; rm, rib meristem; sp, sub‐apical pith; w, width of the SAM.
DNA synthesis was investigated in the same zones by supplying [3H]thymidine (TdR) (specific activity, 962 GBq mmol–1; concentration, 0·37 MBq ml–1) to a small cotton plug carefully inserted into the partially defoliated apical bud, as described by Jacqmard et al. (1999). Different groups of non‐induced and induced plants received [3H]TdR for 4 h, 28–32, 36–40, 48–52 and 56–60 h after the start of the LD. Apices were fixed, sliced and stained as above, and then autoradiographed. Labelling indices (% frequency of cells that incorporate [3H]TdR into their nuclear DNA) were determined by recording labelled and unlabelled nuclei in the same zones as above in the median section of each apex. There were four to six apices per batch. [3H]TdR labelling can be used to study the cell division cycle in the SAM of arabidopsis since it has been established previously (Jacqmard et al., 1999) that only euploid cells are present in this tissue, demonstrating that only the cell division cycle occurs, not the endoreduplication cycle.
The growth fraction, i.e. the proportion of rapidly dividing cells, was determined in the same zones as above using a continuous application of [3H]TdR (specific activity, 70·3 GBq mmol–1; concentration, 18·5 kBq ml–1) to apices for 48 h, from 24 to 72 h after the start of the LD. It was assumed that within 48 h all rapidly dividing cells have accomplished at least part of the S‐phase of the cell cycle (see Clowes, 1976). After labelling, apices were fixed, sectioned, stained and autoradiographed as above, and the growth fraction determined as the percentage of labelled nuclei in the same zones as above in the median section of six to eight apices.
Morphological measurements
Heights of the SAM (h1) and stem axis (h2) were measured in apex median longitudinal sections from the top of the SAM to, respectively, the base of the rib meristem, or the insertion level of expanded rosette leaves on the stem (Fig. 1A). SAM width (w) was the distance separating the outer borders of the peripheral zone (Fig. 1A). There were six apices per batch.
Statistical analysis
Standard error was calculated for all mean values and data from non‐induced and induced plants were statistically compared using the χ2 test.
RESULTS
SAM organization
After 2 months of growth in non‐inductive SDs, the plants in the present study were still perfectly in rosette and their SAMs strictly in the vegetative phase of functioning (Fig. 1B). These SAMs had a tunica/corpus organization with a two‐layered tunica. They could also be divided into the three classical zones of dicot vegetative SAMs: (1) the central zone, lying at the SAM summit, contained cells that stained relatively lightly; (2) the peripheral zone, surrounding the central zone and producing the leaf primordia, was composed of darkly stained cells; and (3) a rib zone, lying below the central zone and forming the underlying central pith of the reduced stem axis (Fig. 1B). This histological zonation was superimposed onto the tunica/corpus organization.
During the floral transition caused by exposure to one LD, the staining difference between the central and peripheral zones faded away and the cells of the rib zone started to vacuolate and elongate becoming pith cells (Fig. 1C). Thus, only two domains remained distinct in the transitional SAMs: a superficial meristematic zone, including the former central and peripheral zones; and a central pith core.
Cell division in central and peripheral zones
In the SAM of non‐induced (vegetative), plants both the mitotic and labelling indices as well as the growth fraction were higher in the peripheral than in the central zone (Table 1). However, differences between the two zones were not statistically significant. Thus, despite the fact that these zones were histologically distinct (Fig. 1B), they exhibited apparently similar rates of cell division. Since they also exhibited homogeneity during the floral transition (Fig. 1C), the two zones will be considered in further work as forming a single meristematic unit.
Table 1.
Mitotic index, labelling index and growth fraction (± s.e.) in the peripheral and central zones of the SAM from non‐induced plants (average on four to six apices)
| Peripheral zone | Central zone | |
| Mitotic index (%) | 1·3 ± 0·8 | 0·7 ± 0·8 |
| Labelling index (%) | 10·4 ± 2·9 | 6·1 ± 2·9 |
| Growth fraction (%) | 28·6 ± 3·1 | 22·6 ± 3·8 |
In non‐induced plants the mitotic index of this unit was approx. 1 % throughout the experimental period (Fig. 2A). In induced plants the mitotic index was two‐ to three‐fold higher than that in non‐induced plants, with this increase starting from 24 h after the start of the LD and persisting at least during the next 48 h. However, only the figures for induced plants at 32 and 56 h were significantly higher (χ2 13·1 and 10·7, respectively) than the corresponding figures for non‐induced plants. The number and position of mitotic figures at these two sampling times in non‐induced and induced plants are shown in Fig. 3A–D. Note that the diagrams of Fig. 3A–D were compilations of all mitotic figures present in the most median longitudinal section of five different apices. Clearly, the increase in the number of mitoses at floral transition was detectable essentially in the peripheral part of the meristematic unit, although a few extra mitoses are also seen in the central part.
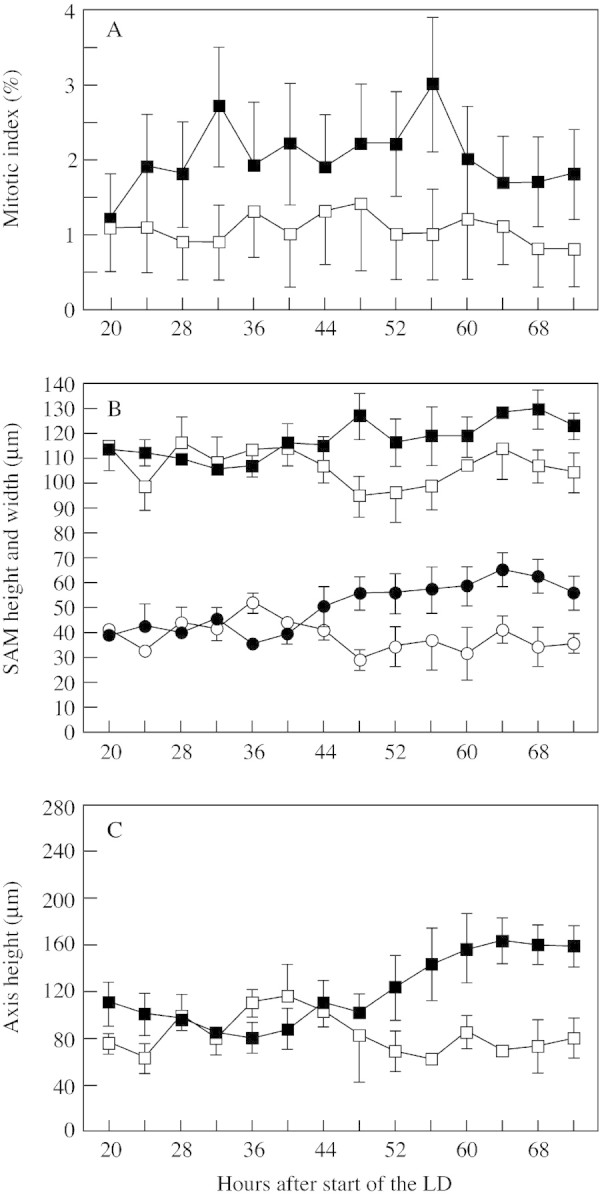
Fig. 2. (A) Mean mitotic index (percentage of cells with mitotic figures ± s.e.) in the unit including the central and peripheral zones of the SAM; (B) SAM height (closed and open circles) and width (closed and open squares); (C) stem axis height. Measurements were taken from median longitudinal sections of apices from non‐induced (open symbols) and induced (closed symbols) plants. The vertical bars indicate the standard errors.

Fig. 3. Distribution of mitotic figures (A–D) or nuclei labelled by [3H]TdR (E–F) in the median longitudinal section of apices from five non‐induced (A, C and E) and five induced plants (B, D and F). Apices were collected for mitoses at 32 h (A and B) and 56 h (C and D) and for labelled nuclei at 52 h (E and F) after the start of the LD.
A similar analysis was performed using the labelling index. This index was significantly higher in induced than in non‐induced plants at all time intervals considered (Table 2). At peak time in LD (48–52 h) it was 2·5 times higher, and the χ2 test was highly significant (64·2). As for mitotic figures, nuclei synthesizing DNA and thus being in the S‐phase of the cell cycle, were more numerous in all parts of the meristematic unit at 48–52 h after the start of the LD, but the increase was more marked in the peripheral part (Figs 3E, F and 4).
Table 2.
Labelling index (± s.e.) in % in the SAM during floral transition (average on four to six apices)
| Hours after start of LD | SDs | One LD |
| 28–32 | 8·2 ± 3·2 | 17·8 ± 4·3 |
| 36–40 | 7·9 ± 2·9 | 17·6 ± 2·8 |
| 48–52 | 8·9 ± 2·1 | 23·9 ± 2·7 |
| 56–60 | 9·8 ± 3·6 | 17·3 ± 2·4 |

Fig. 4. DNA synthesis in the apex. [3H]TdR was applied for 4 h. Autoradiographs of longitudinal sections through an apex of a non‐induced (A) and an induced plant collected at 52 h after the start of the LD (B). The sections were stained by the Feulgen reaction. Bar = 50 µm. Arrowheads indicate labelled nuclei. cz, Central zone; pz, peripheral zone, rm, rib meristem.
Increase in the rate of cell division at floral transition in the unit combining the central and peripheral zones was also demonstrated by determination of the growth fraction, i.e. the proportion of fast‐cycling cells, which increased almost 2·5 times, from 26·3 ± 2·4 % in non‐induced plants to 61·2 ± 2·9 % in induced plants. χ2 was highly significant (298).
Cell division in rib meristem and pith cells
The mitotic and labelling indices in the rib meristem of non‐induced plants were lower than those in the unit including the central and peripheral zones (Figs 3A, C and E and 4A). Mitotic indices fluctuated at the various time intervals considered from 0·3 to 0·9 %, and labelling indices from 0 to 3·2 %. In induced plants these two indices were often higher than those in non‐induced plants (Figs 3B, D and F and 4B), but the differences were rarely significant. That there was a statistically significant activation of cell division in the rib meristem was demonstrated by the study of the growth fraction, which rose 2·5 times, from 22·7 ± 6·3 % in non‐induced plants to 56·5 ± 9·3 % in induced plants. χ2 was highly significant (35·5).
The sub‐apical pith of vegetative plants consisted of very large and vacuolated cells (Figs 1A and 4A) showing no mitotic figures but with nuclei incorporating tritiated thymidine and thus undergoing DNA endoreduplication with nuclei in 4C and 8C (Jacqmard et al., 1999). At floral transition there was no apparent reactivation of mitotic and labelling activities in the previously formed pith cells (Figs 3B, D and F and 4B).
SAM size and shape
As a result of floral induction the SAM increased in both width and height (Fig. 1C vs. 1B and Fig. 2B). These increases started at 44 h after the start of the LD and became quite obvious during the following 24 h. The SAM also became more domed since there was a greater increase in height relative to width, as shown by the rise in the height : width ratio from 0·34 to 0·48–0·50 starting from 52 h.
Stem axis height
As shown in Fig. 2C, elongation of the apical internodes above the insertion level of expanded rosette leaves on the stem started in induced plants at 52 h and continued for the rest of the experimental period.
DISCUSSION
As in other dicots, the vegetative SAM of arabidopsis exhibits the classical division into three zones: the central, peripheral and rib zones (Lyndon, 1998; Fletcher, 2002; Nakajima and Benfey, 2002). However, the SAM of the arabidopsis plants in the present study grown for 2 months in non‐inductive SDs lacks one of the features that distinguish the central from the peripheral zone, i.e. a lower rate of cell division in the central zone (Table 1). Such a situation has been observed in a variety of photoperiodic species, including arabidopsis, grown for long periods in daylength regimes unfavourable for flowering (Nougarède, 1967; Besnard‐Wibaut, 1970; Bernier et al., 1981), and whose SAMs have reached what Nougarède called the ‘intermediate’ stage.
Using the system of synchronous floral induction by one LD (Corbesier et al., 1996), the importance, localization and timing of changes in the cell division process in the arabidopsis SAM during the floral transition was determined for the first time. Analyses included determination of mitotic and labelling indices as well as the growth fraction. The validity and significance of such analyses have been discussed by Lyndon (1998). Taken together, the present results show clearly that the rate of cell division is increased in all SAM zones at floral transition, as has been reported in many other species (Lyndon, 1998). However, the increase in arabidopsis is not as strong as those commonly recorded in other species subjected to a sudden transfer from a non‐inductive to an inductive daylength regime. Indeed, in these arabidopsis plants, the mitotic and labelling indices exhibit increases of the order of 250–300 % at peak times against increases of 400–1000 % in the central zone of Sinapis alba and Xanthium strumarium SAMs (Bernier et al., 1967; Jacqmard et al., 1976), in the whole SAM of Silene coeli‐rosa (Francis and Lyndon, 1979) and in the axillary bud sites (from which spikelets are initiated) of the Lolium temulentum apex (Ormrod and Bernier, 1990). This lesser activation in arabidopsis is presumably due to the fact that this species is a facultative LD plant which is progressing slowly with time to the floral state even in unfavourable SDs (Bernier, 1994; Gocal et al., 2001). Thus, even though the arabidopsis plants in the present study are still in rosette and producing only leaves after 2 months of growth in SDs, they are probably closer to the floral state than the vegetative plants of the other species mentioned above or younger Arabidopsis plants, hence their lesser mitotic response to a photoinductive treatment.
An increased mitotic index in the unit combining the central and peripheral zones is detectable at all time intervals examined from 24 h after the start of the LD. Although only the increases at 32 and 56 h are statistically significant, the fact that all figures for induced plants are at least twice as high as those for non‐induced plants indicates that activation of cell division starts at 24 h and is lasting. In fact, this activation initiates during the period of movement of the floral stimulus from leaves to apex (24–36 h after the start of the LD; Corbesier et al., 1996). It is thus a fast response to the arrival at the SAM of the floral stimulus or more probably of one of its early components. Such an early mitotic activation, starting before the movement of the floral stimulus is completed has also been reported in Sinapis, Xanthium and Lolium (Bernier, 1989; Jacqmard et al., 1976, 1993).
In Sinapis, Gonthier et al. (1987) showed that the increase in the frequency of cell division in the central and peripheral zones at floral transition results from both a shortening of the cell cycle duration in fast‐cycling cells and an increase of the growth fraction. In arabidopsis, the increased mitotic frequency can be partly explained by the observed increase of the growth fraction (see above). Further analyses are necessary to determine whether a reduction of the duration of the cell cycle is also part of the explanation.
Growth fraction determinations indicate that an activation of the cell division process also occurs in the rib meristem zone at floral transition but there is no re‐activation of the pre‐existing underlying pith cells. The apical internodes that will start to elongate at later times and will form an elongating stem axis are thus derived exclusively from the dividing cells of the rib meristem. This is consistent with the observation of Vaughan (1955). However, this seems to be in complete contrast with the situation described in several other rosette plants, such as Samolus parviflorus, Hyoscyamus niger and Rudbeckia bicolor, in which stem elongation (bolting) caused by a application of gibberellin is associated with mitotic activation essentially in the sub‐apical pith (Sachs, 1965; Jacqmard, 1968; Gocal et al., 2001).
As already noted in previous studies (see Introduction) there is enlargement and mounding‐up of the SAM at floral transition. Here it is shown that: (1) these changes follow, by 20–24 h, the first signs of mitotic activation in the SAM and are presumably consequences of this earlier activation; (2) increased SAM size and doming precede, by 4–8 h, the elongation of apical internodes; and (3) all these changes occur during the time interval of 44–56 h when floral meristems are first initiated by the SAM (Corbesier et al., 1996). Thus, onsets of bolting and flower formation are concomitant events in our plant material.
ACKNOWLEDGEMENTS
The authors thank A. Pieltain and N. Detry for excellent technical assistance. This work was supported by the ‘Poles d’attraction interuniversitaires belges’ (Service du Premier Ministre, Services fédéraux des Affaires scientifiques, techniques et culturelles, P 4/15) and by the F.R.F.C. (no. 2.4524.96) of Belgium.
Supplementary Material
Received: 7 October 2002; Returned for revision: 26 November 2002; Accepted: 18 December 2002 Published electronically: 13 February 2003
References
- BernierG.1988. The control of floral evocation and morphogenesis. Annual Review of Plant Physiology and Plant Molecular Biology 39: 175–219. [Google Scholar]
- BernierG.1989. Events of the floral transition of meristems. In: Lord E, Bernier G, eds. Plant reproduction: from floral induction to pollination Rockville: American Society of Plant Physiologists, 42–50. [Google Scholar]
- BernierG.1994. Vegetative plants may differ in their ‘vegetativeness’. Flowering Newsletter 18: 58–61. [Google Scholar]
- BernierG.1997. Growth changes in the shoot apex of Sinapis alba during transition to flowering. Journal of Experimental Botany 48: 1071–1077. [Google Scholar]
- BernierG, Kinet J‐M, Bronchart R.1967. Cellular events at the meristem during floral induction in Sinapis alba L. Physiologie Végétale 5: 311–324. [Google Scholar]
- BernierG, Kinet J‐M, Sachs RM.1981. The physiology of flowering, Vol. II. Boca Raton: CRC Press. [Google Scholar]
- Besnard‐WibautC.1970. Action comparée de la photopériode et de l’acide gibbérellique et sur le fonctionnement apical de l’Arabidopsis thaliana Etude histoautoradiographique des synthèses nucléiques et de leur modification lors du passage à l’état reproducteur. Revue de Cytologie et de Biologie végétale 33: 265–288. [Google Scholar]
- Besnard‐WibautC.1977. Histoautoradiographic analysis of the thermoinductive processes in the shoot apex of Arabidopsis thaliana L. Heynh. vernalized at different stages of development. Plant & Cell Physiology 18: 949–962. [Google Scholar]
- ClowesFAL.1976. Estimation of growth fractions in meristems of Zea mays L. Annals of Botany 40: 933–938. [Google Scholar]
- CorbesierL, Gadisseur I, Silvestre G, Jacqmard A, Bernier G.1996. Design in Arabidopsis thaliana of a synchronous system of floral induction by one long day. The Plant Journal 9: 947–952. [DOI] [PubMed] [Google Scholar]
- FletcherJC.2002. Shoot and floral meristem maintenance in Arabidopsis. Annual Review of Plant Biology 53: 45–66. [DOI] [PubMed] [Google Scholar]
- FrancisD.1992. The cell cycle in plant development. New Phytologist 122: 1–20. [DOI] [PubMed] [Google Scholar]
- FrancisD, Herbert RJ.1993. Regulation of cell division in the shoot apex. In: Ormrod JC, Francis D, eds. Molecular and cell biology of the plant cell cycle Dordrecht: Kluwer Academic Publishers, 201–210. [Google Scholar]
- FrancisD, Lyndon RF.1979. Synchronisation of cell division in the shoot apex of Silene in relation to flower initiation. Planta 145: 151–157. [DOI] [PubMed] [Google Scholar]
- GocalGFWet al.2001. GAMYB‐like genes, flowering, and gibberellin signaling in Arabidopsis. Plant Physiology 127: 1682–1693. [PMC free article] [PubMed] [Google Scholar]
- GonthierR, Jacqmard A, Bernier G.1987. Changes in cell‐cycle duration and growth fraction in the shoot meristem of Sinapis during floral transition. Planta 170: 55–59. [DOI] [PubMed] [Google Scholar]
- HempelFD, Feldman LJ.1994. Bi‐directional inflorescence development in Arabidopsis thaliana: acropetal initiation of flowers and basipetal initiation of paraclades. Planta 192: 276–286. [Google Scholar]
- JacqmardA.1968. Early effects of gibberellic acid on mitotic activity and DNA synthesis in the apical bud of Rudbeckia bicolor Physiologie Végétale 6: 409–416. [Google Scholar]
- JacqmardA, Raju MVS, Kinet J‐M, Bernier G.1976. The early action of the floral stimulus on mitotic activity and DNA synthesis in the apical meristem of Xanthium strumarium American Journal of Botany 63: 166–174. [Google Scholar]
- JacqmardA, Bomans J, Ormrod JC, Bernier G.1993. Early increase in the mitotic index in the shoot apex of Lolium temulentum cv. Ceres during the floral transition. Journal of Experimental Botany 44: 1407–1409. [Google Scholar]
- JacqmardA, De Veylder L, Segers G, de Almeida Engler J, Bernier G, Van Montagu M, InzéD.1999. Expression of CKS1At in Arabidopsis thaliana indicates a role for the protein in both the mitotic and the endoreduplication cycle. Planta 207: 496–504. [DOI] [PubMed] [Google Scholar]
- LyndonRF.1998. The shoot apical meristem. Its growth and development. Cambridge: Cambridge University Press. [Google Scholar]
- LyndonRF, Battey NH.1985. The growth of the shoot apical meristem during flower initiation. Biologia Plantarum 27: 339–349. [Google Scholar]
- LyndonRF, Francis D.1984. The response of the shoot apex to light‐generated signals from the leaves. In: Vince‐Prue D, Thomas B, Cockshull KE, eds. Light and the flowering process London: Academic Press, 171–189. [Google Scholar]
- MikscheJP, Brown JAM.1965. Development of vegetative and floral meristems of Arabidopsis thaliana (L.) Heynh. American Journal of Botany 52: 533–537. [Google Scholar]
- NakajimaK, Benfey PN.2002. Signalling in and out: control of cell division and differentiation in the shoot and root. The Plant Cell 14: S265–S276. [DOI] [PMC free article] [PubMed] [Google Scholar]
- NougarèdeA.1967. Experimental cytology of the shoot apical cells during vegetative growth and flowering. International Review of Cytology 21: 203–351. [DOI] [PubMed] [Google Scholar]
- OrmrodJC, Bernier G.1990. Cell cycle patterns in the shoot apex of Lolium temulentum L. cv. Ceres during the transition to flowering following a single long day. Journal of Experimental Botany 41: 211–216. [Google Scholar]
- SachsRM.1965. Stem elongation. Annual Review of Plant Physiology 16: 73–96. [Google Scholar]
- VaughanJG.1955. The morphology and growth of the vegetative and reproductive apices of Arabidopsis thaliana (L.) Heynh. Capsella bursa‐pastoris (L.) Medic. and Anagallis arvensis L. Journal of the Linnean Society of London 55: 279–301. [Google Scholar]
Associated Data
This section collects any data citations, data availability statements, or supplementary materials included in this article.