

Abstract
Recent genome sequencing papers have given genome sizes of 180 Mb for Drosophila melanogaster Iso‐1 and 125 Mb for Arabidopsis thaliana Columbia. The former agrees with early cytochemical estimates, but numerous cytometric estimates of around 170 Mb imply that a genome size of 125 Mb for arabidopsis is an underestimate. In this study, nuclei of species pairs were compared directly using flow cytometry. Co‐run Columbia and Iso‐1 female gave a 2C peak for arabidopsis only approx. 15 % below that for drosophila, and 16C endopolyploid Columbia nuclei had approx. 15 % more DNA than 2C chicken nuclei (with >2280 Mb). Caenorhabditis elegans Bristol N2 (genome size approx. 100 Mb) co‐run with Columbia or Iso‐1 gave a 2C peak for drosophila approx. 75 % above that for 2C C. elegans, and a 2C peak for arabidopsis approx. 57 % above that for C. elegans. This confirms that 1C in drosophila is approx. 175 Mb and, combined with other evidence, leads us to conclude that the genome size of arabidopsis is not approx. 125 Mb, but probably approx. 157 Mb. It is likely that the discrepancy represents extra repeated sequences in unsequenced gaps in heterochromatic regions. Complete sequencing of the arabidopsis genome until no gaps remain at telomeres, nucleolar organizing regions or centromeres is still needed to provide the first precise angiosperm C‐value as a benchmark calibration standard for plant genomes, and to ensure that no genes have been missed in arabidopsis, especially in centromeric regions, which are clearly larger than once imagined.
Key words: DNA C‐value, flow cytometry, genome size, Arabidopsis thaliana, Caenorhabditis elegans, Drosophila melanogaster
INTRODUCTION
The year 2000 saw landmark publications giving ‘complete genome sequences’ for the fruit fly Drosophila melanogaster strain Iso‐1 (Adams et al., 2000) and the flowering plant Arabidopsis thaliana (L.) Heynh. ecotype Columbia (Arabidopsis Genome Initiative, 2000), which led to new estimates of ‘genome size’ in these organisms. The drosophila genome was given as ‘∼180 Mb in size, a third of which is centric heterochromatin’ (Adams et al., 2000). Genome size in A. thaliana was given as 125 Mb, comprising 115·4 Mb in the sequenced regions plus a rough estimate of 10 Mb in unsequenced centromere and ribosomal DNA (rDNA) regions (Arabidopsis Genome Initiative, 2000). However, the term genome can refer to either all the nuclear DNA or to only some of it, and a completely sequenced genome is a relative concept (Bork and Copley, 2001). It can mean that every type of sequence in an organism has been sequenced, but it need not mean that all copies of all types have been sequenced, or that their copy numbers are all known. Without this information total genome size (C‐value) cannot be determined based on genome sequencing.
The only higher organism where such work is so complete as to allow accurate knowledge of its genome size based on sequencing alone is Caenorhabditis elegans variety Bristol strain N2. In 1998 its genome sequence, then thought to be >99 % complete, was given as approx. 97 Mb (C. elegans Sequencing Consortium, 1998), and in February 2000 it was given as approx. 100·25 Mb (http://www.wormbase.org/). Sequencing of arabidopsis and drosophila genomes is much less complete as both contain several large gaps of unknown size (Adams et al., 2000; Arabidopsis Genome Initiative, 2000). Their genome sizes (Adams et al., 2000; Arabidopsis Genome Initiative, 2000) were estimates whose accuracy was set not by the precision of sequencing and assembling contigs, but by the total inaccuracy in the sizes assumed for the unsequenced gaps. Such estimates may be no more accurate than many made by other methods.
If 125 Mb (Arabidopsis Genome Initiative, 2000) is a correct estimate for the genome size of arabidopsis, then many previous estimates based on various kinds of sequence analyses (approx. 70 Mb, Leutwiler et al., 1984; approx. 50 Mb, Francis et al., 1990; approx. 100 Mb, Meyerowitz, 1994) were underestimates, especially in contrast to many higher estimates obtained using cytochemistry (Bennett, 1972; Bennett and Smith, 1976, 1991; Krisai and Greilhuber, 1997) or flow cytometry (Arumuganathan and Earle, 1991; Galbraith et al., 1991; Marie and Brown, 1993; Dolezel et al., 1998) in the range 170 ± 20 Mb. Original genome size estimates in A. thaliana made by various methods are given in Table 1 and in the Appendix (note 1). Estimates based on cytochemical or cytometric techniques mostly exceed the range of estimates for arabidopsis acknowledged by the Arabidopsis Genome Initiative (AGI) (2000), but approach or exceed that for drosophila reported by Adams et al. (2000). Given this inconsistency, these two species were compared directly using flow cytometry (FC). We also compared arabidopsis with C. elegans whose C‐value is accurately known from genome sequencing (C. elegans Sequencing Consortium, 1998), and with Gallus domesticus whose C‐value is acceptably known from chemical and other estimates (Galbraith et al., 1983) (Appendix, see note 2).
Table 1.
DNA C‐values for Arabidopsis thaliana estimated by Feulgen photometry (FE), flow cytometry (FC), or the molecular methods: reassociation kinetics (RK) and quantitative gel blot hybridization (GBH)
| 1C DNA amount | Size standard and | ||
| Technique and reference | pg | Mb | 1C DNA amount |
| RK (Leutwiler et al., 1984) | 0·082 | 80·0* | E. coli = 4·64 Mb |
| [0·071 | 70·0* | E. coli = 4·10 Mb] | |
| GBH (Francis et al., 1990) | 0·051 | 50·0* | – |
| FE (Bennett and Smith, 1991) | 0·175* | 171·5 | Vigna = 0·53 pg |
| FE (Krisai and Greilhuber, 1997) | 0·167* | 163·7 | Allium = 16·78 pg |
| Pisum = 4·42 pg | |||
| FC : MI (Galbraith et al., 1991) | 0·085* | 83·0 | Yeast = 13·39 Mb |
| [0·095 | 93·0 | Yeast = 15 Mb] | |
| 0·160* | 156·8 | CRBC = 1·165 pg | |
| FC : Hoechst (Galbraith et al., 1991) | 0·165* | 161·7 | CRBC = 1·165 pg |
| FC : DAPI (Galbraith et al., 1991) | 0·170* | 166·6 | CRBC = 1·165 pg |
| FC : PI (Arumuganathan and Earle, 1991) | 0·150* | 147·0 | CRBC = 1·165 pg |
| FC : PI (Marie and Brown, 1993) | 0·165* | 161·7 | CRBC = 1·165 pg |
| FC : PI (Dolezel et al., 1998) | 0·195* | 191·1 | Pisum = 4·55 pg |
| 0·185* | 181·3 | Allium = 16·78 pg | |
| FC : PI (this work) | 0·153* | 150·0 | Drosophila = 180 Mb |
| 0·167* | 163·7 | CRBC = 1·165 pg | |
| 0·160 | 157·0 | C. elegans = 100 Mb | |
Fluorochromes used for FC were: mithramycin (MI), 4′,6‐diamidino‐2‐phenylindole (DAPI), Hoechst 33258 (Hoechst), propidium iodide (PI). Molecular biologists gave estimates in Mb and others mainly in pg (1 pg = 980 Mb; Cavalier‐Smith, 1985)—original form marked with an asterisk. Values from Arumuganathan and Earle (1991) using 1 pg = 965 Mb (Strauss, 1971) have been corrected. Size standards were Allium cepa (Allium); Caenorhabditis elegans strain Bristol N2 (C. elegans); chicken red blood cells (CRBC); Drosophila melanogaster strain Iso‐1 (Drosophila); Escherichia coli (E. coli); Pisum sativum (Pisum); Saccharomyces cerevisiae (Yeast); or Vigna radiata ‘Berken’ (Vigna). For E. coli and yeast, genome size was later established by DNA sequencing (Goffeau et al., 1996; Blattner et al., 1997), so the original estimate in parentheses is preceded by a recalibrated value based on this.
MATERIALS AND METHODS
Seed of Arabidopsis thaliana ecotype Columbia was obtained from the Arabidopsis Stock Centre (Nottingham, UK). Drosophila melanogaster strain Iso‐1 was obtained from Gerald Rubin (University of California at Berkeley, CA, USA). Caenorhabditis elegans variety Bristol strain N2 was provided by the Caenorhabditis Genetics Centre, which is funded by the NIH National Centre for Research Resources (NCRR). Blood of Gallus domesticus was obtained from a ‘DeKalb Reference Stock’ male White Leghorn homozygous for the B19 haplotype (Briles and Briles, 1982) from Northern Illinois University (DeKalb, IL, USA) (Seo et al., 2000), hatched and housed at the Laboratory Animal Resources Facility, Texas A&M University (College Station, Texas, USA).
‘Galbraith’ buffer used to suspend nuclei of these species for flow cytometry consisted of, per litre, 4·26 g MgCl2, 8·84 g sodium citrate, 4·2 g 3‐[N‐morpholino] propane sulfonic acid, 1 ml Triton X‐100™ and 1 mg boiled ribonuclease A (Galbraith et al., 1983), adjusted to pH 7·2 (Johnston et al., 1999). This buffer was successfully used for arabidopsis (Galbraith et al., 1991) and gives high stability of plant and animal nuclei for up to 30 h.
Preparing nuclear suspensions for interspecific comparisons by flow cytometry
Seedlings grown on agar in a Petri dish, or newly expanded rosette leaves from flowering plants of arabidopsis grown at 24 °C day (13 h)/18 °C (11 h) night were manually chopped using a razor blade to release nuclei into Galbraith buffer, as described previously (Johnston et al., 1999), and filtered through a 53‐µm nylon mesh to recover 1 ml, which was kept on ice. Two heads of female drosophila were placed in 2 ml Galbraith buffer, stroked 15 times with an A pestle in a Kontes Dounce tissue grinder and filtered through a 20‐µm nylon mesh. For comparison in mixtures with arabidopsis, a small aliquot (approx. 50 µl) was added to a sample of arabidopsis nuclei, and propidium iodide (PI) was then added as described below.
To compare G. domesticus with arabidopsis, 5 ml newly drawn chicken blood was put into a sterile Monoject™ collection tube containing 0·07 ml 15 % solution of EDTA(K3) in purified water, calculated equivalent to 10·5 mg. This was stored for up to 10 d at 4 °C. Stock solutions were prepared by adding 50 µl to 2 ml Galbraith buffer, followed by stroking 15 times with an A pestle in a Kontes Dounce tissue grinder, and filtering though a 20‐µm nylon mesh. Aliquots were mixed with newly prepared nuclei suspensions of arabidopsis in 1 ml Galbraith buffer.
C. elegans, cultured and prepared by standard methods (Brenner, 1974), were suspended in distilled water, gently pelleted and the supernatant discarded. About 0·1 ml of the pelleted sample was resuspended in 1 ml of distilled water and repelleted. A 10 µl aliquot was pipetted into 2 ml Galbraith buffer (Galbraith et al., 1983), stroked 50 times with an A pestle in a Kontes Dounce tissue grinder and filtered through a 20‐µm nylon mesh. For comparison with arabidopsis, a small aliquot (approx. 50 µl) was added to a sample of arabidopsis nuclei. For comparison with drosophila, the head of a female fly was added to a C. elegans sample after 35 strokes, and the mixture stroked a further 15 times before filtering through a 20‐µm nylon mesh, and a small aliquot (approx. 50 µl) added to 1 ml buffer.
Flow cytometry
For all comparisons, PI was added to samples to a final concentration of 50 ppm, and the mixture co‐stained in the dark at 4 °C for a known duration of up to 24 h (usually 1–9 h). The mean fluorescence of co‐stained nuclei in at least ten replicate samples of each species comparison was quantified using a Coulter Epics Elite (Coulter Electronic, Hialeah, FL, USA) flow cytometer with a laser tuned at 514 nm and 500 mW. Fluorescence at >615 nm was detected by a photomultiplier screened by a long pass filter.
RESULTS
Relative nuclear DNA C‐values in arabidopsis and drosophila
If the recent estimates of 1C‐values of approx. 125 Mb for arabidopsis (Arabidopsis Genome Initiative, 2000) and approx. 180 Mb for drosophila (Adams et al., 2000) are both correct, then the 2C peak at approx. 360 Mb for drosophila is expected mid‐way between the 2C and 4C peaks at approx. 250 and 500 Mb for arabidopsis. But if a higher 1C estimate of approx. 170 Mb is correct for arabidopsis, then the 2C peak for arabidopsis at approx. 340 Mb should closely approach the 2C peak at approx. 360 Mb for drosophila. When the two stocks used for genome sequencing were compared in mixtures, the 2C peak for Columbia was only approx. 15 % below the peak for Iso‐1 (Fig. 1A). This gives a 1C DNA amount of approx. 153 Mb for arabidopsis if the estimate (approx. 180 Mb) for drosophila is correct.
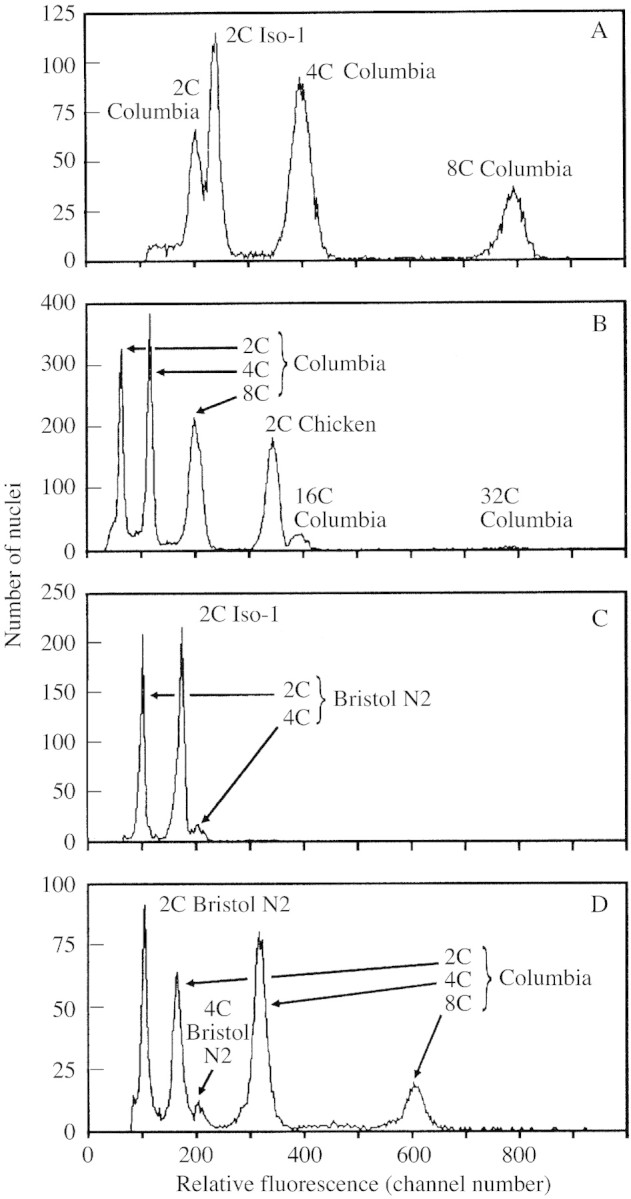
Fig. 1. Relative DNA staining in nuclei of arabidopsis, drosophila, Gallus and Caenorhabditis. A, Arabidopsis has approx. 85 % of the 2C nuclear DNA fluorescence of drosophila. Relative red fluorescence of PI‐stained nuclei shows a ratio of approx. 0·85 : 1·00 between A. thaliana ecotype Columbia (2C mean = 201·6) and female D. melanogaster strain Iso‐1 (2C mean = 236·7). The arabidopsis 2C peak was identified as the lowest in its 2C (mean = 201·6), 4C (mean = 398·8), 8C (mean = 792·1), etc. doubling series. PI staining time = 4 h. B, Arabidopsis 16C nuclear DNA fluorescence exceeds that of 2C chicken. Relative red fluorescence of PI‐stained nuclei shows a ratio of approx. 1·15 : 1·00 between endopolyploid 16C nuclei of A. thaliana ecotype Columbia (16C peak mean = 390·9) and chicken erythrocyte nuclei (2C peak = 341·7). NB Arabidopsis is identified from its known doubling series 2C, 4C, 8C, 16C.) PI staining time = 2·8 h. C, Drosophila has approx. 175 % 2C nuclear DNA fluorescence of C. elegans. Relative red fluorescence of PI‐stained nuclei shows a ratio of approx. 1·00 : 1·74 between C. elegans variety Bristol N2 (2C mean = 95·9) and female D. melanogaster strain Iso‐1 (2C mean = 167·2). PI staining time = 9·3 h. D, Arabidopsis has approx. 157 % 2C nuclear DNA fluorescence of Caenorhabditis. Relative red fluorescence of PI‐stained nuclei shows a ratio of approx. 1·00 : 1·54 between C. elegans variety Bristol N2 (2C mean = 101·6) and A. thaliana ecotype Columbia (2C mean = 159·6). PI staining time = 4·1 h. NB Species were identified by varying the relative amounts of nuclei from one to the other between runs within each mixture.
Relative nuclear DNA C‐values in arabidopsis and chicken
The genome size of A. thaliana has also been estimated by FC using chicken red blood cells (CRBC) as a size standard, comparing 2C and endopolyploid nuclei (Table 1). Endopolyploidy is common in arabidopsis (Galbraith et al., 1991), which allows comparisons of nuclei of more similar DNA contents with lower experimental error (Johnston et al., 1999). FC was used in the present study to compare 16C endopolyploid nuclei from expanded leaves of arabidopsis with 2C CRBC nuclei (Galbraith et al., 1983) co‐stained in mixtures, using a second animal species as a control.
Most estimates of 2C DNA amount in CRBC are in the range 2·33–2·5 pg (see supporting information in Appendix, note 2). If arabidopsis 1C is 125 Mb (Arabidopsis Genome Initiative, 2000), its 16C‐value would be 2·0 pg, below any 2C‐value for chicken; however, if 1C is approx. 0·17 pg for arabidopsis then 16C would be approx. 2·7 pg, above any 2C‐value for CRBC. When nuclei from CRBC and expanded leaves of arabidopsis were co‐stained with PI, the peak for 16C arabidopsis nuclei was always above that for 2C CRBC (Fig. 1B). Indeed, it averaged approx. 15 % higher, giving 1C‐values for arabidopsis of approx. 0·165 pg or 0·180 pg, respectively, if 2C‐values of 2·33 or 2·5 pg are assumed for chicken.
Relative DNA C‐values in Caenorhabditis and drosophila or arabidopsis
When C. elegans and female drosophila were compared in mixtures, the 2C peak for drosophila averaged approx. 75 % above that for C. elegans (Fig. 1C), giving a 1C DNA amount of approx. 175 Mb for drosophila based on an estimate of 100 Mb for C. elegans.
When C. elegans and arabidopsis were co‐run in mixtures, the 2C peak for arabidopsis averaged approx. 57 % above that for C. elegans (Fig. 1D), giving a 1C DNA amount of approx. 157 Mb for arabidopsis based on an estimate of 100 Mb for C. elegans.
Could the results obtained for arabidopsis be overestimates owing to technical artefacts?
The present results are unlikely to be the result of a technical artefact as controls to vary the method or material gave similar results. Three different standards all gave estimates for arabidopsis in the range 153–162 Mb (Fig. 1A–D). Concerns about using animal nuclei as size standards for plant materials (Galbraith et al., 1983) do not apply here as the present plant and animal nuclei were freshly prepared in Galbraith buffer in each experiment and co‐stained in the same tube using the non‐base specific fluorochrome PI. Staining with PI saturated in all species by 1 h and then remained almost constant for 1–24 h after staining (data not shown). DNA is more methylated in arabidopsis than in the animal standards with which arabidopsis was compared, but we are unaware of published work showing lower binding of PI to unmethylated vs. methylated DNA sufficient to account for our results, and methylation in A. thaliana Columbia (approx. 6·4 % of cytosine bases; Ronemus et al., 1996) is too low to inflate the estimate of 125 Mb by 25 % to give our estimate (157 Mb). Moreover, the level of methylation in A. thaliana Columbia (approx. 1·3 % of all bases) is similar to that in chicken erythrocytes (1·04 % of all bases; Vanyushi et al., 1973). Yet comparing these (Fig. 1B) gave a similar estimate for arabidopsis (approx. 162 Mb) as comparing arabidopsis with Caenorhabditis, which has no methylation (approx. 157 Mb) (Fig. 1D). Clearly, any effect of differential methylation is minor, and can be discounted as an explanation for our results.
Further evidence that strongly supports this conclusion comes from additional experiments in which arabidopsis with very different levels of DNA methylation is compared with C. elegans. Vongs et al. (1993) described a mutant of A. thaliana named ddm1 (for decrease in DNA methylation) in which the amount of 5‐methylcytosine was reduced to only 25–30 % of that found in wild‐type plants. Seeds of the F3 generation of ddm1 (obtained from E. J. Richards, Washington University, St Louis, MO, USA) were cultivated, one per pot, in the same growth room as plants of Columbia. Nuclei isolated from a comparable leaf of one or other line were compared with nuclei of C. elegans, as described above. When C. elegans and A. thaliana ecotype Columbia, which has high methylation, were co‐run in mixtures, the 2C peak for arabidopsis was, on average, 58·7 % above that for C. elegans, giving a mean 1C DNA amount of approx. 158·7 Mb (s.e. = 1·2) for six plants of Columbia. However, when C. elegans and A. thaliana mutant ddm1 were co‐run in mixtures, the mean 2C peak for arabidopsis was approx. 56·8 % above that for C. elegans, giving a 1C DNA amount of approx. 156·8 Mb (s.e. = 1·1) for ddm1 which has low methylation, based on an estimate of 100 Mb for C. elegans. The means differ only by 1·2 %, and a Student’s t‐test showed that the probability that these means are from the same population is 0·21. Thus, they are not significantly different, despite the large difference in the level of methylation between wild‐type arabidopsis and ddm1 mutants.
DISCUSSION
Was a genome size of 180 Mb for drosophila a significant overestimate?
Adams et al. (2000) did not explain clearly how they obtained their estimate for the genome size of drosophila of 180 Mb. No estimate was cited for the total amount of DNA in heterochromatin based on molecular studies. The method used in Adams et al. (2000) to estimate the large part of the drosophila genome intractable to sequencing was crude, i.e. direct measurements from cells shown in Yamamoto et al. (1990), and assuming that hetero‐ and euchromatic segments have identical DNA contents per unit chromosome length—an assumption that may be dubious (Jones and Rees, 1982; Haupt et al., 2001). This raises a question as to whether the estimate of approx. 180 Mb for genome size in Iso‐1 (Adams et al., 2000) is accurate. Other evidence shows that it cannot be inflated by more than 10 %, and may be an accurate estimate. First, the new estimate of 180 Mb for Iso‐1 (Adams et al., 2000) matches the cytochemical estimate of 1C = approx. 0·18 pg (Rasch et al., 1971) for Oregon R male. The latter was a mean for X‐ and Y‐bearing haploid genomes, with a higher 1C‐value of approx. 0·198 pg (Mulligan and Rasch, 1980) for X‐bearing haploid genomes. The value of 2·5 pg for 2C chicken that the authors used as a size standard (Rasch et al., 1971; Mulligan and Rasch, 1980) may be approx. 7 % too high, and we estimate 1C for Iso‐1 female is approx. 1–2 % less than that for Oregon R female (see the Appendix, note 3). On this basis, the 1C‐value in female Iso‐1 is minimally approx. 170 Mb if 2C chicken is 2·33 pg, or approx. 190 Mb if 2C chicken is 2·5 pg. Secondly, 21 % of the D. melanogaster genome is simple sequence DNA, which is confined to and comprises most of the pericentric heterochromatin (Brutlag et al., 1977; Hartl and Lozovskaya, 1995). Segments with 18S‐28S and 5S ribosomal RNA (rRNA) account for at least a further 2 % (Ashburner, 1989; Sun et al., 1997), and with 2 % for other repeated sequences, including transposons (Sun et al., 1997), the minimum DNA content for paracentromeric heterochromatin is not less than 25 % of the entire genome in D. melanogaster, agreeing with the results of Laird (1980). So, the 1C‐value in female Iso‐1 is minimally 160 Mb, but higher amounts are possible. Thirdly, for male Oregon R, the area of heterochromatin was 33 % (Gatti et al., 1976), and we estimate its length in mitotic chromosomes of Iso‐1 as 33 % (see the Appendix, note 4). Using 33 % for DNA in the unsequenced segments in heterochromatin for male Iso‐1 gives a minimum C‐value of approx. 180 Mb, provided DNA content per unit length in eu‐ and heterochromatic segments of mitotic chromosomes is constant. All three approaches give minimal C‐values in the range 160–180 Mb, but allow higher values for less conservative assumptions. Whilst the 1C‐value in Iso‐1 male is minimally 160 Mb, it is more likely to be approx. 170 Mb, and could be approx. 190 Mb in the female.
Significantly, our work comparing Iso‐1 directly with C. elegans led to estimated 1C‐values for female drosophila of approx. 175 Mb. This is the first estimate for drosophila made using a standard whose C‐value is known from complete genome sequencing, so it should probably be used in preference to other estimates. It agrees with the previous estimate of 0·18 pg (= 176 Mb) made by Feulgen cytometry (Rasch et al., 1971), supporting the view that careful estimates made by this method are accurate. Clearly the estimate of approx. 180 Mb for drosophila based, in part, on genome sequencing (Adams et al., 2000) was about right.
Was 125 Mb a significant underestimate for the arabidopsis genome?
It remains for us to consider whether the genome size for arabidopsis (125 Mb) given in the Arabidopsis Genome Initiative (2000) is too low. Leaders in the field recently gave higher estimates. In 1999, Somerville and Somerville gave estimates of 130 Mb, and Lin et al. (1999) reported estimates of ‘130–140 Mb’. This suggests that 125 Mb may not be secure, and analysis of the literature reveals independent reasons based on molecular and other data showing that genome size in arabidopsis significantly exceeds 125 Mb.
125 Mb is an estimate rounded down from approx. 130 Mb
The Arabidopsis Genome Initiative paper in 2000 gave genome size in arabidopsis as ‘about 125 Mb’, assuming ‘roughly 10 Mb’ in ‘unsequenced centromeric and rRNA repeat regions’. Yet for chromosomes 1 to 5, unsequenced centromere regions were estimated as: 1·3 Mb (Theologis et al., 2000); 0·83 Mb (Lin et al., 1999); 1·1 Mb (Salanoubat et al., 2000); 1·2 Mb (Mayer et al., 1999); and 1·25 Mb (Tabata et al., 2000), respectively, summing to 5·68 Mb for these gaps. Moreover, the value for chromosome 3 ‘should be considered as a minimum estimate’ (Salanoubat et al., 2000). Nucleolar organizing regions (NORs) on chromosomes 2 and 4 contain 7–8 Mb (Lin et al., 1999; Mayer et al., 1999), giving a minimum total for unsequenced regions of 12·7–13·7 Mb. Added to 115·4 Mb, this gives 128·1–129·1 Mb. Thus, the real estimate of approx. 129 Mb was rounded down to 125 Mb. The value 129 Mb was not given in the Arabidopsis Genome Initiative paper (2000), and 125 Mb is widely cited as the genome size of arabidopsis without qualification. Thus our work uses the 125 Mb AGI estimate (Arabidopsis Genome Initiative, 2000) as the arithmetic baseline for comparisons.
Is the total DNA content of the two arabidopsis NORs approx. 7·3 Mb?
The authors of the 2000 Arabidopsis Genome Initiative paper state: ‘The rRNA repeat regions on chromosome 2 and 4 were not sequenced because of their known repetitive structure and content’, and ‘Both NORs are roughly 3·5–4·0 megabase pairs and comprise ∼350–400 highly methylated rRNA units, each ∼10 kb’ (Arabidopsis Genome Initiative, 2000). This was based on cited work (Copenhaver and Pikaard, 1996) that used RFLP analysis and CHEF gel electrophoresis to measure the absolute size of fragments containing these repeats, and interpreted these data to estimate the NORs on chromosomes 2 and 4 as ‘approximately’ 3·6 and 3·7 Mb, respectively. Apparently the AGI (2000) paper assumed the ‘known’ value of ‘approximately’ 7·3 Mb for the two NORs.
Given the discrepancy between 125 Mb and approx. 157 Mb, it is worth asking if the value of 7·3 Mb for the two NORs could be too small. The cited work (Copenhaver and Pikaard, 1996) emphasized that 7·3 Mb is an estimate based on assumptions. ‘Together, the estimated 730 (± approximately 100) rRNA genes at the two NORs account for approximately 7–8 Mbp (7–8 %) of the approximately 100 Mbp haploid genome’. Size estimates ‘are likely to be accurate to within 15 % of their true values’. Each rDNA unit is approx. 10 520 bp (Gruendler et al., 1989; Unfried et al., 1989; Unfried and Gruendler, 1990), so 730 genes would be approx. 7·7 Mb rather than 7·3 Mb, whilst 830 genes (an extra 15 %) would be 8·7 Mb. The cited work (Copenhaver and Pikaard, 1996) also assumed ‘that fragments were only present as single copies as the density of most [our emphasis] bands was similar’, so extra copies of some fragments were possible. An extra copy of the smallest fragment would raise the total by 50 kb, whilst copies of other fragmants would easily inflate it to 10 Mb. In early work assuming a haploid nuclear genome size of 70 Mb, it was concluded that ‘there are approx. 570 copies of the rDNA repeat per haploid genome’ in arabidopsis (Pruitt and Meyerowitz, 1986). As each rDNA unit is approx. 10 520 bp, the total amount of rDNA was approx. 6·0 Mb (or approx. 8·5 %) per haploid genome. Interestingly, rDNA clones comprised 16 % in a random sample of 50 clones (Pruitt and Meyerowitz, 1986). Thus, it is reasonable to assume that approx. 8·0 % of the nuclear genome is 18S‐25S rDNA but, if this is the case, this gives values of 10 and 12·5 Mb, respectively, for genomes of 125 or 155 Mb, higher than the approx. 7·3 Mb allowed for NORs by the Arabidopsis Genome Initiative (2000). Apparently, this one sequence alone could easily equal or exceed the entire 9·6 Mb allowed in 125 Mb (Arabidopsis Genome Initiative, 2000) for all unsequenced gaps at both NORs and centromeres.
Is the total DNA content of centromeric gaps only approx. 3 Mb?
Analysis of the methods used to estimate the sizes of centromeric gaps, and the recent literature on this, suggest that it too was an underestimate. The Arabidopsis Genome Initiative (2000) paper states: ‘The centromeric regions were not completely sequenced owing to large blocks of monotonic repeats such as 5S rDNA and 180 bp centromeric and other regions of complex sequence’. Sequencing resulted in ‘over 5 Mb of DNA sequence from the centromeric regions’. This borders the centromeric gaps and was included in the 115·4 Mb in contigs. ‘The unsequenced regions of centromeres are composed primarily of long, homogenous arrays that were characterised previously with physical (Round et al., 1997) and genetic mapping (Copenhaver et al., 1999) and contain over 3 Mb of repetitive arrays, including the 180 bp repeats and 5S rDNA.’
Thus, the size of the centromere gaps in the AGI (2000) paper was based largely on cited work (Round et al., 1997) which used RFLP analysis and CHEF gel electrophoresis to measure the sizes of fragments containing 180 bp repeats, and used these to estimate the total sizes of uninterrupted arrays of 180 bp repeats as approx. 3·0 Mb. The Arabidopsis Genome Initiative (2000) paper seems to assume this value of approx. 3 Mb for uninterrupted arrays of 180 bp repeats for all the centromere gaps, approx. 0·5 Mb for 5S rDNA (Campell et al., 1992) and, following Copenhaver et al. (1999), very little for any other regions of complex sequence. If so, there is scope to increase each of these components. First, results presented in Round et al. (1997) allow more than 3 Mb of 180 bp repeats in centromere gaps, as recently noted by Haupt et al. (2001). Secondly, 5S rDNA repeats were estimated to total approx. 0·5 Mb of the genome in arabidopsis, assuming a haploid genome size of 70 Mb (Campell et al., 1992), but this should be higher, or even double, if a haploid genome size of 125 or >140 Mb is assumed. Thirdly, the work by Copenhaver et al. (1999) cited in the AGI (2000) paper did not establish that the gaps constitute less than half of the repetitive elements in centromere regions, but only implied that this was ‘likely’. Together, these factors allow for gaps totalling 5–6 Mb, and summing estimates for such gaps for each chromosome (Lin et al., 1999; Mayer et al., 1999; Salanoubat et al., 2000; Tabata et al., 2000; Theologis et al., 2000) gives approx. 5·68 Mb.
Clearly, there is no fundamental objection to the possibility that centromere gaps may total much more than the approx. 3 Mb actually allowed in the Arabidopsis Genome Initiative (2000) paper, as new estimates of centromere size using integrated approaches show. One (Haupt et al., 2001) estimated the total size of arabidopsis centromeres to be 20·88 Mb, noting that ‘about 9 Mb of the arabidopsis genome representing the centromere core (and additional parts of the pericentromeres) are not sequenced’. Another (Kumekawa et al., 2000) estimated the centromeric region on chromosome 5 as 4·35 Mb, ‘over 2 Mb longer than previously estimated’ (by Copenhaver et al., 1999), noting similar trends for all five chromosomes. Later, the centromeric region of chromosome 4 was reported as approx. 5·3 Mb, ‘over 3 Mb longer than previously estimated by the AGI paper’ (Kumekawa et al., 2001).
The value of 125 Mb (Arabidopsis Genome Initiative, 2000) allows only 2·3 Mb for centromeric gaps, or approx. 0·5 Mb per chromosome. Adding this to the 26·0 Mb of sequenced DNA in chromosome 5 reported in the Arabidopsis Genome Initiative (2000) gives a total estimated DNA content for chromosome 5 of approx. 26·5 Mb. Yet, ‘combining the 4·35 Mb centromeric region with the physical map previously constructed, the entire length of chromosome 5 becomes 31 Mb’ (Kumekawa et al., 2000)—4·5 Mb larger than the 26·5 Mb noted above. Similarly, using 5·3 Mb for its centromeric region, the length of chromosome 4 becomes approx. 25·3 Mb (Kumekawa et al., 2001). This is 3·8 Mb larger than the 21·7 Mb (i.e. 17·5 in contigs, 3·7 in NOR4, and 0·5 in centromeric gaps) allowed in 125 Mb. Such differences, if replicated on all five chromosomes, would account for >20 Mb of DNA in the arabidopsis genome above a 125 Mb baseline (Arabidopsis Genome Initiative, 2000). If there are unclonable regions in centromeres this may further inflate the size of the genome.
Taking 115·4 Mb of sequenced DNA in the ten assembled contigs, but allowing 10–12·0 Mb for rDNA in the two NORs, and an extra 20 Mb for centromeric gaps, gives an estimated total genome size for A. thaliana of approx. 147 Mb, approaching the present estimate of 157 Mb for Columbia based on a comparison with C. elegans, and close to the present estimate (approx. 148 Mb) assuming Iso‐1 is approx. 175 Mb (Fig. 1A).
Estimates of chromosome volume support a genome size in arabidopsis of approx. 180 Mb
Other types of evidence also suggest genome size in arabidopsis is above 125 Mb. Genome size estimates in A. thaliana, including one based on total chromosome volume, have been reviewed as generally supporting molecular estimates of approx. 70 Mb (Leutwiler et al., 1984) or approx. 100 Mb (Galbraith et al., 1991). The work cited used serial section reconstructions of mitotic cells of A. thaliana to estimate that ‘the total volume of the chromosomes at metaphase averages some 4 µm3’ (Heslop‐Harrison and Schwarzacher, 1990). It was noted that ‘. . . there is a correlation between chromosome volume and DNA content [and hence the number of base pairs; Bennett et al., 1983], and the volume of 4 µm3 implies that the genome contains about 100 Mbp, similar to, but slightly larger than, the estimate by reassociation kinetics (Leutwiler et al., 1984)’. However, Bennett et al. (1983) reported that the mean density of DNA in somatic metaphase chromosomes of 14 plant species, including four dicots, was approx. 0·182 pg µm–3. Thus, a volume of ‘some 4 µm3’ for 4C metaphase chromosomes in arabidopsis really implies a 1C‐value of some 0·180 pg (approx. 176 Mb), which is much more than the 70 Mb cited by reassociation kinetics (Leutwiler et al., 1984), or the approx. 100 Mb assumed later (Galbraith et al., 1991), but close to many cytometric estimates in the range 147–191 Mb (Table 1). Total chromosome volume can indeed be a meaningful indicator of genome size, but the available data support an estimate for A. thaliana of approx. 180 Mb much better than that of 125 Mb.
Estimates of % GC content using different methods concur for C. elegans but not for A. thaliana
Complete sequencing of the C. elegans genome shows its GC (guanine and cytosine) content is 35·4 %. As expected, this agrees with the mean estimate of 36 % GC for extracted nuclear DNA made by Sulston and Brenner (1974) using CsCl density gradient centrifugation. A similar comparison for A. thaliana shows disagreement.
The AGI data (2000) gave a GC content of 34·73 % for the 115·4 Mb of sequenced DNA, significantly less than an earlier estimate of 40·3 % GC for arabidopsis nuclear DNA (Marie and Brown, 1993). The GC content of the most common repeat (18S‐25S rDNA) is approx. 51·7 % (Gruendler et al., 1989; Unfried et al., 1989; Unfried and Gruendler, 1990). Genomic DNA with 115·4 Mb (34·73 % GC), 7·3 Mb 18S‐25S rDNA (51·7 % GC), 0·5 Mb 5S RNA (39·70 % GC) and 3 Mb 180 bp highly repeated Arabidopsis thaliana consensus (AtCon) sequence (36·0 % GC) has a mean GC content of only approx. 35·77 %, well below the 40·3 % reported. The estimate of 40·3 % agrees with a second independent estimate (Leutwiler et al., 1984), so the % GC data for arabidopsis may not add up.
Could the difference between a GC content for nuclear DNA of 40·3 %, and that calculated above (approx. 35·8 %) for known DNA sequences reflect contamination of nuclear DNA by chloroplast DNA (Meyerowitz, 1992)? The arabidopsis chloroplast genome has been sequenced (Sato et al., 1999), and its GC content of 36·29 % is close to the GC content of 34·73 % of the 115·4 Mb for sequenced arabidopsis nuclear DNA (Arabidopsis Genome Initiative, 2000), so no amount of contamination by chloroplast DNA would increase the GC content of nuclear DNA above 36·3 %. If correct, the higher GC contents of nuclear DNA (approx. 40·3 %; Marie and Brown, 1993) and whole plant DNA (41·4 %; Leutwiler et al., 1984) might be explained not by contamination by chloroplast DNA, but because the DNA possesses a higher number, or proportion, of repeated sequences with a high % GC in unsequenced gaps, including rDNA (51·7 % GC).
Origins of underestimates in arabidopsis genome size by molecular techniques
Measurements of arabidopsis genome size by molecular means show a clear pattern of increase over time: widely accepted estimates have risen from 70 Mb (Leutwiler et al., 1984) to approx. 100 Mb, and to 125 Mb (Arabidopsis Genome Initiative, 2000). NORs and centromeres show the same trend: the estimated number of rDNA genes rose from approx. 570 in 1986 (Pruitt and Meyerowitz, 1986) to approx. 730 in 1996 (Copenhaver and Pikaard, 1996), whereas the estimated size of the centromere region on chromosome 5 rose from approx. 2 Mb in 1999 (Copenhaver et al., 1999) to 4·35 Mb in 2000 (Kumekawa et al., 2000). In 1986, 180 bp repeats were given as 1 Mb per haploid genome (Martinez‐Zapater et al., 1986), but by 1994 the estimate had risen to 3·5 Mb (Murata et al., 1994). Similarly, in 1995, the retroelement Athila was estimated as 30 copies per haploid arabidopsis genome (Pelissier et al., 1995), but was reported to be 150 copies and ‘still probably under‐estimated’ in 1996 (Pelissier et al., 1996). Estimates of number or size have almost invariably changed upwards. Most work involves assumptions or interpretations made knowing a currently accepted genome size, and is often influenced by it. The number of 5S rDNA genes estimated as approx. 1000 in 1992 (Campell et al., 1992) would have been proportionally higher had the work assumed a genome size of 125 Mb rather than 70 Mb. Our work indicating a C‐value for arabidopsis of approx. 157 Mb may now further this process, provoking reappraisal of how much is still unknown.
Kinetic analysis on total arabidopsis DNA found it to be composed of 10–14 % rapidly annealing sequences, 23–27 % middle repetitive sequences and 50–55 % single or low copy sequences (Leutwiler et al., 1984). Thus, whole plant DNA may contain >41 % high and middle repetitive sequences. It was suggested that most, if not all, of the middle repeated fraction was non‐nuclear chloroplast DNA (Leutwiler et al., 1984). This view, which removed much of the potential nuclear genome from further consideration, was widely accepted, and has influenced the latest genome size estimate of 125 Mb (Arabidopsis Genome Initiative, 2000).
Owing to the ‘inevitable contamination of nuclear DNA with chloroplast DNA, reassociation kinetic estimates of the amount of moderately repetitive DNA in the nuclear genome have not been made’ (Meyerowitz, 1992). Instead, estimates derive from incorrect assumptions, such as underestimating the nuclear genome in arabidopsis as approx. 70 Mb, and overestimating the number of chloroplasts per diploid green cell in arabidopsis as 20–80 (Leutwiler et al., 1984). Cell volume and chloroplast number per diploid cell reflect species DNA C‐value (Butterfass, 1995). Thus, given its tiny nuclear genome, chloroplast number per diploid cell in A. thaliana is expected, and seen, to be very low. Mean chloroplast number per 2C stomatal guard cell in rosette leaves of ten A. thaliana ecotype Columbia plants was 3·67, giving less than two chloroplasts per 1C nuclear genome (T. Butterfass, pers. comm.).
Endopolyploidy reaches 32C in some cells, but their chloroplast : nuclear DNA ratio is not increased. Assuming five chloroplasts, each with 20 chloroplast genomes of 154 kb (Sato et al., 1999), per 1C nuclear genome gives approx. 15 Mb of chloroplast DNA per 172 Mb of cellular DNA (given a nuclear 1C‐value of 157 Mb). On average, cells exceed 6C (Galbraith et al., 1991) due to endopolyploidy. This gives >600 copies of the chloroplast genome per cell, as estimated (Pruitt and Meyerowitz, 1986). If so, chloroplast DNA is only approx. 9 % of cellular DNA, leaving approx. 32 % of cellular DNA (approx. 55 Mb) as high and middle repetitive nuclear DNA sequences (which is approx. 35 % as high and middle repetitive sequences in nuclear DNA). Interestingly, chloroplast clones comprised only 8 % in a random sample of 50 clones (Pruitt and Meyerowitz, 1986).
Consequences of accepting a nuclear genome size >140 Mb for arabidopsis
Given the results presented here, we conclude that 125 Mb (Arabidopsis Genome Initiative, 2000) is a significant underestimate of the arabidopsis genome, and one that does not fit with most estimates of nuclear C‐values or the correct amounts of repeated sequences in arabidopsis. Accepting a nuclear genome size for A. thaliana of 140 Mb or more has important consequences, including new interpretations of its organization from those currently widely accepted. A nuclear genome of ≥140 Mb with 8 % rDNA would contain >1000 copies of the 18S‐25S rDNA genes, which would therefore be among its highly repeated sequences, as implied by C‐band mapping (Schweizer et al., 1988), rather than among its middle repetitive sequences as often stated (Meyerowitz, 1992, 1994; Arabidopsis Genome Initiative, 2000). Moreover, the total amount and proportion of high plus middle repetitive sequences in the nuclear genome must be radically increased from approx. 20 Mb (Meyerowitz, 1992) to approx. 50 Mb, and from approx. 20 % (Meyerowitz, 1992) to approx. 30 %, respectively. The assumption (Leutwiler et al., 1984) that most, or all, of the middle repeat fraction (27 %) of the whole plant arabidopsis DNA is chloroplast DNA is untenable, as this probably comprises only approx. 9 % of whole plant DNA (see above).
Ongoing need for complete sequencing of complex regions of the arabidopsis genome
Accurate DNA C‐value estimates are essential for a full understanding of plant and animal genomes (Bennett et al., 2000a). The Angiosperm DNA C‐values database (Bennett and Leitch, 2001) has C‐values for approx. 3500 species calibrated against chemically determined size standards whose accuracy may affect the entire database (Bennett et al., 2000b). Work to refine these has begun using other methods (Dolezel et al., 1998; Johnston et al., 1999; Bennett et al., 2000b), but exact values from whole genome sequencing would be invaluable. However, genome sequencing becomes more difficult as genome size increases, and experience with arabidopsis implies that exact C‐values are unlikely to be obtained in this way soon for any larger genomes, including the established plant size standard subject to genome sequencing (Oryza sativa), which has a C‐value several fold larger than that of arabidopsis.
In 1997, the Arabidopsis Genome Initiative published its purpose as ‘to sequence the entire arabidopsis genome’ (Arabidopsis Genome Initiative, 1997). The intention to sequence the complex regions was explicit: ‘These approaches are most effective for genome regions that contain predominantly low‐copy sequences. When the majority of these sequences have been determined, a detailed strategy will be devised for sequencing the more complex regions, such as centromeres, which may not be well represented in the existing libraries’ (Arabidopsis Genome Initiative, 1997). Unexpectedly, sequence analysis showed that DNA within centromeres encoded several expressed genes, suggesting that centromeres in arabidopsis ‘may harbour numerous expressed genes that specify important functions’ (Copenhaver et al., 1999). Complete sequencing of the arabidopsis genome until no gaps remain at telomeres, NORs or centromeres, as originally intended, is still needed. Not only would this provide a precise angiosperm C‐value as an invaluable benchmark calibration standard for other plants, but it would also ensure that no important genes have been missed, especially in centromeric gap regions which are clearly larger than previously imagined.
APPENDIX
Note 1. Original C‐value estimates for Arabidopsis thaliana by molecular and other methods, and recalculation of some estimates using modern sequence data
Molecular methods.
DNA reassociation analysis originally showed a genome size of around 70 Mb for arabidopsis (Leutwiler et al., 1984), which was the mid‐point of values ranging from 54 to 83 Mb, based on an assumed genome size of 4·1 Mb for Escherichia coli, the kinetic standard used for the reassociation calculations. Complete sequencing has shown that the genome of E. coli K‐12 is 4·64 Mb (Blattner et al., 1997). So, the range of measurements should now be considered as approx. 55–105 Mb, with a mid‐point of approx. 80 Mb (Meyerowitz, 1994). Quantitative gel blot hybridization gave a genome size of approx. 50 Mb (Francis et al., 1990). Thus, the different molecular techniques gave values from 50–105 Mb, all lower than the cytochemical estimates (Table 1).
Feulgen microdensitometry.
In 1972, Bennett estimated the 3C‐value of Arabidopsis thaliana growing as a weed as 0·8 pg (Bennett, 1972), later recalibrated as 4C = 0·9 pg (Bennett and Smith, 1976). A more accurate value for A. thaliana ecotype Columbia (0·71 pg, but rounded down for publication to 0·7 pg), based on a larger sample of nuclei and using a more suitable calibration standard (Vigna radiata ‘Berken’, 4C = 2·12 pg) was published in 1991 (Bennett and Smith, 1991).
Recently, Krisai and Greilhuber (1997) estimated the 1C‐value for A. thaliana ecotype Columbia as 0·167 pg, using two well‐established plant calibration standards (Table 1). Thus, the mean estimate for arabidopsis in recent years made by Feulgen cytochemistry is 1C = 0·172 pg (168·8 Mb). Cytochemical values exceed both the range of values (50–150 Mb) acknowledged in the Arabidopsis Genome Initiative (2000) and all published estimates made by molecular techniques prior to sequencing listed in Meyerowitz (1994) (Table 1).
Flow cytometry.
Four groups have used flow cytometry (FC) to estimate DNA amounts in arabidopsis (Table 1). Galbraith et al. (1991) gave a haploid genome size of 0·095 pg = 93 Mb using diploid Saccharomyces cerevisiae with an assumed 1C‐value of 15 Mb as a size standard. This is now known to be 13·39 Mb from genome sequencing (Goffeau et al., 1996), giving a lower value of approx. 83 Mb for arabidopsis. Using hen erythrocytes as a size standard (2C = 2·33 pg), they also gave C‐values of 0·16–0·17 pg for arabidopsis using three base‐specific fluorochromes (Galbraith et al., 1991). The non‐base specific fluorochrome, PI, was used in the other studies. Arumuganathan and Earle (1991) gave 1C = 0·150 pg (145 Mb) using 1 pg = 965 Mb after Strauss (1971). The more accurate 1 pg = 980 Mb (Cavalier‐Smith, 1985) gives 147·0 Mb (Table 1), closer to 1C = 0·165 pg given by Marie and Brown (1993) who also used hen erythrocytes as calibration standard. Recently, Dolezel et al. (1998) gave values of 191·1 and 181·3 Mb using plant size standards (Table 1). Thus, only one FC estimate (83 Mb) based on yeast was in the range 50–105 Mb obtained by molecular techniques, now known from sequencing data to be too low. Seven other estimates in the range 147·0–191·1 Mb were all similar to the range of values obtained by cytochemistry (Table 1).
As the 1C estimate for arabidopsis calculated by Galbraith et al. (1991) using yeast as a calibration standard is only about half that of the estimates obtained by themselves and other workers using flow cytometry and different calibration standards, it seemed worthwhile to ask whether the ploidy level (or C‐value) of the yeast used by Galbraith et al. (1991) might have been only half (haploid or 2C) that assumed (diploid or 4C). Galbraith (pers. comm.) recently confirmed that ‘it does seem possible that the yeast may have been the ‘wrong’ ploidy level’ based on the following information from the original supplier: ‘Yes, it is possible to have had a yeast culture that was haploid and if grown to saturation had a 1C DNA content. It is also possible to have grown the diploid sporulate, generating haploids that give rise to the 1C DNA content . . . It is also possible to have had a diploid, and for some reason to have them arrested in mitosis, in which case they were 4C.’ Thus, either way, if the value assumed by Galbraith et al. (1991) for the yeast calibration standard was indeed only half what it should have been, then the real 1C‐value for arabidopsis would have been 167 Mb (or 0·17 pg), which agrees very well both with previously reported values and our present work (see Table 1).
Note 2. Original C‐value estimates for Gallus domesticus
Rasch et al. (1971) used 28 cited measurements of 2C DNA in chicken, ranging from 2·39 to 2·49 pg (mean 2·44 pg). Four estimates based on erythrocytes alone, plus their own chemical determination, gave the size standard of 2C = 2·5 pg. Recent estimates are: 2C = 2·46 pg (Nakamura et al., 1990), 2·48 pg (Tiersch and Wachtel, 1991) and 2·5 pg (Tiersch et al., 1989; De Vita et al., 1994). Zoologists use 2C‐values for hen or rooster in the range 2·46–2·55 pg, and commonly use 2C = 2·5 pg as size standard for CRBC without noting the chicken’s sex. Galbraith et al. (1983) chemically estimated the 2C DNA content of chicken to be 2·33 pg, and plant scientists tend to use this value (Marie and Brown, 1993), but the weight of data favours 2·5 pg. Most estimates for CRBC are in the range 2·33–2·5 pg.
Note 3. Original C‐value estimates for Drosophila melanogaster
Most estimates of C‐value in Drosophila melanogaster made by chemical or cytochemical means are in the range 0·16–0·18 pg. A few early estimates for drosophila were about half this amount (Kurnick and Herskowitz, 1952), but it is widely accepted that the later value published by Rasch et al. (Rasch et al., 1971; Mulligan and Rasch, 1980), made using improved techniques, is more correct. Besides, the total amount of euchromatic DNA sequenced in drosophila (approx. 120 Mb) alone exceeds the early low estimates, so their inaccuracy is now beyond doubt. C‐values can vary between sexes and strains owing to differences between X‐ and Y‐chromosomes, and between amounts of heterochromatin on X‐chromosomes of different strains (Adams et al., 2000). Rasch et al. (1971) used Feulgen microdensitometry and hen erythrocyte nuclei as size standard [assuming a diploid cell (2C) contained 2·5 pg] to estimate that the mean haploid genome of D. melanogaster strain Oregon R was approx. 0·18 pg for X‐ or Y‐bearing sperm nuclei, but higher (approx. 0·198 pg) in females (Mulligan and Rasch, 1980) with no Y‐chromosome. Later plant scientists used a 2C‐value of 2·33 pg (Galbraith et al., 1983) for hen erythrocytes, but zoologists commonly use approx. 2·5 pg (Rasch et al., 1971). The former gives a mean C‐value of 0·168 pg (164·4 Mb) for male Oregon R, or approx. 0·185 pg (181·3 Mb) for female (using 1 pg = 980 Mb; Cavalier‐Smith, 1985). We compared Iso‐1 and Oregon R females against Apis melifera. Iso‐1 was approx. 1–2 % lower than Oregon R, but we were unable to distinguish separate 2C peaks for co‐stained mixtures of nuclei from Oregon R and Iso‐1 females, confirming that their genome sizes are very similar. On this basis, the 1C‐value of Iso‐1 female is approx. 0·180 pg (approx. 176·4 Mb) if hen 2C = 2·33 pg, but approx. 0·193 pg (approx. 189·1 Mb) if hen 2C = 2·5 pg.
Note 4. Estimating relative length of heterochromatic segments in D. melanogaster
Brains of Iso‐1 larvae dissected in 0·7 % NaCl were fixed in 45 % acetic acid and squashed on microscope slides. After removing coverslips by freezing, slides were dehydrated in ethanol, air‐dried, stained in 2 % Azure A solution for 2 min, and made permanent. The mean proportion of the total mitotic chromosome length in heterochromatic segments was approx. 33 % in ten XX cells.
Supplementary Material
Received: 29 November 2002; Returned for revision: 23 December 2002; Accepted 2 January 2003 Published electronically: 20 February 2003
References
- AdamsMD, Celniker SE, Holt RA, Evans CA, Gocayne JD, Amanatides PG, Scherer SE, Li PW, Hoskins RA, Galle RF et al 2000. The genome sequence of Drosophila melanogaster Science 287: 2185–2195. [DOI] [PubMed] [Google Scholar]
- Arabidopsis Genome Initiative.1997. Objective: the complete sequence of a plant genome. Plant Cell 9: 476–478. [DOI] [PMC free article] [PubMed] [Google Scholar]
- Arabidopsis Genome Initiative.2000. Analysis of the genome sequence of the flowering plant Arabidopsis thaliana Nature 408: 796–815. [DOI] [PubMed] [Google Scholar]
- ArumuganathanK, Earle ED.1991. Nuclear DNA content of some important plant species. Plant Molecular Biology Reporter 9: 208–218. [Google Scholar]
- AshburnerM.1989. Drosophila: a laboratory handbook. New York: Cold Spring Harbor Laboratory Press. [Google Scholar]
- BennettMD.1972. Nuclear DNA content and minimum generation time in herbaceous plants. Proceedings of the Royal Society of London Series B – Biological Sciences 181: 109–135. [DOI] [PubMed] [Google Scholar]
- BennettMD, Leitch IJ.2001. Angiosperm DNA C‐values database (release 3.1, Sept. 2001). http://www.rbgkew.org.uk/cval/homepage.html [Google Scholar]
- BennettMD, Smith JB.1976. Nuclear DNA amounts in angiosperms. Philosophical Transactions of the Royal Society of London Series B – Biological Sciences 274: 227–274. [DOI] [PubMed] [Google Scholar]
- BennettMD, Smith JB.1991. Nuclear DNA amounts in angiosperms. Philosophical Transactions of the Royal Society of London Series B –Biological Sciences 334: 309–345. [DOI] [PubMed] [Google Scholar]
- BennettMD, Bhandol P, Leitch IJ.2000a Nuclear DNA amounts in angiosperms and their modern uses—807 new estimates. Annals of Botany 86: 859–909. [Google Scholar]
- BennettMD, Heslop‐Harrison JS, Smith JB, Ward JP.1983. DNA density in mitotic and meiotic metaphase chromosomes of plants and animals. Journal of Cell Science 63: 173–179. [DOI] [PubMed] [Google Scholar]
- BennettMD, Johnston S, Hodnett GL, Price HJ.2000b Allium cepa L. cultivars from four continents compared by flow cytometry show nuclear DNA constancy. Annals of Botany 85: 351–357. [Google Scholar]
- BlattnerFR, Plunkett G, Bloch CA, Perna NT, Burland V, Riley M, Collado‐Vides J, Glasner JD, Rode CK, Mayhew GF et al 1997. The complete genome sequence of Escherichia coli K‐12. Science 277: 1453–1462. [DOI] [PubMed] [Google Scholar]
- BorkP, Copley R.2001. The draft sequences—filling in the gaps. Nature 409: 818–820. [DOI] [PubMed] [Google Scholar]
- BrennerS.1974. Genetics of Caenorhabditis elegans Genetics 77: 71–94. [DOI] [PMC free article] [PubMed] [Google Scholar]
- BrilesWE, Briles RW.1982. Identification of haplotypes of the chicken major histocompatibility complex (B). Immunogenetics 15: 449–459. [DOI] [PubMed] [Google Scholar]
- BrutlagD, Appels R, Dennis ES, Peacock WJ.1977. Highly repeated DNA in Drosophila melanogaster Journal of Molecular Biology 112: 31–47. [DOI] [PubMed] [Google Scholar]
- ButterfassT.1995. Reproduction and continuity of chloroplasts in spermatophytes. Botanical Review 61: 1–27. [Google Scholar]
- CampellBR, Song YG, Posch TE, Cullis CA, Town CD.1992. Sequence and organization of 5S ribosomal RNA encoding genes of Arabidopsis thaliana Gene 112: 225–228. [DOI] [PubMed] [Google Scholar]
- Cavalier‐SmithT.1985. The evolution of genome size. Chichester: John Wiley & Sons Ltd. [Google Scholar]
- C. elegans Sequencing Consortium.1998. Genome sequence of the nematode C. elegans: a platform for investigating biology. Science 282: 2012–2018. [DOI] [PubMed] [Google Scholar]
- CopenhaverGP, Pikaard CS.1996. Two‐dimensional RFLP analyses reveal megabase‐sized clusters of rRNA gene variants in Arabidopsis thaliana, suggesting local spreading of variants as the mode for gene homogenization during concerted evolution. Plant Journal 9: 273–282. [DOI] [PubMed] [Google Scholar]
- CopenhaverGP, Nickel K, Kuromori T, Benito Ml, Kaul S, Lin XY, Bevan M, Murphy G, Harris B, Parnell LD et al 1999. Genetic definition and sequence analysis of Arabidopsis centromeres. Science 286: 2468–2474. [DOI] [PubMed] [Google Scholar]
- De VitaR, Cavallo D, Eleuteri P, Dellomo G.1994. Evaluation of interspecific DNA content variations and sex identification in falconiformes and strigiformes by flow cytometric analysis. Cytometry 16: 346–350. [DOI] [PubMed] [Google Scholar]
- DolezelJ, Greilhuber J, Lucretti S, Meister A, Lysak MA, Nardi L, Obermayer R.1998. Plant genome size estimation by flow cytometry: inter‐laboratory comparison. Annals of Botany 82 (Suppl. A): 17–26. [Google Scholar]
- FrancisDM, Hulbert SH, Michelmore RW.1990. Genome size and complexity of the obligate fungal pathogen, Bremia lactucae Experimental Mycology 14: 299–309. [Google Scholar]
- GalbraithDW, Harkins KR, Knapp S.1991. Systemic endopolyploidy in Arabidopsis thaliana Plant Physiology 96: 985–989. [DOI] [PMC free article] [PubMed] [Google Scholar]
- GalbraithDW, Harkins KR, Maddox JM, Ayres NM, Sharma DP, Firoozabady E.1983. Rapid flow cytometric analysis of the cell cycle in intact plant tissues. Science 220: 1049–1051. [DOI] [PubMed] [Google Scholar]
- GattiM, Pimpinelli S, Santini G.1976. Characterization of Drosophila heterochromatin. 1. Staining and decondensation with Hoechst‐33258 and Quinacrine. Chromosoma 57: 351–375. [DOI] [PubMed] [Google Scholar]
- GoffeauA, Barrell BG, Bussey H, Davis RW, Dujon B, Feldmann H, Galibert F, Hoheisel JD, Jacq C, Johnston M et al 1996. Life with 6000 genes. Science 274: 546–567. [DOI] [PubMed] [Google Scholar]
- GruendlerP, Unfried I, Pointner R, Schweizer D.1989. Nucleotide sequence of the 25S‐18S ribosomal gene spacer from Arabidopsis thaliana Nucleic Acids Research 17: 6395–6396. [DOI] [PMC free article] [PubMed] [Google Scholar]
- HartlDL, Lozovskaya ER.1995. The Drosophila genome map: a practical guide. Austin, Texas: R. G. Landes Company. [Google Scholar]
- HauptW, Fischer TC, Winderl S, Fransz P, Torres‐Ruiz RA.2001. The CENTROMERE1 (CEN1) region of Arabidopsis thaliana: architecture and functional impact of chromatin. Plant Journal 27: 285–296. [DOI] [PubMed] [Google Scholar]
- Heslop‐HarrisonJS, Schwarzacher T.1990. The ultrastructure of Arabidopsis thaliana chromosomes. In: Schweizer D, Peuker K, Loidl J, eds. Fourth International Conference on Arabidopsis Research, June 2–5, 1990, Vienna, Abstracts. Vienna, Institute of Botany, 3. [Google Scholar]
- JohnstonJS, Bennett MD, Rayburn AL, Galbraith DW, Price HJ.1999. Reference standards for determination of DNA content of plant nuclei. American Journal of Botany 86: 609–613. [PubMed] [Google Scholar]
- JonesRN, Rees H.1982. B chromosomes. London: Academic Press. [Google Scholar]
- KrisaiR, Greilhuber J.1997. Cochlearia pyrenaica DC. das Löffelkraut, in Oberöstererreich (mit Anmerkungen zur Karyologie und zur Genomgrösse). Beiträge zur Naturkunde Oberösterreichs 5: 151–160. [Google Scholar]
- KumekawaN, Hosouchi T, Tsuruoka H, Kotani H.2000. The size and sequence organization of the centromeric region of Arabidopsis thaliana chromosome 5. DNA Research 7: 315–321. [DOI] [PubMed] [Google Scholar]
- KumekawaN, Hosouchi T, Tsuruoka H, Kotani H.2001. The size and sequence organization of the centromeric region of Arabidopsis thaliana chromosome 4. DNA Research 8: 285–290. [DOI] [PubMed] [Google Scholar]
- KurnickNB, Herskowitz IH.1952. The estimation of polyteny in Drosophila salivary gland nuclei based on determination of desoxyribonucleic acid content. Journal of Cellular and Comparative Physiology 39: 281–299. [DOI] [PubMed] [Google Scholar]
- LairdCD.1980. Structural paradox of polytene chromosomes. Cell 22: 869–874. [DOI] [PubMed] [Google Scholar]
- LeutwilerLS, Hough‐Evans BR, Meyerowitz EM.1984. The DNA of Arabidopsis thaliana Molecular and General Genetics 194: 15–23. [Google Scholar]
- LinXY, Kaul SS, Rounsley S, Shea TP, Benito MI, Town CD, Fujii CY, Mason T, Bowman CL, Barnstead M et al 1999. Sequence and analysis of chromosome 2 of the plant Arabidopsis thaliana Nature 402: 761–768. [DOI] [PubMed] [Google Scholar]
- MarieD, Brown SC.1993. A cytometric exercise in plant DNA histograms, with 2C values for 70 species. Biology of the Cell 78: 41–51. [DOI] [PubMed] [Google Scholar]
- Martinez‐ZapaterJM, Estelle MA, Somerville CR.1986. A highly repeated DNA sequence in Arabidopsis thaliana Molecular and General Genetics 204: 417–423. [Google Scholar]
- MayerK, Schuller C, Wambutt R, Murphy G, Volckaert G, Pohl T, Dusterhoft A, Stiekema W, Entian KD, Terryn N et al 1999. Sequence and analysis of chromosome 4 of the plant Arabidopsis thaliana Nature 402: 769–776. [DOI] [PubMed] [Google Scholar]
- MeyerowitzEM.1992. Introduction to the Arabidopsis genome. In: Koncz C, Chua N, Schell J eds. Methods in arabidopsis research Singapore: World Scientific Publishing, 100–118. [Google Scholar]
- MeyerowitzEM.1994. Structure and organization of the Arabidopsis thaliana nuclear genome. In: Meyerowitz EM, Somerville CR, eds. Arabidopsis New York: Cold Spring Harbor Laboratory Press, 21–36. [Google Scholar]
- MulliganPK, Rasch EM.1980. The determination of genome size in male and female germ cells of Drosophila melanogaster by DNA Feulgen cytophotometry. Histochemistry 66: 11–18. [DOI] [PubMed] [Google Scholar]
- MurataM, Ogura Y, Motoyoshi F.1994. Centromeric repetitive sequences in Arabidopsis thaliana Japanese Journal of Genetics 69: 361–370. [DOI] [PubMed] [Google Scholar]
- NakamuraD, Tiersch TR, Douglass M, Chandler RW.1990. Rapid identification of sex in birds by flow cytometry. Cytogenetics and Cell Genetics 53: 201–205. [DOI] [PubMed] [Google Scholar]
- PelissierT, Tutois S, Tourmente S, Deragon JM, Picard G.1996. DNA regions flanking the major Arabidopsis thaliana satellite are principally enriched in Athila retroelement sequences. Genetica 97: 141–151. [DOI] [PubMed] [Google Scholar]
- PelissierT, Tutois S, Deragon JM, Tourmente S, Genestier S, Picard G.1995. Athila, a new retroelement from Arabidopsis thaliana Plant Molecular Biology 29: 441–452. [DOI] [PubMed] [Google Scholar]
- PruittRE, Meyerowitz EM.1986. Characterization of the genome of Arabidopsis thaliana Journal of Molecular Biology 187: 169–183. [DOI] [PubMed] [Google Scholar]
- RaschEM, Barr HJ, Rasch RW.1971. DNA content of sperm of Drosophila melanogaster Chromosoma 33: 1–18. [DOI] [PubMed] [Google Scholar]
- RonemusMJ, Galbiati M, Ticknor C, Chen JC, Dellaporta SL.1996. Demethylation‐induced developmental pleiotropy in Arabidopsis Science 273: 654–657. [DOI] [PubMed] [Google Scholar]
- RoundEK, Flowers SK, Richards EJ.1997. Arabidopsis thaliana centromere regions: genetic map positions and repetitive DNA structure. Genome Research 7: 1045–1053. [DOI] [PubMed] [Google Scholar]
- SalanoubatM, Lemcke K, Rieger M, Ansorge W, Unseld M, Fartmann B, Valle G, Blocker H, Perez‐Alonso M, Obermaier B et al 2000. Sequence and analysis of chromosome 3 of the plant Arabidopsis thaliana Nature 408: 820–822. [DOI] [PubMed] [Google Scholar]
- SatoS, Nakamura Y, Kaneko T, Asamizu E, Tabata S.1999. Complete structure of the chloroplast genome of Arabidopsis thaliana DNA Research 6: 283–290. [DOI] [PubMed] [Google Scholar]
- SchweizerD, Ambros P, Gründler P, Varga F.1988. Attempts to relate cytological and molecular chromosome data of Arabidopsis thaliana to its genetic linkage map. Arabidopsis Information Service 25: 27–34. [Google Scholar]
- SeoSH, Pei JW, Briles WE, Dzielawa J, Collisson EW.2000. Adoptive transfer of infectious bronchitis virus primed alpha beta T cells bearing CD8 antigen protects chicks from acute infection. Virology 269: 183–189. [DOI] [PMC free article] [PubMed] [Google Scholar]
- SomervilleC, Somerville S.1999. Plant functional genomics. Science 285: 380–383. [DOI] [PubMed] [Google Scholar]
- StraussNA.1971. Comparative DNA renaturation kinetics in amphibians. Proceedings of the National Academy of Sciences of the USA 68: 799–802. [DOI] [PMC free article] [PubMed] [Google Scholar]
- SulstonJE, Brenner S.1974. DNA of Caenorhabditis elegans Genetics 77: 95–104. [DOI] [PMC free article] [PubMed] [Google Scholar]
- SunXP, Wahlstrom J, Karpen G.1997. Molecular structure of a functional Drosophila centromere. Cell 91: 1007–1019. [DOI] [PMC free article] [PubMed] [Google Scholar]
- TabataS, Kaneko T, Nakamura Y, Kotani H, Kato T, Asamizu E, Miyajima N, Sasamoto S, Kimura T, Hosouchi T et al 2000. Sequence and analysis of chromosome 5 of the plant Arabidopsis thaliana Nature 408: 823–826. [DOI] [PubMed] [Google Scholar]
- TheologisA, Ecker JR, Palm CJ, Federspiel NA, Kaul S, White O, Alonso J, Altafi H, Araujo R, Bowman CL et al 2000. Sequence and analysis of chromosome 1 of the plant Arabidopsis thaliana Nature 408: 816–820. [DOI] [PubMed] [Google Scholar]
- TierschTR, Wachtel SS.1991. On the evolution of genome size of birds. Journal of Heredity 82: 363–368. [DOI] [PubMed] [Google Scholar]
- TierschTR, Chandler RW, Wachtel SS, Elias S.1989. Reference standards for flow cytometry and application in comparative studies of nuclear DNA content. Cytometry 10: 706–710. [DOI] [PubMed] [Google Scholar]
- UnfriedI, Gruendler P.1990. Nucleotide sequence of the 5·8S and 25S ribosomal‐RNA genes and of the internal transcribed spacers from Arabidopsis thaliana Nucleic Acids Research 18: 4011–4011. [DOI] [PMC free article] [PubMed] [Google Scholar]
- UnfriedI, Stocker U, Gruendler P.1989. Nucleotide sequence of the 18S ribosomal‐RNA gene from Arabidopsis thaliana Col0. Nucleic Acids Research 17: 7513–7515. [DOI] [PMC free article] [PubMed] [Google Scholar]
- VanyushiBF, Mazin AL, Vasilyev VK, Belozers AN.1973. Content of 5‐methylcytosine in animal DNA—species and tissue specificity. Biochimica et Biophysica Acta 299: 397–403. [DOI] [PubMed] [Google Scholar]
- VongsA, Kakutani T, Martienssen RA, Richards EJ.1993. Arabidopsis thaliana DNA methylation mutants. Science 260: 1926–1928. [DOI] [PubMed] [Google Scholar]
- YamamotoM‐T, Mitchelson A, Tudor M, Ohare K, Davies JA, Miklos GLG.1990. Molecular and cytogenetic analysis of the heterochromatin‐euchromatin junction region of the Drosophila melanogaster X‐chromosome using cloned DNA sequences. Genetics 125: 821–832. [DOI] [PMC free article] [PubMed] [Google Scholar]
Associated Data
This section collects any data citations, data availability statements, or supplementary materials included in this article.