

Abstract
• Background and Aims Tea plants (Camellia sinensis L.) accumulate large amounts of fluoride (F) from soils containing normal F concentrations. The present experiments examined the effects of pH and Ca on F uptake by this accumulating plant species.
• Methods The effect of pH was assessed in two experiments, one using uptake solutions with different pHs, and the other using lime, as CaO, applied to the soil. The effect of Ca was examined by analysing F concentrations in plants supplied with varying amounts of Ca, as Ca(NO3)2, either in uptake solutions or through the soil.
• Key results F uptake was highest at solution pH 5·5, and significantly lower at pH 4·0. In the soil experiment, leaf F decreased linearly with the amounts of lime, which raised the soil pH progressively from 4·32 to 4·91, 5·43, 5·89 and, finally, 6·55. Liming increased the water‐soluble F content of the soil. Including Ca in the uptake solution or adding Ca to soil significantly decreased leaf F concentrations. The distribution pattern of F in tea plants was not altered by Ca treatment, with most F being allocated to leaves. The activity of F– in the uptake solution was unaffected and water‐soluble F in the soil was sometimes increased by added Ca.
• Conclusions F uptake by tea plants, which are inherently able to accumulate large quantities of F, was affected both by pH and by Ca levels in the medium. The reduced F uptake following Ca application appeared not to be due simply to the precipitation of CaF2 in solution and soil or to the complexing of Ca and F in roots, although these factors cannot be dismissed. It was more likely due to the effect of Ca on the properties of cell wall or membrane permeability in the solution experiments, and to alteration of F speciations and their quantities in soil solutions following Ca application.
Key words: Calcium, Camellia sinensis, fluoride, liming, pH, tea, uptake
INTRODUCTION
Fluoride (F) is an essential element to mammals, a small amount helping bone development. For humans, one of the important dietary sources of F is tea, which contains relatively high concentrations that are released during infusion (Rao, 1984). Ingestion of F from drinking teas containing normal F concentrations has been considered safe and was seen as a way of protecting against tooth decay (Fung et al., 1999; Simpson et al., 2001). However, some investigations have revealed that drinking some special teas (e.g. brick tea) containing extremely high F concentrations, or excessive daily consumption of other teas has resulted in the over‐intake of F and fluorosis in severe cases (Bilbeissi et al., 1988; Cao et al., 1997). Therefore, reducing F uptake by tea plants and consequently its levels in tea products has become important when high F concentrations in tea constitute a hazard to human health.
To most plants, F is phytotoxic through influencing a series of metabolic pathways (Miller, 1993). Less than 10 mg kg–1 F is usually found in plants growing in F‐uncontaminated soils (Davison et al., 1985). However, tea plants are capable of accumulating large amounts of F in their mature leaves when grown on soils containing normal F concentrations, without showing toxicity symptoms (Yumada and Hattori, 1977; Ruan and Wong, 2001; Xie et al., 2001). No experimental evidence has shown the biological functions of F in tea plants (Ruan and Fang, 1981), although some experiments have demonstrated that F reduces the toxicity of aluminium (Al) on pollen tube growth (Konishi and Miyamoto, 1983). Many studies have been conducted to investigate F concentrations in both tea plants and made teas, and have shown that tea products from younger shoots contain less F (e.g. Fung et al., 1999; Ruan and Wong, 2001). A recent study has shown that F uptake by tea plants was linearly correlated to the external F concentrations and that the F taken up was readily transported, in particular to the leaves (Ruan et al., 2003), leading to a considerably higher F concentration in mature or old leaves than in other organs (Fung et al., 1999; Ruan and Wong, 2001).
Solution culture experiments have shown that F uptake by plants is usually linearly correlated with total F– activity in solution (Stevens et al., 1998a) and, more importantly, that F uptake was strongly influenced by F– speciations in the solution (Stevens et al., 1998a). It was shown that F, as HF, was taken up more readily than F– and Al–F species (Stevens et al., 1998a). The chemical equilibrium of F– and HF in solution depends upon the solution pH. Arnesen (1997) also found that the F concentration in soil‐cultivated plants was better explained by soluble F in the soil together with the pH than by soluble F alone. Tea plants grow well on acidic soil, but the effect of pH on their uptake of F has not been studied before. Plant uptake of F is influenced by other elements, such as Al and boron (B). The supply of Al in either nutrient solution or soil has been shown to increase F uptake by tea and other plant species (Takmaz‐Nisancioglu and Davison, 1988; Stevens et al., 1997; Ruan et al., 2003). In xylem, F is transported as Al–F complexes and disassociates after reaching the leaves (Nagata et al., 1993). The absorption of both B and F in tomato and oats was considerably increased in the presence of the negatively charged BF4– ion in solution compared with similar activity of F– (Stevens et al., 1998b). It has often been observed that the uptake of calcium (Ca) is inhibited by F, hence the complexing of F with Ca has been proposed as a mechanism underlying F toxicity in plants (Arnesen, 1997; Stevens et al., 1998a). However, the effect of Ca on F uptake by plants has not been fully investigated (Stevens et al., 1998a). The objectives of this study were, therefore, to investigate the effects of pH and Ca in solution or soil on the uptake of F by tea plants.
MATERIALS AND METHODS
Experiment 1
Tea seeds were germinated in river sand at room temperature (20–25 °C). At the four‐to‐five‐leaf stage, uniform seedlings were selected for the uptake experiments and the cotyledons removed. A simple uptake solution containing 105 µmol L–1 F– as NH4F was prepared with de‐ionized water. Other nutrients (e.g. Ca and Mg) were not included to avoid any possible masking of effects. The original pH of the solution was 5·9 at a room temperature of 20–25 °C. It was adjusted to 4·0, 4·5, 5·0 and 5·5 by the addition of 0·1 mol L–1 HNO3. Each pot contained 1·5 L of aerated solution and three plants. After 48 h, plants were sampled, separated into roots, leaves and stems, oven‐dried, and ground for F determination. There were three replicates of each pH treatment.
Experiment 2
The effect of pH on F uptake by tea plants was also investigated in a soil experiment. The soil, taken from a tea field, had these properties: pH, 4·32; organic matter, 23·1 g kg–1; exchangeable Ca, 410 mg kg–1; water‐soluble F, 0·04 mg kg–1. The soil was air‐dried, passed through a 5 mm sieve, then mixed thoroughly with CaO at 0, 1·05, 1·65, 2·15 and 2·70 g kg–1 to correspond to soil pH values of 4·32, 4·91, 5·43, 5·89 and 6·55, respectively. The soils were stored for 2 weeks before the experiment was started. Each pot was filled with 2 kg soil and sown with 15 tea seeds in late October. After germination, each pot was thinned to ten relatively uniform seedlings. There were five replicates of each CaO treatment. The plants were grown outdoors and watered when necessary. In late June, plants were sampled, separated into roots, stems and leaves, and oven‐dried. Soil samples were air‐dried then passed through a 1‐mm sieve for further analysis.
Experiment 3
This experiment was designed to investigate the effect of Ca in solution on F uptake by tea plants. The tea plants were cultivated and treated as in expt 1. The uptake solutions contained F as NH4F at 52·6 µmol L–1 and were supplemented by a series of Ca concentrations at 0, 12·5, 25·0, 50·0, and 125·0 µmol L–1. The Ca was supplied as Ca(NO3)2. Additional NH4NO3 was included to match the total N concentrations (NH4+ and NO3–) of the uptake solutions. There were three replicates of each Ca concentration. After 22 h, plants were sampled and dried for F and other element determinations. The experiment was repeated under similar conditions but with F concentrations of 105·2 µmol L–1 in the solution and the uptake duration extended to 72 h.
Experiment 4
This experiment was conducted to investigate the effect of Ca on F uptake by tea plants grown in soil. Each pot was filled with 5·5 kg of air‐dried soil taken from a tea field and planted with four 1‐year‐old rooted cuttings. After 2 years of growth without fertilization, pots containing uniform plants were selected for the experiment. The treatments were control (no additional F) or 30 mg kg–1 F as NH4F, in combination with three levels of Ca at 0, 100 and 500 mg kg–1 as Ca(NO3)2, arranged in a completely randomized design. Additional NH4NO3 was applied so that all treatments received an identical amount of N (0·37 g kg–1). Ca, F and NH4NO3 were applied twice in July, with a 1‐week interval between each application. All treatments were replicated three times. The plants were grown outdoors and watered when necessary. Thirty days after treatment, samples of leaves and young shoots were taken. Leaves were taken from similar positions on branches so that they were of the same developmental age. Samples of young shoots consisted of one bud and three leaves, which represented the crop usually harvested for summer green‐tea production. Plant samples were oven‐dried at 60 °C and ground for element analysis. Soil samples were air dried and passed through a 1‐mm sieve for further analysis.
Analyses
For F determinations, plant samples (0·2–0·5 g) were digested with 5 mL concentrated HNO3 in a microwave digestion unit equipped with a temperature control system (Model Mars 5, CEM Corporation, Matthews, USA) and measured with a fluoride ion selective electrode (F‐ISE) as previously used by Stevens et al. (1995), but with modifications. After cold digestion in the sealed vessels for one night, the samples were digested at 120 °C as described by Keerthisinghe et al. (1991), for 20 min. The digest solutions were diluted with deionized water and a 5‐mL aliquot was added to 20 mL 1·5 mol L–1 trisodium citrate (pH 5·25) for millivolt potential measurements. Concentrations of Ca, potassium (K), Mg and Al in the remaining digest solution were determined using an Induced Couple Plasma–Atomic Emission Spectrometer (ICP–AES). Soil water‐soluble F was determined as described by Frankenberger et al. (1996). Fifty grams of air‐dried soil was shaken with 50 ml deionized water, filtered, and measured with an F‐ISE with a total ionic strength adjustment buffer (TISAB) (1 : 1). The detection limit of the F‐ISE was approx. 0·02 µg mL–1. Soil pH was measured in 1 : 1 water paste. The exchangeable cations Ca, K and Mg were extracted with 1 mol L–1 ammonium acetate (pH 7) at a soil to solution ratio of 1 : 10. Labile Al was extracted with 0·02 mol L–1 CaCl2 for 30 min as Dong et al. (1999) have shown that this procedure provides a good prediction of Al concentrations in tea leaves. Elements in soil extracts were measured using an ICP–AES. The experimental data were subjected to one‐ or two‐way analysis of variance (ANOVA) to examine the effects of treatments on various dependent variables. Fisher’s least significant difference (l.s.d.) test was used to determine whether or not treatment means differed significantly (P < 0·05). Pearson’s product moment correlation was performed to calculate correlation coefficients.
RESULTS
Effects of uptake solution pH on F concentrations in tea plants (expt 1)
Leaf F concentrations were highest when the solution pH was 5·5, and significantly lower when it was 4·0 (Fig. 1). A similar effect of pH was observed with a lower solution F concentration (52·6 µmol L–1) and with a shorter uptake period (22 h) (data not shown). Root F concentrations followed the same trend as leaf F concentrations but the effect of pH was not statistically significant (P > 0·05). Solution pH had no effect on stem F.

Fig. 1. F concentrations in tea plants grown in solutions with different pH values (expt 1). The F concentration in the external solution was 105·2 µmol L–1 and the uptake duration 48 h. Bars are standard deviations (n = 3).
Effect of liming on F uptake by tea plants (expt 2)
The properties of soil sampled at harvest are shown in Table 1. Soil pH changed a little after planting compared with its initial value. Liming significantly increased exchangeable Ca, K and Mg concentrations, but reduced labile Al concentration. Water‐soluble F concentrations were also increased when the applied amount of CaO exceeded 1·65 g kg–1, and remained unchanged thereafter. Dry matter production was unaffected by liming treatment (data not shown). Leaf F concentrations were dramatically reduced by liming (Fig. 2A), being reduced by 37·2 and 88·7 % following CaO application at 1·05 and 2·70 g kg–1, respectively, compared with the unlimed control. Leaf F concentrations linearly and negatively correlated with the amounts of CaO applied [Fleaves = 837 – 290L, R2 = 0·95, P < 0·001; where F is the leaf F concentration (mg kg–1) and L is the amount of CaO applied (g kg–1)]. Root F concentrations were also decreased by liming at 1·05 g kg–1 and remained unchanged thereafter, whereas stem F concentrations were unaffected (Fig. 2B). Liming reduced Al concentration while increasing Ca and Mg concentrations in the leaves (Table 2). Concentrations of K (Table 2), S, Fe and Zn were unaffected by liming (data not shown).
Table 1.
Effects of liming on the properties of the soil at harvest (expt 2)
| Exchangeable | ||||||
| CaO added (g kg–1) | pH | Water soluble F (mg kg–1) | Ca (mg kg–1) | K (mg kg–1) | Mg (mg kg–1) | Labile Al (mg kg--1) |
| 0 | 4·49 ± 0·17a | 0·04 ± 0·01a | 435 ± 18a | 64 ± 13ab | 40 ± 3a | 90·4 ± 10·6c |
| 1·05 | 5·31 ± 0·20b | 0·02 ± 0·00a | 1006 ± 67b | 71 ± 4b | 120 ± 9b | 11·0 ± 5·2b |
| 1·65 | 5·39 ± 0·20b | 0·04 ± 0·01a | 1021 ± 19b | 56 ± 5a | 204 ± 6c | 4·8 ± 1·4ab |
| 2·15 | 6·04 ± 0·02c | 0·10 ± 0·04b | 1441 ± 37c | 64 ± 14ab | 222 ± 8d | 1·3 ± 0·2a |
| 2·70 | 6·61 ± 0·07d | 0·10 ± 0·02b | 1551 ± 31d | 77 ± 5bc | 245 ± 6e | 1·5 ± 0·3a |
Values are mean ± s.d., n = 5.
Within each column, values followed by different letters are significantly different (P < 0·05) by the Fisher’s l s.d. test.

Fig. 2. Effects of liming with CaO on F concentrations in leaves (A), and roots and stems (B) of tea plants (expt 2). Bars are standard deviations (n = 5).
Table 2.
Effects of liming on the concentrations of elements (mg g–1) in leaves (expt 2)
| CaO added (g kg–1) | Ca | K | Mg | Al |
| 0 | 2·6 ± 0·4a | 12·5 ± 2·6a | 2·2 ± 0·3a | 4·4 ± 0·7d |
| 1·05 | 2·9 ± 0·6ab | 13·0 ± 1·0a | 2·9 ± 0·4b | 3·4 ± 0·4d |
| 1·65 | 3·2 ± 0·4c | 12·4 ± 1·4a | 3·6 ± 0·2d | 2·3 ± 0·3c |
| 2·15 | 2·9 ± 0·1ab | 12·5 ± 2·5a | 3·1 ± 0·2c | 1·5 ± 0·4b |
| 2·70 | 3·1 ± 0·2bc | 12·5 ± 2·0a | 3·3 ± 0·2cd | 1·2 ± 0·2a |
Values are mean ± s.d., n = 5.
Within each column, figures followed by different letters are significantly different (P < 0·05) by Fisher’s l s.d. test.
Effect of Ca in solution on F uptake by tea plants (expt 3)
The addition of Ca to the uptake solution significantly decreased leaf F concentrations, the effect being evident even when 12·5 µmol L–1 Ca was applied (Fig. 3A). At this level of Ca, leaf F concentration was decreased by 10·5 % (P < 0·05) compared with the control without Ca. Leaf F concentrations were further decreased with increasing Ca concentrations in the uptake solution. Root and stem F concentrations (Fig. 3A), and leaf Ca concentrations (data not shown) were unaffected. The distribution pattern of F was unaltered by Ca, with most F being found in leaves. Doubling the F concentration in the uptake solution to 105 µmol L–1 and extending the uptake period to 72 h increased the plant F concentration, and the effect of Ca on F uptake was more pronounced (Fig. 3B). Leaf F concentrations were decreased by 17·3 and 42·9 % when the solution Ca was 50 and 75 µmol L–1, respectively. However, F uptake was unaffected when the solution Ca was 12·5 µmol L–1. Again, root and stem F concentrations were unaffected by solution Ca (data not shown).

Fig. 3. Effects of Ca in the external solution on F concentrations in tea plants (expt 3). The external solution F concentration and the uptake duration were, respectively, 52·6 µmol L–1 and 22 h (A); and 105·2 µmol L–1 and 72 h (B). Bars are standard deviations (n = 3).
Effect of Ca addition to soil on F uptake by tea plants (expt 4)
The addition of F to soil significantly increased the water‐soluble F concentration in the soil (Table 3). Soil pH, exchangeable Ca and K were unaffected by F treatment. Exchangeable Mg was significantly increased only by F and Ca at 500 mg kg–1. Soil labile Al was increased by F application when Ca was not added but changed little when Ca was added. The addition of Ca significantly increased water‐soluble F in treatments without F application but not in its presence. Exchangeable Ca content and soil pH were both increased by Ca application but exchangeable K was increased only when F was also applied. Labile Al decreased in soil following Ca application at 500 mg kg–1.
Table 3.
Effects of Ca and F on the properties of the soil sampled 30 d after application (expt 4)
| Treatment (mg kg–1) | Exchangeable | ||||||
| F | Ca | pH | Water soluble F (mg kg–1) | Ca (mg kg–1) | K (mg kg–1) | Mg (mg kg–1) | Labile Al (mg kg--1) |
| 0 | 0 | 5·26 ± 0·23 | 0·09 ± 0·02 | 478 ± 45 | 108 ± 5 | 49 ± 3 | 44·5 ± 8·6 |
| 0 | 100 | 5·16 ± 0·10 | 0·07 ± 0·02 | 558 ± 33 | 107 ± 6 | 48 ± 6 | 34·5 ± 6·1 |
| 0 | 500 | 5·44 ± 0·14 | 0·14 ± 0·03 | 808 ± 61 | 116 ± 17 | 41 ± 1 | 12·6 ± 1·9 |
| 30 | 0 | 5·22 ± 0·12 | 0·64 ± 0·07 | 435 ± 9 | 95 ± 10 | 46 ± 2 | 62·4 ± 8·5 |
| 30 | 100 | 5·23 ± 0·16 | 0·43 ± 0·16 | 641 ± 79 | 141 ± 16 | 56 ± 6 | 38·0 ± 4·7 |
| 30 | 500 | 5·51 ± 0·07 | 0·58 ± 0·05 | 813 ± 27 | 134 ± 17 | 49 ± 3 | 16·6 ± 4·7 |
| ANOVA (F‐value) | |||||||
| Factor | F | 0·29 | 161·39** | 0·43 | 4·45 | 4·87* | 8·37* |
| Ca | 6·54* | 4·20* | 82·14** | 6·35* | 3·95 | 59·15** | |
| Ca × F | 0·32 | 2·49 | 2·59 | 4·92* | 3·39 | 2·63 | |
Values are mean ± s.d., n = 3.
* P < 0·05; ** P < 0·01.
Leaf and young shoot F concentrations were significantly decreased by the addition of Ca at 500 mg kg–1 (Fig. 4). The application of Ca at 100 mg kg–1 did not affect young shoot F in either F treatment or in leaves when no additional F was applied to the soil. Following F application, leaf F was decreased by Ca applied at this level. Leaf and young shoot F concentrations were negatively correlated (P < 0·01) with the exchangeable Ca content of the soil (Fig. 5A and B). The addition of F to the soil only increased F concentrations in young shoots but not in leaves 1 month after treatment. However, after a longer period, a higher leaf F concentration was also observed (data not shown). Concentrations of other elements in leaves and young shoots are presented in Tables 4 and 5. In leaves, Ca and Mg concentrations were unaffected by Ca and F treatments. leaf K was higher when Ca was applied at 500 mg kg–1 but without the addition of F. Al concentration was lower in the leaves of plants supplied with F than in those without, and was further slightly, but not significantly, decreased following the addition of Ca. In young shoots, Ca was significantly increased following the addition of Ca. Concentrations of Al, K and Mg were unaffected by F and Ca applications. The results of the correlation analysis between F concentrations and other elements in plants and soil properties are presented in Table 6. Leaf F concentrations were positively correlated with labile Al and negatively with soil pH and exchangeable Ca content. Significantly positive and negative correlations were found between young shoot F and soil labile Al and exchangeable Ca, respectively. Water‐soluble F content correlated significantly with young shoot F but not with that in leaves. No significant correlations were found between plant F and Al, Mg or soil exchangeable Mg. Correlations between plant F and K or Ca were less consistent, being significant only in leaves for K and in young shoots for Ca.

Fig. 4. F concentrations in leaves (A) and young shoots (B) of tea plants sampled 30 d after the addition of Ca and F to the soil (expt 4). Bars are standard deviations (n = 3).
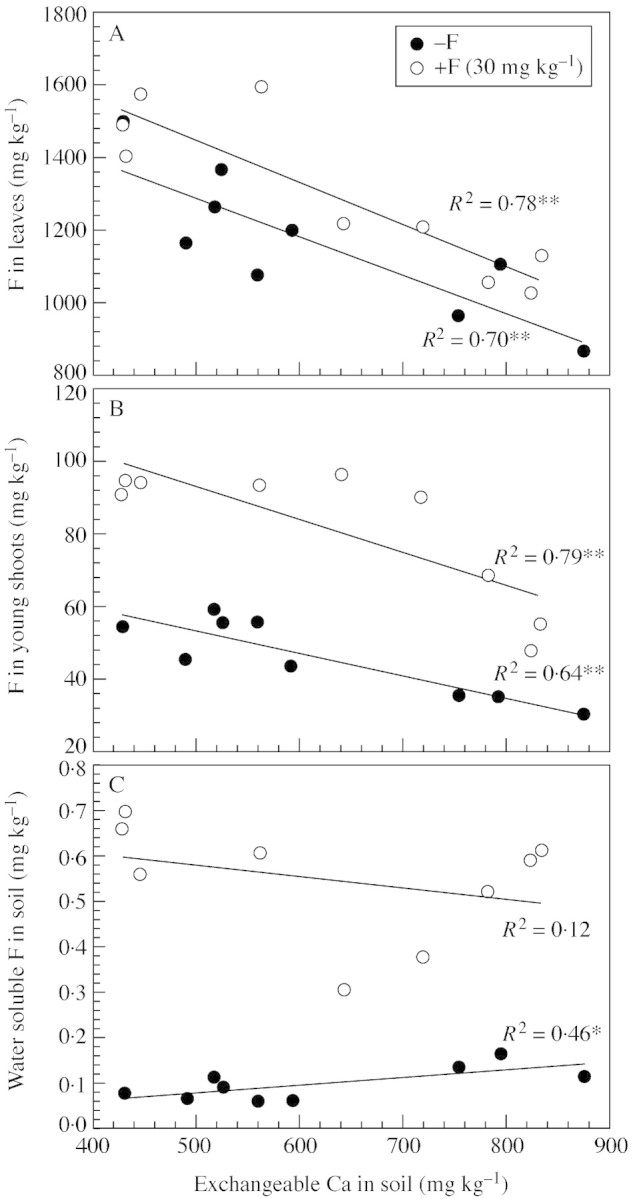
Fig. 5. Relationship between exchangeable Ca with F concentrations in leaves (A) and young shoots (B) of tea plants, and water soluble F in soil (C) (expt 4). * P < 0·05; ** P < 0·01.
Table 4.
Effects of Ca and F on the concentrations of elements in leaves sampled 30 d after application (expt 4)
| Treatment (mg kg–1) | Concentration (mg g–1) | ||||
| F | Ca | Ca | K | Mg | Al |
| 0 | 0 | 5·3 ± 0·4 | 7·6 ± 0·6 | 3·3 ± 0·2 | 4·7 ± 0·3 |
| 0 | 100 | 6·6 ± 0·6 | 7·7 ± 0·7 | 3·9 ± 0·4 | 4·3 ± 0·8 |
| 0 | 500 | 6·1 ± 0·8 | 10·2 ± 1·4 | 3·6 ± 0·2 | 3·6 ± 0·6 |
| 30 | 0 | 5·2 ± 1·0 | 7·6 ± 0·8 | 3·3 ± 0·1 | 3·7 ± 0·7 |
| 30 | 100 | 5·7 ± 0·4 | 7·6 ± 0·7 | 3·6 ± 0·2 | 3·4 ± 0·8 |
| 30 | 500 | 6·2 ± 0·8 | 8·6 ± 0·6 | 3·6 ± 0·2 | 3·0 ± 0·7 |
| ANOVA (F‐value) | |||||
| Factor | F | 0·76 | 2·01 | 0·65 | 7·29* |
| Ca | 3·14 | 9·71** | 3·81 | 2·73 | |
| F × Ca | 0·27 | 1·75 | 0·59 | 0·15 | |
Values are mean ± s.d., n = 3.
* P < 0·05; ** P < 0·01
Table 5.
Effects of Ca and F on the concentrations of elements in young shoots sampled 30 d after application (expt 4)
| Treatment (mg kg–1) | Concentration (mg g–1) | Concentration (mg kg–1) | |||
| F | Ca | Ca | K | Mg | Al |
| 0 | 0 | 3·1 ± 0·3 | 21·3 ± 0·7 | 3·3 ± 0·1 | 351 ± 47 |
| 0 | 100 | 3·3 ± 0·1 | 22·7 ± 1·3 | 3·5 ± 0·2 | 310 ± 100 |
| 0 | 500 | 3·4 ± 0·4 | 22·9 ± 0·3 | 3·2 ± 0·2 | 241 ± 19 |
| 30 | 0 | 2·9 ± 0·2 | 21·0 ± 0·5 | 3·3 ± 0·2 | 302 ± 15 |
| 30 | 100 | 3·0 ± 0·1 | 22·1 ± 2·2 | 3·4 ± 0·3 | 279 ± 12 |
| 30 | 500 | 3·6 ± 0·1 | 23·3 ± 1·9 | 3·4 ± 0·2 | 255 ± 62 |
| ANOVA (F‐value) | |||||
| Factor | F | 0·43 | 0·03 | 0·13 | 0·76 |
| Ca | 7·76** | 3·18 | 0·95 | 3·36 | |
| F × Ca | 1·75 | 0·25 | 0·53 | 0·57 | |
Values are mean ± s.d., n = 3.
* P < 0·05; ** P < 0·01.
Table 6.
Correlations between F concentration and Ca, Al, K and Mg in leaves or young shoots, and water soluble F, pH, exchangeable Ca, K, Mg and labile Al in the soil (expt 4)
| F in leaves | F in young shoots | |||
| Correlation coefficient | Significance level | Correlation coefficient | Significance level | |
| Plant Ca | –0·29 | NS | –0·59 | ** |
| Plant Al | 0·35 | NS | 0·23 | NS |
| Plant K | –0·63 | ** | –0·40 | NS |
| Plant Mg | –0·19 | NS | 0·08 | NS |
| Water soluble F | 0·36 | NS | 0·66 | ** |
| pH | –0·74 | ** | –0·34 | NS |
| Exchangeable Ca | –0·80 | ** | –0·48 | * |
| Exchangeable K | –0·23 | NS | 0·08 | NS |
| Exchangeable Mg | 0·16 | NS | 0·41 | NS |
| labile Al | 0·85 | ** | 0·66 | ** |
NS P ≥ 0·05, * P < 0·05, ** P< 0·01.
DISCUSSION
The effect of pH on F uptake
The uptake of F by tea plants was highest at solution pH 5·5 and lower at pH 4·0, although the percentage of HF increased to 6·15 % at pH 4·0 from 0·08 % at pH 5·94, as calculated by GEOCHEM‐PC (Parker et al., 1995). This seems inconsistent with the previous findings of Stevens et al. (1998a) who demonstrated that the HF uptake rate was orders of magnitude higher than F– at similar ion activities because HF readily diffused across the cell membrane. These authors found that with decreasing solution pH the proportion of HF increased considerably, leading to significantly higher F concentrations in tomato and oat plants. The inconsistency of the present results with these findings might be attributed to the difference in plant species, with tea being an F accumulator, and possibly also to the difference in solution F concentrations used in the experiments. It was apparent from the work of Stevens et al. (1998a) that the plant F concentration increased sharply only after the activities of HF exceeded critical values (73 µmol L–1 for tomato and 169 µmol L–1 for oat). In the present study, a much lower F concentration (total 105 µmol L–1) was used and the activity of HF (approx. 7·2 µmol l–1 at pH 4·0) was more than one order of magnitude lower. In most tea soils, soil solution F concentrations are below 50 µmol L–1 (Ma et al., 2002).
The effect of liming with CaO on F in the soil and its uptake by tea plants
To investigate the effect of soil pH on F uptake by tea plants the soil pH was modulated by adding different amounts of CaO. Differing from the observations of the solution culture experiment, which showed highest F uptake at pH 5·5, increasing soil pH from 4·32 to 5·43 (with 1·65 g kg–1 CaO) significantly reduced F uptake. Thus, it appears that the reduction of F uptake by liming could not just be ascribed to the direct effect of soil pH; other factors were possibly playing roles. Similar effects of liming decreasing F concentrations in other plant species have been reported (Arnesen, 1997; Stanley et al., 2002). Arnesen (1997) showed that the F concentration in common bent was reduced slightly by liming with CaCO3, which was found to be related to lower F levels (extracted by H2O and 0·01 mol L–1 CaCl2) in the limed soil. However, the effect of liming with CaO observed in the present experiment appeared not to be related to the availability of F in the soil. Indeed, the water‐soluble F concentration was increased by liming. This is not in line with the findings of Arnesen (1997), as already mentioned above. The inconsistency might be due to the different initial F levels and properties (e.g. mineralogy) of the soils used in the two experiments. It is noted that the soils used by Arnesen (1997) were from F‐contaminated areas, containing considerably higher water‐soluble F concentrations (0·72–33·3 mg kg–1, with a mean of 6·1 mg kg–1). In addition, tea soils, being strongly acidic, possess a large capacity to absorb F due to a high proportion of amorphous, poorly ordered Al hydroxides and hydroxyl Al in the clay mineral fraction (Ruan et al., 2001). This was also reflected in the present expt 4, in which F extracted by H2O accounted, on average, for only 1·85 % of added F. The increase of water‐soluble F following CaO application might be the result of the displacement by OH– of F– from adsorption sites or from Al oxides/hydroxides into soil solution (Farrah et al., 1987). However, this could also possibly be due to the shortcoming of the method used to extract soluble F. The soil properties, such as pH, exchangeable Ca and labile Al, were altered considerably by liming, which might have changed the efficiency of water for extracting soil F. A previous experiment showed that water extraction efficiency was stronger as soil pH and exchangeable Ca increased (Rodríguez et al., 2001).
The effect of calcium on F uptake by tea plants
In the present experiments, adding Ca to the soil or uptake solution significantly decreased F uptake. Precipitation of F with Ca in solution and/or the complexing of Ca–F in the roots have been suggested as reasons for decreased uptake of F by Ca (Arnesen, 1997; Stevens et al., 1998a). However, analysis using GEOCHEM‐PC (Parker et al., 1995) showed that, under the conditions of expt 3, the precipitation of F with Ca was minimal and had no significant effect on the activity of F– in the uptake solution. Therefore, precipitation of F with Ca in solution does not appear to be sufficient explanation for the reported observations. Experimental results suggest that F uptake by plants is a passive process through an extra‐cellular pathway by leaking past either the endodermal barrier at the root tips or the endodermis where lateral roots formed (Takmaz‐Nisancioglu and Davison, 1988; Stevens et al., 1998a). This process possibly also occurs in tea plants (Ruan et al., 2003). Calcium is important for the stabilization of cell walls and membranes (Marschner, 1995). The reduced F uptake by tea plants was possibly related to a decreased passage of F as the properties of the cell wall or membrane permeability were altered considerably by Ca addition. This might have played a role in expt 3 in which a low Ca concentration (12·5 µmol L–1) effectively decreased leaf F concentration compared with when virtually no Ca was present in the uptake solution. Denying roots a supply of Ca might have disturbed the properties of cell walls and membranes even during the short uptake period (22 h in expt 3). Conversely, results from expts 1 and 3 and previous work (Ruan et al., 2003) showed that most F taken up by tea plants was transported to the above‐ground organs, in particular the leaves, within a relatively short uptake time. It has also been proposed that F translocation in the xylem from root to shoot is inhibited by precipitation with Ca in the roots, and that Ca increases the retention of F and lessens its rate of transport in the transpiration stream (Stevens et al., 1998b and references therein). However, our finding that root and stem F concentrations were unaffected by Ca concentration in the uptake solution (expt 3) does not support this suggestion. When the distribution pattern of F in tea plants remained similar, the lower F concentration in leaves was principally due to the decreased uptake by Ca in the uptake solution.
The conditions in the soil experiment were more complex. In expt 4, leaf and young shoot F concentrations either decreased, even though the level of water‐soluble F in the soil was not significantly affected by the addition of F, or increased slightly due to exchangeable Ca levels in treatments without additional F (Table 3; Fig. 5C). Usually, water‐soluble F provides a good indication of plant‐available F in soil (Arnesen, 1997) and also correlates well with the F concentration in tea plants (Fung et al., 1999; Ruan et al., 2003). One possible reason could be that the change of plant‐available F following Ca(NO3)2 application was not precisely quantified by the water‐soluble F determined with TISAB. Although the initial level of water‐soluble F in soil was relatively low (0·04 mg kg–1), it is possible that some F became adsorbed on to colloidal or newly formed CaF2 precipitation particles, which were then extracted and measured with TISAB. Nevertheless, the reduction of F uptake was probably more importantly related to the change of the speciation of F and its quantity in soil solution following Ca addition. Previous studies have indicated that F uptake by plants is strongly affected by its concentration and, more importantly, by its speciation in nutrient solutions (Stevens et al., 1997; 1998a, b). The speciation of F in the soil solution, which was not measured, might have been altered following CaO and Ca(NO3)2 applications since labile Al levels in the soil were decreased and the pH increased. Results from a previous study indicated that F complexing with Al in soil solution was directly affected by soil pH and content of Al extracted by CaCl2 (0·01 mol L–1) (McLaughlin et al., 2001). Previous experiments demonstrated that F uptake by tea plants was facilitated by supplying Al in either the uptake solution or the soil (Ruan et al., 2003) as the formation of Al–F complexes neutralizes the negative charge of the F– and consequently decreases exclusion by the negatively charged cell wall (Takmaz‐Nisancioglu and Davison, 1988; Stevens et al., 1997). The correlation analysis also showed that young shoot and leaf F concentrations correlated positively with labile Al levels in soil and, furthermore, that the absolute values of the coefficients were larger than those with exchangeable Ca (Table 6). Nevertheless, no significant correlation was found between F and Al concentrations in either leaves or young shoots, a finding inconsistent with other observations in tea (Yumada and Hattori, 1977; Fung et al., 1999), in Tibouchina pulchra, which also accumulates Al and tolerates high F in leaves (Domingos et al., 2003), and in other plant species (Takmaz‐Nisancioglu and Davison, 1988; Arnesen, 1997). In other experiments, we also observed no significant correlation between F and Al concentrations in leaves, although F concentrations were significantly increased both by including Al in the nutrient solution or by adding Al to the soil (Ruan et al., 2003).
The results of this study have demonstrated that when tea plants are inherently able to accumulate large amounts of F, this process could be alleviated through the modulation of F availability and its speciation in the growth medium. Tea plants grow well on acidic soils (pH <5·5) with high available Al, in which F– in soil solution possibly exists predominantly as Al–F complexes (Elrashidi and Lindsay, 1986). The work presented here has indicated that the application of substances containing Ca is a promising soil management technique to reduce F uptake by tea plants and consequently its concentration in tea products.
ACKNOWLEDGEMENTS
The critical comments of two anonymous referees were helpful and are gratefully acknowledged. This research was supported financially by the Ministry of Sciences and Technology of China under contract K2000‐05‐02 and the ‘151 Project’ of Zhejiang Province.
Supplementary Material
Received: 9 June 2003; Returned for revision: 15 August 2003; Accepted: 19 September 2003 Published electronically: 26 November 2003
References
- ArnesenAKM.1997. Availability of fluoride to plants grown in contaminated soils. Plant and Soil 191: 13–25. [Google Scholar]
- BilbeissiMW, Fraysse C, Mitre D, Kerebel LM, Kerebel B.1988. Dental fluorosis in relation to tea drinking in Jordan. Fluoride 21: 121–126. [Google Scholar]
- CaoJ, Zhao Y, Liu J.1997. Brick tea consumption as the cause of dental fluorosis among children from Mongol, Kazak and Yugu populations in China. Food Chemistry and Toxicology 35: 827–833. [DOI] [PubMed] [Google Scholar]
- DavisonAW, Takmaz‐Nisanciolu S, Bailey IF.1985. The dynamics of fluoride accumulation by vegetation. In: Susheela AK, ed. Fluoride toxicity New Dehli: International Society for Fluoride Research, 30–46. [Google Scholar]
- DomingosM, Klumpp A, Rinaldi MCS, Modesto IF, Klumpp G, Delitti WBC.2003. Combined effects of air and soil pollution by fluoride emissions on Tibouchina pulchra Cogn. at Cubatão, SE Brazil, and their relations with aluminium. Plant and Soil 249: 297–308. [Google Scholar]
- DongD, Xie Z, Du Y, liu C, Wang S.1999. Influence of soil pH on aluminum availability in the soil and aluminum in tea leaves. Communications in Soil Science and Plant Analysis 30: 873–883. [Google Scholar]
- ElrashidiMA, Lindsay WL.1986. Chemical equilibria of fluorine in soils: a theoretical development. Soil Science 141: 274–280. [Google Scholar]
- FarrahH, Slavek J, Pickering WF.1987. Fluoride interactions with hydrous aluminium oxides and alumina. Australian Journal of Soil Research 25: 55–69. [Google Scholar]
- FrankenbergerWT Jr, Tabatabai MA, Adriano DC, Doner HE.1996. Bromine, chlorine and fluorine. In: Sparks DL, ed. Methods of soil analysis. Part 3. Chemical methods Madison: Soil Science Society of America, 833–867. [Google Scholar]
- FungKF, Zhang ZQ, Wong JWC, Wong MH.1999. Fluoride contents in tea and soil from tea plantations and the release of fluoride into tea liquor during infusion. Environmental Pollution 104: 197–205. [Google Scholar]
- KeerthisingheG, McLaughlin MJ, Randall PJ.1991. Improved recovery of fluoride in plant material using a low temperature sealed chamber digestion technique in conjunction with a fluoride ion‐specific electrode. Communications in Soil Science and Plant Analysis 22: 1831–1846. [Google Scholar]
- KonishiS, Miyamoto S.1983. Alleviation of aluminum stress and stimulation of tea pollen tube growth by fluorine. Plant and Cell Physiology 24: 857–862. [Google Scholar]
- McLaughlinMJ, Stevens DP, Keerthisinghe DG, Cayley JWD, Ridley AM.2001. Contamination of soil with fluoride by long‐term application of superphosphates to pastures and risk to grazing animals. Australian Journal of Soil Research 39: 627–640. [Google Scholar]
- MaL, Shi Y, Ruan J, Han W.2002. Status of fluoride of soils from tea gardens in brick tea areas of Hunan, Hubei provinces and its affecting factors. Journal of Tea Science 22: 34–38. [Google Scholar]
- MarschnerH.1995.Mineral nutrition of higher plants, 2nd edn. San Diego: Academic Press. [Google Scholar]
- MillerGW.1993. The effect of fluoride on higher plants: with special emphasis on early physiological and biochemical disorders. F luoride 26: 3–22. [Google Scholar]
- NagataT, Hayatsu M, Kosuge N.1993. Aluminium kinetics in the tea plant using 27Al and 19F NMR. Phytochemistry 32: 771–775. [Google Scholar]
- ParkerDR, Norvell WA, Chaney RL.1995. GEOCHEM‐PC: a chemical speciation program for IBM and compatible personal computers. In: Loeppert RH, ed. Chemical equilibrium and reaction models Madison: American Society of Agronomy, 253–269. [Google Scholar]
- RaoGS.1984. Dietary intake and bioavailability of fluoride. Annual Review of Nutrition 4: 115–136. [DOI] [PubMed] [Google Scholar]
- RodríguezCG, Rodríguez EÁ, Marcos MLF.2001. Comparison of methods for fluoride extraction from forest and cropped soils in vicinity of an aluminum smelter in Galicia (NW Spain). Comm unications in Soil Science and Plant Analysis 32: 2503–2517. [Google Scholar]
- RuanY, Fang X.1981. Studies on mineral nutrition of tea plants IV. Fluoride. In: Proceedings of Tea Research 1980–1981 Hangzhou: Tea Research Institute of Chinese Academy of Agricultural Sciences of China, 242–246. [Google Scholar]
- RuanJ, Wong MH.2001. Accumulation of fluoride and aluminium related to different varieties of tea plant. Environmental Geo chemistry Health 23: 53–63. [Google Scholar]
- RuanJ, Ma L, Shi Y, Han W.2001. Adsorption and desorption of fluoride by tea soils. Journal of Tea Science 21: 161–165. [Google Scholar]
- RuanJ, Ma L, Shi Y, Han W.2003. Uptake of fluoride by tea plants (Camellia sinensis l.) and the impact of aluminium. Journal of the Science of Food and Agriculture 83: 1342–1348. [Google Scholar]
- SimpsonA, Shaw L, Smith AJ.2001. The bio‐availability of fluoride from black tea. Journal of Dentistry 29: 15–21. [DOI] [PubMed] [Google Scholar]
- StanleyVA, Shaleesha A, Murthy PBK, Pillai KS.2002. Retarding fluoride accumulation in Amaranthes viridis through liming and implications of phosphorous treatment. Journal of Environmental Biology 23: 265–269. [PubMed] [Google Scholar]
- StevensDP, McLaughlin MJ, Alston AM.1995. Limitations of acid digestion techniques for the determination of fluoride in plant material. Communications in Soil Science and Plant Analysis 26: 1823–1842. [Google Scholar]
- StevensDP, McLaughlin MJ, Alston AM.1997. Phytotoxicity of aluminium–fluoride complexes and their uptake from solution culture by Avena sativa and lycopersicon esculentum Plant and Soil 192: 81–93. [Google Scholar]
- StevensDP, McLaughlin MJ, Alston AM.1998a. Phytotoxicity of the fluoride ion and its uptake from solution culture by Avena sativa and lycopersicon esculentum Plant and Soil 200: 119–129. [Google Scholar]
- StevensDP, McLaughlin MJ, Alston AM.1998b. Phytotoxicity of hydrogen fluoride and fluoroborate and their uptake from solution culture by lycopersicon esculentum and Avena sativa Plant and Soil 200: 175–184. [Google Scholar]
- Takmaz‐NisanciogluS, Davison AW.1988. Effects of aluminium on fluoride uptake by plants. New Phytologist 109: 149–155. [Google Scholar]
- XieZ, Ye ZH, Wong MH.2001. Distribution characteristics of fluoride and aluminium in soil profiles of an abandoned tea plantation and their uptake by six woody species. Environment International 26: 341–346. [DOI] [PubMed] [Google Scholar]
- YumadaH, Hattori T.1977. Investigation of the relationship between aluminium and fluorine in plants (Part I). Relationship between aluminium and fluorine in tea leaves. Japanese Journal of Soil Science and Manure 48: 253–261. [Google Scholar]
Associated Data
This section collects any data citations, data availability statements, or supplementary materials included in this article.