

Abstract
• Background and Aims Stem respiration of trees is a major, but poorly assessed component of the carbon balance of forests, and important for geo-chemistry. Measurements are required under naturally changing seasonal conditions in different years. Therefore, intra- and inter-annual carbon fluxes of stems in forests were measured continuously from April to November in three consecutive years.
• Methods Stem respiratory CO2 fluxes of 50-year-old Scots pine (Pinus sylvestris) trees were continuously measured with a CO2 analyser, and, concomitantly, stem circumference, stem and air temperature and other environmental factors and photosynthesis, were also measured automatically.
• Key Results There were diurnal, seasonal and inter-annual changes in stem respiration, which peaked at 1600 h during the day and was highest in July. The temperature coefficient of stem respiration (Q10) was greater during the growing season than when growth was slow or had stopped, and more sensitive to temperature in the growing season. The annual Q10 remained relatively constant at about 2 over the three years, while respiration at a reference temperature of 15 °C (R15) was higher in the growing than in the non-growing season (1·09 compared with 0·78 µmol m−2 stem surface s−1), but was similar between the years. Maintenance respiration was 76 %, 82 % and 80 % of the total respiration of 17·46, 17·26 and 19·35 mol m2 stem surface in 2001, 2002 and 2003, respectively. The annual total stem respiration of the stand per unit ground area was 75·97 gC m−2 in 2001 and 74·28 gC m−2 in 2002.
• Conclusions Stem respiration is an important component in the annual carbon balance of a Scots pine stand, contributing 9 % to total carbon loss from the ecosystem and consuming about 8 % of the carbon of the ecosystem gross primary production. Stem (or air) temperature was the most important predictor of stem carbon flux. The magnitude of stem respiration is modified by photosynthesis and tree growth. Solar radiation indirectly affects stem respiration through its effect on photosynthesis.
Key words: Stem respiration, Pinus sylvestris, intra- and inter-annual change, Q10, growth respiration, maintenance respiration, carbon balance
INTRODUCTION
Interest in stem (also called trunk or bole) respiration is increasing because it is thought that it is a large component of the annual carbon balance of trees. Respiration decreases the capacity of trees and forests to act as long-term carbon sinks for removing and storing large amounts of atmospheric carbon (Ryan et al., 1994, 1996; Landsberg and Gower, 1997; Lavigne et al., 1997). Woody tissues account for about 25 % of the total above-ground autotrophic respiration of northern coniferous forests (Lavigne et al., 1997) and up to 50 % in some temperate deciduous forests (Edwards et al., 1981). Measuring the respiration of woody tissue, and understanding what regulates it, are therefore essential steps in understanding global carbon balance and modelling CO2 exchange between forests and the atmosphere.
Studies based on eddy covariance measurements have shown considerable differences in ecosystem respiration rates between seasons within years and between years (Aubinet et al., 2000, 2002; Falge et al., 2002). Respiration is a key process in explaining differences and variations in ecosystem productivity (Zha et al., 2004), and woody tissue respiration makes an important contribution to total ecosystem respiration (Damesin et al., 2002). However, estimates of the proportion of woody tissue respiration show large differences and variations (Ryan et al., 1995). Differences in woody-tissue respiration might arise partly from limited data sets because measurements were made at certain periods on some days. Therefore, continuous measurements of stem respiration are required if respiration rates are to be properly assessed. Additionally, some results show diurnal and seasonal changes in woody tissue respiration (Damesin et al., 2002; Vose and Ryan, 2002) which clearly varies from one month to another and may be related to temperature (Paembonan et al., 1991). Therefore, the rates of stem respiration should be measured over seasons. However, there have been few measurements of seasonal respiration throughout the entire year (Damesin et al., 2002) and additional measurements are required to test them.
Factors that regulate woody tissue respiration are of interest to forest managers and ecologists, because the stem represents an economic output and a long-term carbon sink. Understanding how environmental conditions affect stem respiration and its contribution to total ecosystem carbon loss is essential for developing and validating forest productivity models (Ryan et al., 1994). Air temperature is the most important predictor of stem respiration in trees (Amthor, 1994), but other factors also affect it. Understanding woody tissue respiration and its controlling factors would help us to understand the effect of climatic change on carbon budgets (Vose and Ryan, 2002).
In the current study, these questions and requirements have been addressed by measuring the stem respiration of Scots pine trees (Pinus sylvestris) continuously for 3 years. The objectives were to determine the response of respiration to stem temperature over the seasons, to examine inter-annual and intra-annual changes in stem respiration, to obtain an understanding of the relative importance of growth and maintenance components of respiration by using mature tissue method, and to estimate the annual CO2 flux from the stem under forest conditions and its responses to environmental factors.
MATERIALS AND METHODS
Site description
The research was carried out on a 50-year-old stand of Scots pine (Pinus sylvestris L.) at Huhus (62°52′N, 30°49′E, 145 m a.s.l.), eastern Finland. Eddy covariance measurement was done at the same site. The stand density was 1176 trees ha−1, with a mean height of 13·5 m above the ground and a mean diameter at breast height of 11·2 cm. The soil was a sandy podzol. The top 50 cm contained an average volumetric mineral fraction of 47 % and organic matter fraction of 21 % and had a mean bulk density of 1·34 g cm−3. The climate is characterized by a long, cold winter. The mean monthly temperature (−10·4 °C) is lowest in January and highest (15·8 °C) in July. The average annual precipitation at the site (1961–2000) is 724 mm, of which 38 % falls as snow between November and April.
Measurement of stem respiration
In 2001, three trees, 10·4, 11·7 and 23·8 cm in diameter at a height of 1·3 m above ground, were selected for stem respiration measurements. Stem CO2 fluxes were recorded continuously from April to November in 2001, 2002 and 2003 using a CO2 and H2O analyser (Hartmann and Braun URAS 14, Software Version 1·3, Hartmann and Braun GmbH and Co. KG, Germany). This system has an open, flow-through design in which CO2 efflux is measured as the difference between the CO2 entering and leaving the chamber. Ambient air, drawn from 1·3 m above the ground, is pumped through the stem cuvette and through the reference cell of the gas analyser. The zero of the reference cell was checked regularly during the measurements. The inlet and outlet airflows through the cuvette were maintained at approx. 1·5 L min−1 with a mass flow controller (model 5850E/B1A1B70, Holland). Air inside the cuvettes was mixed with a fan. Condensation on the gas line was avoided by warming the sample air and reference air hoses with heating tapes. This warming system slightly affected the temperature of the sample air. The CO2 exchange was recorded every 30 min. The stem temperature (at a depth of 5 mm under the bark) inside the cuvette was measured simultaneously (see below).
The respiration cuvette was a cylinder 16 cm long with two halves, completely encircling a segment of the tree stem at a height of 1·3 m above the ground. It was constructed of high-density foam (EPS-expanded polystyrene, UK-Muovi Oy, Iisalmi, Finland) and covered with aluminium foil both inside and out to prevent the bark from overheating on exposure to the sun. The two halves of the cuvette were attached to the bark with 20-mm-thick neoprene gaskets glued to the inside on both ends. To make sure that there was no leak of CO2 between the two halves or between the cuvette and the stem, putty, rubber straps and silicone vacuum grease were used to seal the fissures and the outside gaps. Any loose bark was removed from the area where the neoprene gasket made contact with the stem.
Stem temperature and diameter measurements
The stem temperature inside and outside the cuvette was measured continuously at a depth of 5 mm under the bark at hourly intervals with copper–constantan thermocouples at heights of 15 cm, 285 cm and 305 cm above the ground throughout the three years. Diameter growth at breast height was monitored throughout at hourly intervals with a dendrograph (ELPA 93, University of Oulu, Finland) consisting of a stainless-steel band and a displacement potentiometer. The accuracy was 0·5 mm. The details of the measurements of the profiles of air temperature and relative humidity (at 3·7 m, 9·5 m and 12·3 m), photosynthetically active radiation (PAR) and soil temperature (2·5 cm and 3·5 cm under soil surface) were described by Wang et al. (2004) and Zha et al. (2004). The volumetric water content of the mineral soil was continuously measured throughout the year at depths of 5 cm, 15 cm and 25 cm below the mineral soil surface using a water content reflectometer (CS615, Campbell Scientific, Shepshed, Leics., UK). The estimation of net ecosystem respiration (Re) and gross primary production (GPP) was reported (Zha et al., 2004).
Analysis of respiration data
Stem respiration was expressed on the basis of the surface area of stem and on stem volume. Mean hourly respiration values were used in the analysis of diurnal variation and mean daily values were used in other analyses. The analysis of respiration parameters was done using the stem temperature inside the cuvette. The stem temperature outside the cuvette was used to simulate the stem respiration because of lack of measurements of winter-time stem temperatures inside the cuvette. Simple linear regression using the daily average of the three years' data showed that stem respiration had a strong relationship with both stem temperature outside the cuvette (r2 = 0·68) and air temperature (r2 = 0·65), but a weak relationship with soil temperature (r2 = 0·28). Outside stem temperature (Tstem) is linearly related to air temperature (Tair; Tstem = 0·92Tair + 0·56, r2 = 0·98). It is therefore assumed that stem respiration had a similar response to stem temperatures outside and inside the cuvette, and air temperature. An exponential equation was used to establish the relationship between the respiration rates recorded in the field and stem temperature, as follows:
 |
where R is respiration at stem temperature T, R15 is respiration at the reference temperature of 15 °C and Q10 is the temperature coefficient of respiration.
To separate maintenance and growth respiration, the growing season for the tree stem was defined as the period when diameter growth was occurring (from around day 130 to day 240) and it was assumed that respiration in the non-growing season represents the maintenance component and that its response to temperature over that period is representative of its response in the growing season. Maintenance respiration was thus calculated from Q10 and R15 in the non-growing period and growth respiration was estimated by subtracting maintenance respiration from the total CO2 flux of the stem.
Annual total carbon flux of stems within a forest stand (on the basis of ground area) was estimated by integrating daily modelled values for the whole year. The volume of stand was estimated on the basis of measurements of 49 trees surrounding the eddy covariance tower within an area of 450 m radius.
Statistical analysis
GLM Univariate ANOVA was used to examine the effects of seasonal and inter-annual changes on Q10 and R15 and on the seasonal differences in respiration. The paired t-test was used to examine inter-annual variations in stem respiration. Covariance analysis was used to analyse the effect of environmental factors on respiration. Linear regression was used to analyse the relationship between respiration and environmental factors. All the statistical analyses were carried out using SPSS 11.5 for Windows (SPSS Inc., Chicago, IL, USA).
RESULTS
Diurnal variation
There were obvious diurnal changes in stem respiration per unit stem surface area during the growing season (Fig. 1A), corresponding to the diurnal variation in stem temperature (Fig. 1B), i.e. increasing after 5 h, peaking around 16 h and then decreasing. No diurnal changes in stem respiration were apparent in the non-growing season, e.g. the values over the day on both 24 September and 24 October were approximately constant, with little fluctuation, despite changes in temperature. The maximum amplitude of the change in diurnal respiration was 0·74 µmol m−2 s−1, occurring on 24 July, and the minimum amplitude was 0·07 µmol m−2 s−1, occurring on 24 October. The maximum amplitude of the change in diurnal temperature was 12·8 °C, occurring on 16 June, and was 2·5 times the minimum amplitude, occurring on 24 October. Diurnal amplitudes of the changes in respiration were three to ten times greater during the growing season than during the non-growing season, whereas the changes in temperature were less than 2·5 times greater during the growing than during the non-growing season.
Fig. 1.

Diurnal changes in stem respiration per unit stem surface area (A) and corresponding temperature (B) on eight typical clear days in 2001: 18 April, 20 May, 16 June, 24 July, 20 August, 24 September and 24 October. The respiration values are hourly averages of CO2 flux for three sample trees.
Seasonal variation
There were seasonal changes in stem respiration (Fig. 2), with the rates increasing after day 90 and peaking around day 190, then decreasing. Respiration rates during the winter were relatively low and changed little. The maximum mean daily rates were 1·59, 1·51 and 1·81 µmol m−2 s−1 (per unit stem surface area) in 2001, 2002 and 2003 (Fig. 2A), respectively, and 56·42, 52·75 and 63·04 µmol m−3 s−1 based on volume (Fig. 2B).
Fig. 2.

Observed mean daily respiration on the stem surface area (A) and volume basis (B) in 2001, 2002 and 2003.
When the relationship between respiration and temperature was considered in two seasons, there was good fit with eqn (1) (r2 > 0·7). The Q10 was generally greater in the growing season than in the non-growing season (Fig. 3A). The Q10 values were 1·96, 1·89 and 1·87 for the growing seasons of 2001, 2002 and 2003, respectively, and 1·90, 1·79 and 1·94 for the non-growing seasons. The respiration at reference temperature of 15 °C (R15) was higher in the growing season, being 1·07, 1·03 and 1·16 µmol m−2 s−1 (per unit stem surface area) (Fig. 3B) and 38·05, 36·13 and 40·56 µmol m−3 s−1 per unit stem volume (Fig. 3C) in 2001, 2002 and 2003, respectively, compared with 0·72, 0·74 and 0·87 µmol m−2 s−1 and 25·6, 25·95 and 30·23 µmol m−3 s−1 in the non-growing season.
Fig. 3.

The Q10 (A) and stem respiration at a reference temperature of 15 °C (R15) on the stem surface area (B) and volume basis (C) for the growing season and non-growing season in 2001, 2002 and 2003. Values are averages for three trees and arise from the regression of mean daily respiration against mean daily temperature in both the growing and non-growing season (r2 > 0·7). Bars represent the standard error. Values not given a common letter are significantly different at P = 0·05.
To gain further understanding of the seasonal changes in respiration, the respiration rates on six typical clear days representing the corresponding month in 2001 were regressed against the stem temperatures. There was a good fit with eqn (1) for all days (r2 > 0·7) except day 295 (24 October) (r2 = 0·4). There was a similar seasonal trend in Q10 (Fig. 4A) and R15 (Fig. 4B and C), increasing from early spring, peaking in July and then decreasing. It was noted that Q10 and R15 in April were higher than in May. The highest Q10 value (1·98) occurred in July and the lowest (1·59) in October. R15 was highest in July, being 1·24 µmol m−2 s−1 and 43·95 µmol m−3 s−1 on the basis of stem surface area and volume, respectively, and lowest in October, when the corresponding values were 0·36 µmol m−2 s−1 and 8·81 µmol m−3 s−1, respectively.
Fig. 4.

Seasonal changes in Q10 (A), stem respiration at a reference temperature of 15 °C (R15) on the basis of stem surface area (B) and volume basis (C). Values are from the exponential regression of respiration vs. corresponding temperature on seven typical clear days in 2001.
Annual respiration and inter-annual variation
Respiration over the year increased exponentially with stem temperature (Fig. 5), with a good fit with eqn (1) (r2 > 0·7). The annual Q10 was 2·09, 1·99 and 2·03 for 2001, 2002 and 2003, respectively, while annual stem respiration at the reference temperature of 15 °C (R15) was 1·06, 1·02 and 1·11 µmol m−2 s−1 (per unit stem surface area).
Fig. 5.
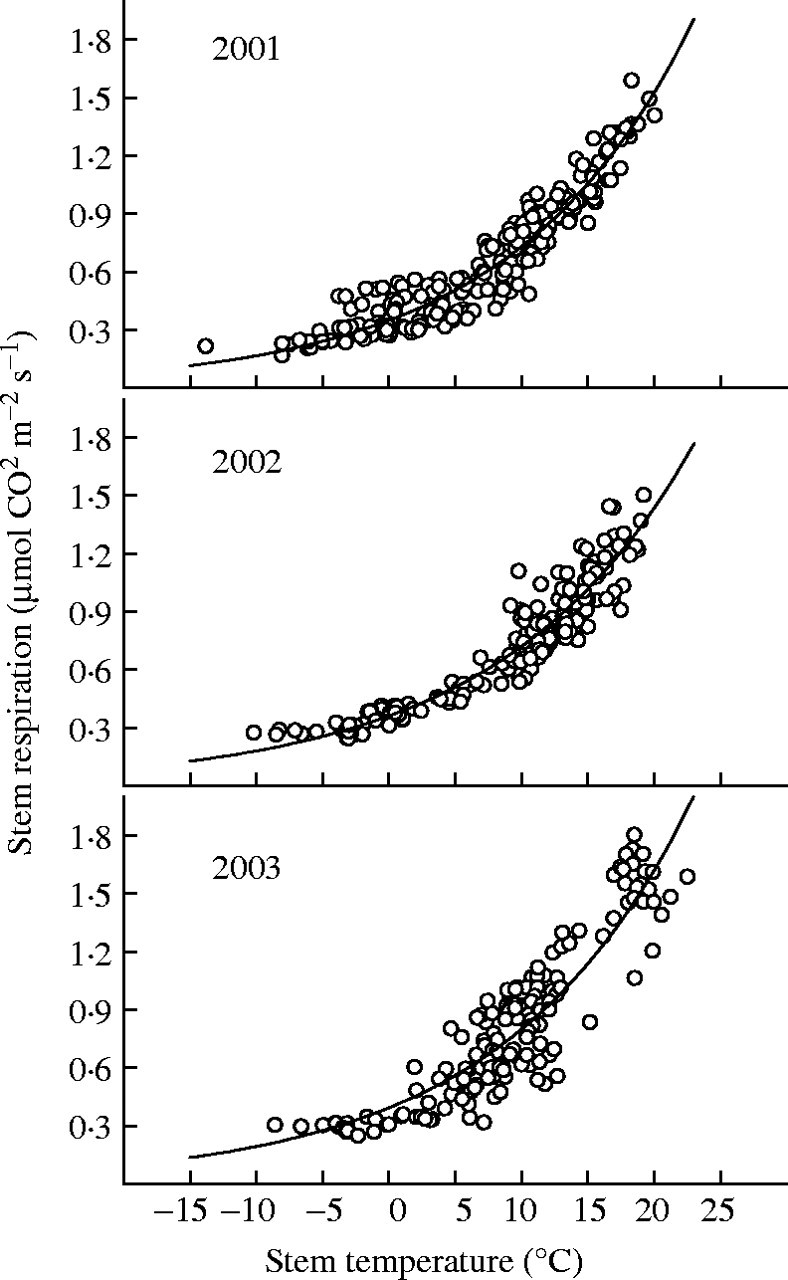
The relationship between stem respiration per unit stem surface area and stem temperature in 2001, 2002 and 2003. The values are daily averages. Solid lines represent the fitted line R = R15Q10(T − 15)/10.
Annual stem respiration was estimated with eqn (1). The modelled respiration matched the observed respiration well (Fig. 6), showing a closely linear relationship with a coefficient of determination (r2) higher than 0·75 in each of the three years. Inter-annual differences in stem respiration were significant (Table 1; P < 0·001), and significantly higher in 2003 than in the other two years (P < 0·0005), which showed no significant difference (P = 0·517). There were no significant inter-annual differences in either Q10 (P = 0·874) or R15 (P = 0·287). Maintenance respiration contributed about 80 % to the total in 2001, 2002 and 2003, respectively (Table 1).
Fig. 6.

Correlation between observed stem respiration per unit stem surface area and modelled stem respiration by means of eqn (1) for 2001, 2002 and 2003. Values are daily averages for three trees. The regression equations for 2001, 2002 and 2003 are y = 0·11 + 0·98x (r2 = 0·75), y = 0·11 + 0·97x (r2 = 0·83) and y = 0·28 + 0·75x (r2 = 0·75), respectively.
Table 1.
Total (Rt), maintenance (Rm) and growth respiration rates (Rg) for different periods of the year in 2001, 2002 and 2003, and corresponding mean stem temperatures
|
Rt (mol CO2 m−2) |
Rm (mol CO2 m−2) |
Rg (mol CO2 m−2) |
T (°C) |
|||||||||||||||||
|---|---|---|---|---|---|---|---|---|---|---|---|---|---|---|---|---|---|---|---|---|
| Time period |
2001 |
2002 |
2003 |
2001 |
2002 |
2003 |
2001 |
2002 |
2003 |
2001 |
2002 |
2003 |
||||||||
| 1–120 | 3·02 | 3·23 | 3·07 | 2·73 | 3·23 | 2·69 | 0·28 | 0·00 | 0·38 | –4·32 | –3·21 | –5·47 | ||||||||
| 121–243 | 12·12 | 12·05 | 13·20 | 8·43 | 8·94 | 10·16 | 3·69 | 3·11 | 3·04 | 12·19 | 12·59 | 12·91 | ||||||||
| 244–365 | 2·32 | 1·98 | 3·08 | 2·10 | 1·97 | 2·63 | 0·22 | 0·01 | 0·45 | –4·45 | –6·69 | –1·19 | ||||||||
| Entire year | 17·46a | 17·26a | 19·35b | 13·27a (76 %) | 14·14a (82 %) | 15·48b (80 %) | 4·19a (24 %) | 3·12b (18 %) | 3·87a (20 %) | 2·52 | 2·50 | 3·01 | ||||||||
The values in parenthesis represent contributions to total respiration.
Values not followed by a common letter are significantly different from each other at P = 0·05.
Stem respiration contributed 10 % and 8 % to the total ecosystem respiration in 2001 and 2002, respectively (Table 2), while it consumed 9 % and 7 % carbon of ecosystem GPP. Although stem respiration was much greater during the growing season than the non-growing season, the contributions of stem respiration to the ecosystem respiration in the same period and to the GPP were much lower in the growing season than in the non-growing season.
Table 2.
Stem respiration (Rstem, gC m−2 ground area) at stand level and its contribution (%) to ecosystem respiration Re and GPP (Zha et al., 2004)
| 2001 |
2002 |
|||||||||
|---|---|---|---|---|---|---|---|---|---|---|
| Time period |
Rstem |
Contribution to Re |
Contribution to GPP |
Rstem |
Contribution to Re |
Contribution to GPP |
||||
| 1–120 | 13·21 | 13 | 17 | 14·00 | 12 | 17 | ||||
| 121–243 | 44·77 | 9 | 6 | 44·63 | 7 | 5 | ||||
| 244–365 | 17·99 | 11 | 15 | 15·65 | 11 | 12 | ||||
| Sum | 75·97 | 10 | 8 | 74·28 | 9 | 7 | ||||
Analysis of factors controlling stem respiration
Among the environmental factors including air temperature, air relative humidity, soil water content and PAR, PAR had significant effects on stem respiration in addition to the effects of air temperature (Table 3). There was a linear relationship between PAR and stem respiration (r2 = 0·58; Fig. 7).
Table 3.
The results of covariance analysis based on three-year average of mean daily respiration (μmol CO2 m−2 s−1)
| Tests of between-subjects effects |
||||||
|---|---|---|---|---|---|---|
| Source |
d.f. |
F value |
Significance |
|||
| Corrected model | 4 | 229·283 | <0·0005 | |||
| Intercept | 1 | 0·004 | 0·950 | |||
| Air temperature | 1 | 100·667 | <0·0005 | |||
| Soil water content | 1 | 0·101 | 0·751 | |||
| Air relative humidity | 1 | 2·062 | 0·152 | |||
| PAR | 1 | 14·310 | <0·0005 | |||
Dependent variable is stem respiration.
Covariates are environmental factors.
Fig. 7.

Relationship between stem respiration per unit stem surface area and photosynthetically active radiation (PAR). The values are the average of 3-year mean daily values. The regression equation is y = 0·26 + 1·48x (r2 = 0·58).
Stem respiration was linearly related to the GPP of the ecosystem (r2 = 0·65 in 2001 and 0·71 in 2002; Fig. 8). There was a positive linear relationship between growth respiration and the rate of diameter growth (Fig. 9), with a coefficient of determination (r2) of 0·46.
Fig. 8.

Relationship between stand-level stem respiration and ecosystem GPP (Zha et al., 2004) in 2001 and 2002. The values are daily total. The regression is y = 0·12 + 0·03x (r2 = 0·65) in 2001 and y = 0·10 + 0·03x (r2 = 0·71) in 2002.
Fig. 9.

Relationship between mean monthly growth respiration and mean monthly rate of diameter growth. The regression equation is y = 0·17 + 10·04x (r2 = 0·45).
DISCUSSION
It has been reported that the respiratory potential of the inner bark of a tree is 3–15 times greater than that of the sapwood at all ages and that the outer sapwood has a 30–60 % higher potential than the middle or inner sapwood (Pruyn et al., 2002). It was therefore assumed that all CO2 efflux originates from the respiration of local tissues and that all CO2 produced by local tissue escapes to the atmosphere through the bark.
The stem respiration rates measured here in the Scots pine were comparable with those reported for other conifers. The Q10 values were in the range of those reported for various conifers during the dormant and growing seasons (Ryan, 1990; Ryan et al., 1995; Lavigne, 1996; Carey et al., 1997; Stockfors and Linder, 1998). When stem respiration rates over the entire year were regressed against corresponding stem temperatures (Fig. 5), Q10 was 2·09 in 2001, 1·99 in 2002 and 2·03 in 2003, values similar to those of other pine species (Ryan et al., 1994). The present demonstration of seasonal changes in Q10 is consistent with reports of significant seasonal variations in Q10 of stem tissues (Carey et al., 1997; Lavigne and Ryan, 1997). However, the higher Q10 values in the growing season seen in this study were in contrast to our results for 1-year-old branches of trees about 20 years old, in which Q10 was lower in the growing season than in the non-growing season (Zha et al., 2003). The reason for this is unclear. It might be due to the difference in tissue age and tree development stage.
The higher stem respiration, at a reference temperature of 15 °C (R15), in the growing season than in the non-growing season is consistent with results from other studies (Stockfors and Linder, 1998; Damesin et al., 2002). This could be explained by the respiratory potential being higher in the growing season, corresponding to the general rule that the greater the metabolic activity of a given tissue, the higher its respiration.
Diurnal and seasonal variations in stem respiration, which have been found in other forest tree species (Linder and Troeng, 1981; Paembonan et al., 1991; Lavigne, 1996; Vose and Ryan, 2002), reflected the physiological adjustments of trees to diurnal and seasonal temperature changes and the extent of metabolic activity. It was noted that the differences in the amplitude of diurnal changes in stem respiration between the growing and non-growing seasons were much greater than those in the amplitude of diurnal changes in stem temperature (Fig. 1), implying that the higher rates of respiration during the growing period could not be explained solely by the higher temperature, although temperature explained >70 % of stem respiration in the present data. The supply of respiratory substrates and demand for respiratory products can be involved in modifying the magnitude of stem respiration. The linearly positive relationship between stem respiration and the ecosystem GPP indicated that crown photosynthesis may partially regulate stem respiration (Fig. 8), because tree photosynthesis is the major component of ecosystem photosynthesis at the research site. The positive, linear relationship between stem respiration and PAR which is shown here, together with a strong positive relationship between the ecosystem GPP and PAR, implies that PAR affects respiration through its effect on GPP. This further emphasizes the role of photosynthetic production in the regulation of respiration. During the growing season, more energy is needed for growth and for the transport and turnover of protein, and the maintenance of ion gradients and concentrations, and higher photosynthesis supplies more substrates for respiration. Hence a higher respiratory potential is to be expected in the growing season. In addition, faster stem growth consumes more energy and intermediate products of respiration, thereby increasing the rate of stem respiration. The observation of a positive linear relationship between mean monthly growth respiration in the growing season and rates of diameter growth averaged over a period of 30 d provides further support for the above explanation (Fig. 9). Many studies have shown that respiration rates during the growing season are related to diameter or height growth (Zabuga and Zabuga, 1985; Anekonda et al., 1994; Stockfors and Linder, 1998; Damesin et al., 2002; Vose and Ryan, 2002).
The significant inter-annual difference in annual total respiration, together with the lack of any significant difference in Q10 or R15 between the years, indicates that the year-to-year differences in respiration are caused mainly by changes in temperature (Table 1). It was noted that the higher total respiration in 2003 came mainly from an increase in the maintenance component of stem respiration (Table 1), which is in accordance with the greater mean temperature. The likely explanation is that a higher temperature enhances the activity of respiration-related enzymes. It can therefore be assumed that the changes in mean annual temperature mainly affect the cost of maintenance rather than the cost of growth.
When total respiration were divided into two functionally distinct components called growth and maintenance (Amthor, 1994, 2000), annual maintenance respiration contributed much more (≈80 %) to total respiration than did growth respiration (≈20 %), as was also the case in Pinus ponderosa (Carey et al., 1996), Pinus banksiana (Lavigne, 1996) and Chamaecyparis obtuse (Paembonan et al., 1992). The rates of maintenance respiration at 15 °C ranged from 0·72 to 0·87 µmol m−2 s−1, thus coming close to that of Pinus taeda (0·64–1·47 µmol m−2 s−1) and Abies balsamea (0·8–1·8 µmol m−2 s−1), but remaining below that in Pinus contorta (6·5 µmol m−2 s−1) (Ryan et al., 1994; Lavigne et al., 1996).
At the level of the forest stand, our estimate of annual total stem respiration of about 75 g C m−2 ground area represents about 9 % of the total carbon loss by the ecosystem respiration Re and consumed about 8 % of ecosystem GPP. This indicates that stem respiration is an important component for the scaling-up of ecosystem carbon budgets. Additionally, the contribution of stem respiration to Re and GPP is larger in the non-growing season than in the growing season, implying that stem respiration is a component of the total carbon budget that cannot be neglected.
Stem and air temperature are closely related (Tstem = 0·92 × Tair + 0·56, r2 = 0·98), and both are strong predictors of stem respiration, better than other environmental factors (Table 3).
In conclusion, there were obvious diurnal and seasonal changes in stem respiration. Stem temperature is closely related to air temperature and both are good predictors of stem respiration. It is assumed that PAR affects stem respiration through its effect on photosynthesis, which also affects tree growth. Inter-annual changes in stem respiration are mainly due to changes in maintenance respiration, which is closely dependent on temperature. It is suggested that temperature sensitivity and respiration potential are relatively constant from one year to another. Stem respiration contributes 9 % to the total carbon loss by the ecosystem respiration and consumes 8 % carbon of ecosystem GPP.
Acknowledgments
This work formed part of the Finnish Centre of Excellence Programme (2000–2005) carried out under the Centre of Excellence for Forest Ecology and Management (Project no. 64308) and of the Finnish–Chinese cooperation project ‘Responses of ecosystem processes in coniferous forests to climate change: a comparative study of coniferous forests in the boreal region and in the subalpine zone of western China’ (Project no. 200013), coordinated by Prof. Seppo Kellomäki, University of Joensuu, Faculty of Forestry. Funding provided by the Academy of Finland, the National Technology Agency (Tekes) and the University of Joensuu is gratefully acknowledged. We thank Matti Lemettinen, Alpo Hassinen and Risto Ikonen for maintaining the experimental equipment.
LITERATURE CITED
- Amthor JS. 1994. Plant respiratory responses to the environment and their effects on the carbon balance. In: Wilkinson RE, ed. Plant–environmental interactions. New York: Marcel Dekker, 501–554. [Google Scholar]
- Amthor JS. 2000. The McCree–de Wit–Penning de Vries–Thornley respiration paradigms: 30 years later. Annals of Botany 86: 1–20. [Google Scholar]
- Anekonda TS, Griddle RS, Libby WJ, Breidenbach RW, Hansen LD. 1994. Respiration rates predict differences in growth of coast redwood. Plant, Cell and Environment 17: 197–203. [Google Scholar]
- Aubinet M, Grelle A, Ibrom A, Rannik Ü, Moncrieff J, Foken T, Kowalski AS, Martin PH, Berbigier P, Bernhofer Ch, et al. 2000. Estimates of the annual net carbon and water exchange of European forests: the EUROFLUX methodology. Advances in Ecological Research 30: 113–175. [Google Scholar]
- Aubinet M, Heinesch B, Longdoz B. 2002. Estimation of the carbon sequestration by a heterogeneous forest: night flux corrections, heterogeneity of the site and inter-annual variability. Global Change Biology 8: 1053–1071. [Google Scholar]
- Carey EV, Callaway RM, DeLucia EH. 1997. Stem respiration of ponderosa pines grown in contrasting climates: implications for global climate change. Oecologia 111: 19–25. [DOI] [PubMed] [Google Scholar]
- Carey EV, Delucia EH, Ball JT. 1996. Stem maintenance and construction respiration in Pinus ponderosa grown in different concentrations of atmospheric CO2 Tree Physiology 16: 125–130. [DOI] [PubMed] [Google Scholar]
- Damesin C, Ceschia E, LeGoff N, Ottorini J-M, Dufrêne E. 2002. Stem and branch respiration of beech: from tree measurements to estimations at the stand level. New Phytologist 153: 159–172. [Google Scholar]
- Edwards NT, Shugart HH Jr, McLaughlin SB, Harris WF, Reichle DE. 1981. Carbon metabolism in terrestrial ecosystems. In: Reichle DE, ed. Dynamic properties of forest ecosystems. London, UK: Cambridge University Press, 499–536. [Google Scholar]
- Falge E, Baldocchi D, Tenhunen J, et al. 2002. Seasonality of ecosystem respiration and gross primary production as derived from FlUXNET measurements. Agricultural and Forest Meteorology 113: 53–74. [Google Scholar]
- Landsberg JJ, Gower ST. 1997.Applications of physiological ecology to forest management. San Diego: Academic Press. [Google Scholar]
- Lavigne MB. 1996. Comparing stem respiration and growth of jack pine provenances from northern and southern locations. Tree Physiology 16: 847–852. [DOI] [PubMed] [Google Scholar]
- Lavigne MB, Franklin SE, Hunt ERJ. 1996. Estimating stem maintenance respiration rates of dissimilar balsam fir stands. Tree Physiology 16: 687–695. [DOI] [PubMed] [Google Scholar]
- Lavigne MB, Ryan MG. 1997. Growth and maintenance respiration rates of aspen, black spruce, and jack pine stems at northern and southern BOREAS sites. Tree Physiology 17: 543–551. [DOI] [PubMed] [Google Scholar]
- Lavigne MB, Ryan MG, Anderson DE, Baldocchi DD, Crill PM, Fitzjarrald DR, Goulden ML, Gower ST, Massheder JM, McCaughey JH, et al. 1997. Comparing nocturnal eddy covariance measurements to estimates of ecosystem respiration made by scaling chamber measurements at 6 coniferous boreal sites. Journal of Geophysical Research 102: 28977–29985. [Google Scholar]
- Linder S, Troeng E. 1981. The seasonal variation in stem and course root respiration of a 20-year-old Scots pine. Mitteilungen der Forstlichen Bundesversuchsanstalt Wien 142: 125–139. [Google Scholar]
- Paembonan SA, Hagihara A, Hozumi K. 1991. Long-term measurement of CO2 relaease from the aboveground parts of a hinoki forest tree in relation to air temperature. Tree Physiology 8: 399–405. [DOI] [PubMed] [Google Scholar]
- Paembonan SA, Hagihara A, Hozumi K. 1992. Long-term respiration in relation to growth and maintenance processes of the aboveground parts of a hinoki forest tree. Tree Physiology 10: 101–110. [DOI] [PubMed] [Google Scholar]
- Pruyn ML, Gartner BL, Harmon ME. 2002. Respiratory potential in sapwood of old versus young ponserosa pine trees in the Pacific Northwest. Tree Physiology 22: 105–116. [DOI] [PubMed] [Google Scholar]
- Ryan MG. 1990. Growth and maintenance respiration in stems of Pinus contorta and Picea engelmannii Canadian Journal of Forest Research 20: 48–57. [Google Scholar]
- Ryan MG, Gower ST, Hubbard RM, Waring RH, Gholz HL, Cropper WP, Running SW. 1995. Woody tissue maintenance respiration of four conifers in contrasting climates. Oecologia 101: 133–140. [DOI] [PubMed] [Google Scholar]
- Ryan MG, Hubbard RM, Pongracic S, Raison RJ, McMurtrie RE. 1996. Foliage, fine-root, woody-tissue and stand respiration in Pinus radiata in relation to nitrogen status. Tree Physiology 16: 333–343. [DOI] [PubMed] [Google Scholar]
- Ryan MG, Linder S, Vose JM, Hubbard RM. 1994. Dark respiration in pines. Ecological Bulletin 43: 50–63. [Google Scholar]
- Stockfors J, Linder S. 1998. Effect of nitrogen on the seasonal course of growth and maintenance respiration in stems of Norway spruce trees. Tree Physiology 18: 155–166. [DOI] [PubMed] [Google Scholar]
- Vose JM, Ryan MG. 2002. Seasonal respiration of foliage, fine roots and woody tissues in relation to growth, tissue N, and photosynthesis. Global Change Biology 8: 182–193. [Google Scholar]
- Wang KY, Kellomäki S, Zha TS, Peltola H. 2004. Seasonal variation in energy and water fluxes in a pine forest: an analysis based on eddy covariance and an integrated model. Ecological Modelling 179: 259–279. [Google Scholar]
- Zabuga VF, Zabuga GA. 1985. Interrelationship between respiration and radial growth of the trunk in scotch pine. Soviet Plant Physiology 32: 718–723. [Google Scholar]
- Zha TS, Kellomäki S, Wang K-Y. 2003. Seasonal variation in respiration of 1-year-old shoots of Scots pine exposed to elevated carbon dioxide and temperature for 4 years. Annals of Botany 92: 89–96. [DOI] [PMC free article] [PubMed] [Google Scholar]
- Zha TS, Kellomäki S, Wang K-Y, Rouvinen I. 2004. Carbon sequestration and ecosystem respiration for 4 years in a Scots pine forest. Global Change Biology 10: 1492–1503. [Google Scholar]