

Abstract
• Background and Aims The amount of DNA per chromosome set is known to be a fairly constant characteristic of a species. Its interspecific variation is enormous, but the biological significance of this variation is little understood. Some of the characters believed to be correlated with DNA amount are alpine habitat, life history and breeding system. In the present study, the aim is to distinguish between direct causal connections and chance correlation of the amount of DNA in the genus Veronica.
• Methods Estimates of DNA amount were analysed for 42 members of Veroniceae in connection with results from a phylogenetic analysis of plastid trnL-F DNA sequences and tested correlations using standard statistical tests, phylogenetically independent contrasts and a model-based generalized least squares method to distinguish the phylogenetic effect on the results.
• Key Results There appears to be a lower upper limit for DNA amount in annuals than in perennials. Most DNAC-values in Veroniceae are below the mean DNA C-value for annuals in angiosperms as a whole. However, the long-debated correlation of low genome size with annual life history is not significant (P = 0·12) using either standard statistical tests or independent contrasts, but it is significant with the generalized least squares method (P < 0·01).
• Conclusions The correlation of annual life history and low genome size found in earlier studies could be due to the association of annual life history and selfing, which is significantly correlated with low genome size using any of the three tests applied. This correlation can be explained by models showing a reduction in transposable elements in selfers. A significant correlation of higher genome sizes with alpine habitats was also detected.
Key words: Annual life history, DNA content, genome size, independent contrasts, nucleotype, selfing, trnL-F region, Veronica, Veroniceae
INTRODUCTION
Understanding interspecific differences in the nuclear DNA amount per chromosome complement, generally referred to as the C-value, has been the goal of many studies. Whereas consequences of polyploid changes are less complicated to interpret, biological consequences of non-polyploid changes of DNA C-values are more difficult to understand. Numerous phenotypic characters have been associated with DNA C-values (DNA content of the chromosome complement) and with genome size (DNA content of the monoploid chromosome set) apart from the genetic effect. The terms ‘C-value’ and ‘genome size’ are used here in the sense of Bennett et al. (1998). Several theories have been invoked to explain these correlations (reviewed by Gregory, 2001). According to these theories, the extra DNA is something between junk and a selected factor with ‘nucleotypic effects’ (Bennett, 1971), pointing to its effect apart from the genotype. Correlations of this extra DNA range from those with total length, volume and mass of the chromosome and nuclear volume to climatically relevant parameters such as latitude and altitude (see Cavalier-Smith, 1985; Grant, 1987; Bachmann, 1993). Especially important is the correlation of C-value with nucleus size and cell size (Mirsky and Ris, 1951; Price et al., 1973) and duration of both mitotic and meiotic cell division (Van't Hof and Sparrow, 1963; Van't Hof, 1965; Bennett, 1972). Cell size changes with C-value, whereas nuclear and cell cycle change with genome size. Many authors (e.g. Grime et al., 1985) have argued that a larger genome and larger cells would lead to slower growth and that smaller genomes and cells allow faster growth, which has important ecological and evolutionary effects.
Ecological and evolutionary aspects that have been studied ranged from geographical distribution of plants (e.g. Bennett, 1976a) to consequences of a nuclear winter (Grime, 1986). The factor that has drawn most interest among those assumed to be correlated with DNA C-value and genome size is life form, especially those with an annual life history. Rees and Hazarika (1969) had already noticed a smaller genome in annual selfing species in comparison with perennial outbreeding species of Lathyrus. Bennett (1972) argued that annuals, especially ephemeral species, are characterized by low DNA amount because the DNA amount is positively correlated with both nuclear and cell size, as well as duration of the cell cycle. Annuals, which require faster development, are thus selected for lower DNA amount (Bennett, 1972). The annual life history is closely correlated with a selfing breeding system (Stebbins, 1957; Barrett et al., 1997). It is therefore not surprising that a correlation of genome size with breeding system has also been found (Price, 1976; Govindaraju and Cullis, 1991). Another factor that has sometimes been shown to be correlated with genome size is altitude (e.g. Bennett, 1976a) but no convincing argument for this observation has been found.
Two problems have hindered further elucidation of the reasons for these correlations: (1) the mechanisms of genome size variation are poorly understood (Petrov, 2001); (2) rigorous analyses in plants using a phylogenetic perspective are extremely scarce (Bharathan, 1996; Cox et al., 1998; Kellogg, 1998). Mechanisms for genome size variation have only recently become better understood. Apart from polyploidy, transposable element accumulation has been known for some time to increase genome size. However, a ‘one-way ticket to genomic obesity’ (Bennetzen and Kellogg, 1997) is unrealistic given the huge amount of variation in genome size across angiosperms.
The mechanisms that lead to a decrease were nevertheless speculative (Bennetzen and Kellogg, 1997). Proposed mechanisms for a genome size decrease include unequal crossing over (Wendel et al., 2002a), unequal intrastrand recombination (Bennetzen, 2002), a higher overall rate of deletions over insertions (Petrov, 2001, 2002; Comeron, 2001) and selection against transposable elements (Wright and Schoen, 1999; Morgan, 2001). Up to now few studies have been undertaken to distinguish between these scenarios of genome size change, partly due to the lack of appropriate model organisms and partly due to the lack of experimental methods (Petrov, 2001).
Apart from understanding mechanistic issues of genome size variation, rarity of phylogenetic analyses of genome size has slowed our understanding of genome size evolution. One obvious reason is a lack of matching data sets for DNA sequence data and genome size measurements. More importantly, however, methods for analysing this connection are relatively recent (Felsenstein, 1985; Harvey and Pagel, 1991). Additionally, many studies reported intraspecific variation of genome size of enormous amounts that would preclude any interspecific analysis. Rigorous re-analyses, however, have demonstrated that most of these reports are due to inadequate methods (Greilhuber, 1998) and have lead to a standard for good laboratory practice for genome size measurements (Dolezel et al., 1992, 1998; Greilhuber and Temsch, 2001; Vilhar et al., 2001) and assured comparability of different methods for quantifying genome size (Michaelson et al., 1991; Dolezel et al., 1992, 1998).
The genus Veronica is good for the study of genome size variations. Its diversity in habitat, ploidy level, life history and breeding system are remarkable. A special advantage is that these characteristics have evolved independently multiple times (Albach and Chase, 2001; Albach et al., 2004a, b), thus giving the opportunity for comparing parallel character changes in related species. This has the advantage of reducing phylogenetic effects in the analysis of genome size evolution and the possible sources of its variation. In particular, this allows us to test whether multiple parallel changes to an alpine habitat lead to parallel changes in genome size. Likewise, it is now possible to test whether multiple parallel shifts to an annual life history or to selfing lead to similar reductions in genome size. The presence of perennial-selfing and annual-self-incompatible species in Veronica makes it possible to distinguish the mostly coupled effects of life history and breeding system evolution on genome size.
Here the evolution of DNA C-value and genome size in Veroniceae is analysed with respect to a phylogenetic hypothesis derived from plastid DNA sequence data (trnL-F region). Feulgen densitometry and flow cytometry were used for the estimation of C-values. Both methods have shown good correspondence (Michaelson et al., 1991; Dolezel et al., 1992, 1998; Dimitrova and Greilhuber, 2000; Vilhar et al., 2001). Statistical analysis of genome size differences is problematic because conventional statistical methods consider species as independent samples, although they are evolutionarily related, which leads to increased rates of error when a larger sample is analysed (Harvey and Rambaut, 1998). Similarity may be associated with common descent rather than with any other factor. Genome size is a character that especially needs to be analysed in a phylogenetic context (Bharathan, 1996). Which method to use for the analyses is, however, a matter of debate. The two most commonly used methods are independent contrasts (Felsenstein, 1985) and the generalized least square method (Pagel, 1997, 1999). Both methods have advantages and disadvantages, which are mostly associated with the way they infer ancestral character states. With these difficulties in the methods of character correlation analysis, it is unjustified to rely on a single method at the moment. Comparing results from standard statistical tests, independent contrast analysis and maximum likelihood supported generalized least square analysis is the best way currently to judge significance of correlations.
MATERIALS AND METHODS
Plant material
A matching data set of 49 taxa was assembled for genome size estimates (42 taxa of Veroniceae including 39 new estimates; Table 1) and molecular analysis (trnL-F region; two new sequences; Table 2) covering most major groups in Veroniceae and all major clades in Veronica. Other genome size estimates were taken from the angiosperm DNA C-values database (www.rbgkew.org.uk/cval; original citation given in Table 1). Previously used sequences of trnL-F were published in Albach et al. (2004a, b). In a few instances, species closely related for genome size and molecular analysis were used instead of the same species (Parahebeperfoliata–vandewateri; Veronica armena–oltensis, V. multifida–thymoides, V. cinerea–tauricola, V. propinqua–bombycina subsp. bombycina, V. teucrium–turrilliana, V. orchidea–spicata, V. baumgartenii–aphylla, V. anagallis-aquatica–V. anagalloides, with the first indicating the species used for genome size and the latter the one used for trnL-F-sequences). Outgroups were Digitalis obscura and six Plantago spp.
Table 1.
Genome size estimates and voucher information/publication for species of Veroniceae and outgroups including vouchers
| Species |
Voucher/publication |
Method |
# |
Chromosome no. |
Ploidy level |
Genome size |
1C-value |
s.d. |
1 |
2 |
3 |
|---|---|---|---|---|---|---|---|---|---|---|---|
| Digitalis purpurea | Bennett and Smith (1991) | Fe | 56 | 8 | 0·31 | 1·23 | – | – | – | ||
| Parahebe perfoliata | RBGKew | Fl | 1 | 40 | 4 | 0·78 | 1·55 | 0 | 0 | 0 | |
| Picrorhiza kurrooa | McBeath 2214, K | Fl | 1 | 34 | 4 | 0·88 | 1·75 | 0 | 1 | 0 | |
| Plantago albicans | Bennett and Leitch (1995) | Fe | 30 | 6 | 0·65 | 1·95 | – | – | – | ||
| Plantago crassifolia | Bennett and Leitch (1995) | Fe | 20 | 4 | 0·74 | 1·48 | – | – | – | ||
| Plantago lagopus | Bennett and Leitch (1995) | Fe | 12 | 2 | 1·25 | 1·25 | – | – | – | ||
| Plantago lanceolata | Bennett and Smith (1991) | Fe | 12 | 2 | 1·2 | 1·2 | – | – | – | ||
| Plantago major | Bennett and Smith (1991) | Fe | 12 | 2 | 0·85 | 0·85 | – | – | – | ||
| Plantago media | Bennett and Smith (1991) | Fe | 24 | 4 | 0·23 | 0·93 | – | – | – | ||
| Veronica (Synthyris) missurica | Chase s.n., K (RBG Kew cult. 1986–266) | Fl | 2 | 24 | 4 | 0·66 | 1·32 | 0·003 | 0 | 0 | 0 |
| Veronica agrestis | Albach 386, WU | Fc | 4 | 28 | 4 | 0·37 | 0·73 | 0·012 | 1 | 0 | 1 |
| Veronica anagallis-aquatica | Albach 236, WU | Fc | 5 | 36 | 4 | 0·54 | 1·08 | 0·049 | 0 | 0 | 1 |
| Veronica armena | Albach 590, WU | Fc | 5 | 16* | 2 | 0·38 | 0·38 | 0·036 | 0 | 1 | 0 |
| Veronica arvensis | Albach 588, WU | Fc | 5 | 18 | 2 | 0·33 | 0·33 | 0·020 | 1 | 0 | 1 |
| Veronica baumgartenii | Albach 542, WU | Fc | 4 | 14 | 2 | 0·50 | 0·50 | 0·010 | 0 | 1 | ? |
| Veronica beccabunga | Bennett and Smith (1991) | Fe | 36 | 4 | 0·37 | 0·73 | 0 | 0 | ? | ||
| Veronica bellidioides | Albach S83, WU | Fe | 5 | 36 | 4 | 0·52 | 1·04 | 0·019 | 0 | 1 | 0 |
| Veronica chamaedrys | Albach s.n. (cult. Bot.Gart.Wien), WU | Fc | 4 | 32 | 4 | 0·74 | 1·49 | 0·047 | 0 | 0 | 0 |
| Veronica ciliata | Miehe 98–16717, GOET | Fe | 5 | 16 | 2 | 1·31 | 1·31 | 0·049 | 0 | 1 | ? |
| Veronica cinerea | Albach 587, WU | Fc | 4 | 16 | 2 | 0·32 | 0·32 | 0·016 | 0 | 1 | 0 |
| Veronica copelandii | Janeway 6581, WU | Fe | 5 | 18 | 2 | 0·83 | 0·83 | 0·030 | 0 | 1 | 0 |
| Veronica crista-galli | Albach 420, WU | Fe | 5 | 18* | 2 | 0·69 | 0·69 | 0·023 | 1 | 0 | 1 |
| Veronica cymbalaria | Albach 274, WU | Fc | 5 | 36 | 4 | 0·42 | 0·83 | 0·041 | 1 | 0 | 1 |
| Veronica donii | Albach 239, WU | Fc | 5 | 18 | 2 | 0·75 | 0·75 | 0·016 | 1 | 0 | 0 |
| Veronica filiformis | Albach 144, WU | Fc | 5 | 14 | 2 | 0·36 | 0·36 | 0·010 | 0 | 0 | 0 |
| Veronica gentianoides | Albach 350, WU | Fe | 4 | 48 | 6 | 0·62 | 1·86 | 0·06 | 0 | 1 | 0 |
| Veronica glauca | Albach 383, WU | Fc | 4 | 18 | 2 | 0·40 | 0·40 | 0·028 | 1 | 0 | ? |
| Veronica hederifolia | Albach 589, WU | Fc | 5 | 54 | 6 | 0·47 | 1·41 | 0·037 | 1 | 0 | 1 |
| Veronica insularis | Sun and Kim 12022, JNU | Fc | 5 | 34 | 4 | 0·31 | 0·62 | 0·026 | 0 | 0 | 0 |
| Veronica jacquinii | Albach 527, WU | Fc | 5 | 48 | 6 | 0·57 | 1·70 | 0·025 | 0 | 0 | 0 |
| Veronica kellererii | Albach 558, WU | Fc | 4 | 16 | 2 | 0·93 | 0·93 | 0·030 | 0 | 1 | 0 |
| Veronica lycica | Albach 266, WU | Fc | 5 | 18 | 2 | 0·44 | 0·44 | 0·052 | 1 | 0 | 0 |
| Veronica montana | Bennett and Smith (1991) | Fe | 18 | 2 | 0·85 | 0·85 | 0 | 0 | 0 | ||
| Veronica multifida | Albach 408, WU | Fc | 4 | 48 | 6 | 0·59 | 1·76 | 0·034 | 0 | 0 | 0 |
| Veronica orchidea | Fischer 21·7·00, WU | Fe | 5 | 34 | 4 | 0·40 | 0·80 | 0·016 | 0 | 0 | 0 |
| Veronica peregrina | Albach S92, WU | Fe | 5 | 52 | 6 | 0·32 | 0·95 | 0·048 | 1 | 0 | 1 |
| Veronica persica | Bennett and Smith (1976) | Fe | 28 | 4 | 0·39 | 0·78 | 1 | 0 | 1 | ||
| Veronica propinqua | Albach 327, WU | Fe | 4 | 16 | 2 | 0·64 | 0·64 | 0·016 | 0 | 0 | 0 |
| Veronica polita | Albach 234, WU | Fc | 5 | 14 | 2 | 0·42 | 0·42 | 0·010 | 1 | 0 | 1 |
| Veronica serpyllifolia | Albach 295, WU | Fe | 5 | 14 | 2 | 0·44 | 0·44 | 0·021 | 0 | 0 | 1 |
| Veronica syriaca | Albach 250, WU | Fc | 5 | 14 | 2 | 0·70 | 0·70 | 0·039 | 1 | 0 | 0 |
| Veronica teucrium | Albach 530, WU | Fc | 4 | 64 | 8 | 0·56 | 2·26 | 0·028 | 0 | 0 | 0 |
| Veronica triloba | Albach 232, WU | Fc | 4 | 18 | 2 | 0·61 | 0·61 | 0·019 | 1 | 0 | ? |
| Veronica triphyllos | Albach 244, WU | Fc | 5 | 14 | 2 | 0·71 | 0·71 | 0·029 | 1 | 0 | 1 |
| Veronica urticifolia | Albach S53, WU | Fe | 5 | 18 | 2 | 0·64 | 0·64 | 0·030 | 0 | 0 | 0 |
| Veronica verna | Albach 447, WU | Fe | 5 | 16 | 2 | 0·54 | 0·54 | 0·014 | 1 | 0 | 1 |
| Veronica vindobonensis | Albach 520, WU | Fc | 5 | 16 | 2 | 0·90 | 0·90 | 0·032 | 0 | 0 | 0 |
| Veronicastrum virginicum | Albach 591, WU | Fc | 4 | 34 | 4 | 0·66 | 1·31 | 0·034 | 0 | 0 | 0 |
| Wulfenia carinthiaca | Albach s.n., BONN | Fe | 5 | 18 | 2 | 1·35 | 1·35 | 0·060 | 0 | 1 | 0 |
Method: Fl, Flow cytometry; Fe, Feulgen densitometry using seedlings; Fc, Feulgen densitometry using field collected material.
Number of runs of 5000 cells or number of slides analysed.
Chromosome number estimated during this analysis, in other cases taken from the literature (see Materials and methods).
Character codings and values used in the statistical analyses are in the last columns (1, perennial/annual; 2, non-alpine/alpine; 3, outcrossing/selfing).
Table 2.
Information on trnL-F sequences used in the molecular phylogenetic analysis
| Species |
Voucher |
Origin |
First citation |
GenBank accession no. |
|---|---|---|---|---|
| Digitalis obscura | Chase 2469, K | Spain, Soria (cult. RBG Kew) | Albach et al. (2004a) | AF486418 |
| Parahebe vandewateri | Barker 59, K | Mt.Jaya, Irian Jaya | Albach et al. (2004a) | AF486381 |
| Picrorhiza kurrooa | McBeath 2214, K | Hampta Pass (cult. RBGKew) | Albach et al. (2004a) | AF486414 |
| Plantago albicans | Rønsted 25, C | cult. Copenhagen (C) | Rønsted et al. (2002) | AY101958 |
| Plantago crassifolia | Rønsted 17, C | Valencia, (cult. Copenhagen, C) | Rønsted et al. (2002) | AY101936 |
| Plantago lagopus | Rønsted 6, C | cult. Copenhagen (C) | Rønsted et al. (2002) | AY101951 |
| Plantago lanceolata | Rønsted 33, C | cult. Copenhagen (C) | Rønsted et al. (2002) | AY101952 |
| Plantago major | Rønsted 41, C | Sachsen-Anhalt, Germany | Rønsted et al. (2002) | AY101917 |
| Plantago media | Rønsted 50, C | cult. Copenhagen (C) | Rønsted et al. (2002) | AY101920 |
| Veronica (Synthyris) missurica | Chase s.n., K | cult. RBG Kew | Albach et al. (2004a) | AF486397 |
| Veronica agrestis | Albach 386, WU | Taygetos, Greece | Albach et al. (2004b) | AF513335 |
| Veronica anagalloides | Albach 307, WU | Terek valley, Georgia | Albach et al. (2004a) | AF486404 |
| Veronica aphylla | Zhang s.n., WU | Rollepass, South Tyrol, Italy | Albach et al. (2004b) | AF513349 |
| Veronica arvensis | Albach 147, WU | Stromberg near Bockenau, Germany | Albach et al. (2004a) | AF486380 |
| Veronica beccabunga | Albach 122, K | U.K. (cult. RBG Kew) | Albach et al. (2004a) | AF486403 |
| Veronica bellidioides | Albach 118, K | Carinthia, Nockberge, Hoher Falkert, Austria (cult. RBG Kew) | Albach et al. (2004b) | AF513345 |
| Veronica bombycina subsp. bombycina | Struwe 1403 WU | cult. NYBG | Albach et al. (2004a) | AF486376 |
| Veronica chamaedrys | Albach 121, K | Horsland, Os, Hattvik, Norway (cult. RBG Kew) | Albach et al. (2004a) | AF486377 |
| Veronica ciliata | Miehe et al., 98–33313, GOET | Qinghai, China | Albach et al. (2004a) | AF486385 |
| Veronica copelandii | Janeway 6557, WU | Klamath Range, California, USA | Albach et al. (2004b) | AF513344 |
| Veronica crista-galli | Dolmkanov 17·4.1983, TBS | Georgia | Albach et al. (2004a) | AF486367 |
| Veronica cymbalaria | Albach 130, WU | Halla Tekke, Cyprus | Albach et al. (2004a) | AF486365 |
| Veronica donii | Albach 239, WU | Cine to Yatagan, Turkey | Albach et al. (2004b) | AF513351 |
| Veronica filiformis | Albach 298, WU | Cross Pass, Georgia | Albach et al. (2004a) | AF486368 |
| Veronica gentianoides | Albach 72, BONN | cult. BG Bonn | Albach et al. (2004a) | AF486401 |
| Veronica glauca | M. Fischer 7·4·1999, WU | Lefkas, Greece | Albach et al. (2004a) | AF486395 |
| Veronica hederifolia | Albach 136, WU | Pedoulas, Cyprus | This study | AF510425 |
| Veronica insularis | Sun and Kim 12022, JNU | Ullung Islands, Korea | Albach et al. (2004a) | AF486406 |
| Veronica jacquinii | Albach 70, BONN | cult. BG Bonn | Albach et al. (2004a) | AF486375 |
| Veronica lycica | Albach 269, WU | near Kalkan, Turkey | Albach et al. (2004b) | AF513352 |
| Veronica montana | Albach 151, WU | Oberkassel, Germany | Albach et al. (2004a) | AF486388 |
| Veronica oltensis | Struwe 1405 WU | Turkey (cult. NYBG) | Albach et al. (2004b) | AF513339 |
| Veronica peregrina | Lesica 5668, NYBG | Flathead Co., Montana, USA | Albach et al. (2004b) | AF513352 |
| Veronica persica | Brummitt 19186, K | Troyet airport, Dept. Aube, France | Albach et al. (2004b) | AF513336 |
| Veronica polita | Albach 146, WU | Martinstein, Germany | Albach et al. (2004a) | AF486369 |
| Veronica saturejoides | Struwe 1408 WU | cult. NYBG | Albach et al. (2004a) | AF486384 |
| Veronica serpyllifolia | Albach 64, WU | Waldstrasse, Bonn, Germany | Albach et al. (2004a) | AF486400 |
| Veronica spicata | Albach 65, BONN | cult. BG Bonn | Albach et al. (2004a) | AF486405 |
| Veronica syriaca | Albach 252, WU | Side, Turkey | Albach et al. (2004a) | AF486398 |
| Veronica tauricola | Jobson 1008, NY | Turkey | Jobson and Albert (2002) | AF482606 |
| Veronica thymoides | Albach 601, WU | cult. BG Bonn | Albach et al. (2004a) | AF486373 |
| Veronica triloba | Albach 242, WU | near Aphrodisias, Turkey | Albach et al. (2004b) | AF513333 |
| Veronica triphyllos | Albach 244, WU | Aphrodisias, Turkey | Albach et al. (2004a) | AF486396 |
| Veronica turrilliana | Albach 278, WU | near Istanbul, Turkey | Albach et al. (2004a) | AF486374 |
| Veronica urticifolia | Albach 73, BONN | cult. BG Bonn | Albach et al. (2004a) | AF486389 |
| Veronica verna | Albach 149, WU | Bad Kreuznach, Germany | Albach et al. (2004a) | AF486379 |
| Veronica vindobonensis | M. A. Fischer s.n., WU | cult. BG Wien | This study | AF510426 |
| Veronicastrum virginicum | Chase s.n., K | cult. RBG Kew | Albach et al. (2004a) | AF486412 |
| Wulfenia carinthiaca | Albach 74, BONN | cult. BG Bonn | Albach et al. (2004a) | AF486409 |
Taxon sampling of the Hebe complex has been restricted to one representative for approx. 150 species because it is felt that genome size evolution in such a large subgroup would be a project of its own. Parahebe perfoliata was chosen as it is a species that is little derived within the Hebe complex (Wagstaff et al., 2002). An emphasis in taxon sampling has been on annual species. Names of clades follow the classification by Albach et al. (2004c). Voucher specimens were made for all of the plants used in this study (see Tables 1 and 2).
Feulgen densitometry
Nuclear C-values were mostly determined from Feulgen-stained meristems using video-based image analysis with CIRES (Cell Image Retrieval and Evaluation System, version 3.1) from Kontron (Munich), as described in Greilhuber and Ebert (1994) and Dimitrova and Greilhuber (2000) and following recommendations of best laboratory practice, as outlined in Greilhuber and Temsch (2001). Glycine max ‘Ceresia’ (1C = 1·165 pg) was used as a standard. Root tip meristems from young seedlings grown in Petri dishes were fixed together with root tips of the standard Glycine max ‘Ceresia’ in 4 % formaldehyde (in Sörensen phosphate buffer with 0·25 % Tween 80) for 1·5 h, thoroughly rinsed and then kept in methanol–acetic acid (3 : 1) at −20 °C until use. Field-collected young vegetative buds were fixed in 4 % formaldehyde for 2–10 h, rinsed, fixed in ethanol–acetic acid (3 : 1) for approx. 24 h and then left in 96 % ethanol. After return they were kept at −20 °C until further use. Root tips from the standard Glycine max ‘Ceresia’ were fixed for exactly the same time in 4 % formaldehyde as the respective accession after return and then treated in the same way. Ideally, seedlings of the standard should be taken to the field and fixed together with the probe immediately. Fixed material of the accession and its standard were hydrolysed together for 75 min in 5 m HCl at 20 °C in a water bath and then rinsed thoroughly in accordance with Greilhuber and Temsch (2001). Hydrolysed material was stained in Schiff's reagent for 1·5 h in the dark and afterwards washed in SO2 water (0·5 g potassium bisulphite in 0·05 n HCl) at room temperature for 45 min with six changes during that time. The material was then squashed in 45 % acetic acid as a softening medium. The cover slip was removed over a cold plate, and the slides were transferred to 96 % ethanol for a few minutes, air-dried and measured the next day. Either four or five slide pairs were measured for every accession. For each slide between 20 and 30 early telophases (equal numbers for accession and standard) were measured. Measurements of the IOD (integrated optical density) of the nucleus were performed using a monochromatic green filter and a ×63 oil immersion objective without application of a cover slip. The green image channel was selected, and the shading correction during image acquisition was activated. The mean grey value of an empty background image served as background value for computation of the microscope illumination before measuring each slide. Selected nuclei were segmented from the background and measured with the ‘interactive online nucleus segmentation’ mode. Only C-values of accessions with a standard deviation of <5 % between different slides are reported. In two events, chromosome counts were possible using this method when well-spread chromosome sets were encountered.
Flow cytometry
Nuclear C-values of three species (Picrorhiza kurrooa, Veronica (Synthyris) missurica and Parahebe perfoliata) were measured using flow cytometry. The protocol followed Obermayer et al. (1999). Approximately 15 mg of young leaf tissue from plants grown in the Royal Botanic Gardens, Kew, was chopped in 1·1 mL isolation buffer (0·1 m citric acid 1-hydrate, 0·5 % Triton X-100 from 5 % stock solution in distilled water) together with an equal amount of tissue from a standard (Petroselinum crispum; 1C = 2·25 pg) and then filtered through a nylon tissue. RNase (0·05 mL) was added and digested at 37 °C in a water bath. After 30 min 2 mL of staining solution (0·4 m Na2HPO4, 100 mm sodium citrate, 250 mm sodium sulphate, 60 µg mL−1) was added to half of the suspension of nuclei, mixed and incubated at least 20 min at room temperature. Two runs of 5000 nuclei each were measured on a PA II (Fa. Partec; Münster, Germany). Mean results are reported in Table 1. Differences in C-values in flow cytometric analyses in comparison with Feulgen densitometry (Dimitrova and Greilhuber, 2000) are accounted for by using C-values of the standard that are adjusted to the specific method used.
DNA sequencing and analysis
Total genomic DNA was extracted from herbarium material and silica-dried leaf samples according to the 2X CTAB procedure of Doyle and Doyle (1987) and then washed twice with 70 % ethanol. DNA pellets were dried and resuspended in TE-buffer ready for PCR.
The trnL intron, 3′ exon and trnL-F spacer were amplified in one piece using primers c and f of Taberlet et al. (1991) following the protocol used by Albach and Chase (2001) and Albach et al. (2004a). Aligned sequence matrices are available from the first author by request. Insertions and deletions are frequent in both regions. In a conservative approach, gaps were scored as missing data, thus removing them from the analysis. Matrices were analysed with PAUP* 4·0b10 (Swofford, 1998) using heuristic parsimony search methods. Multiple analyses using simple taxon addition with tree-bisection reconnection was conducted with MulTrees (keeping multiple shortest trees) in effect and a limit of 1000 trees. A bootstrap analysis with 500 replicates and subtree pruning-regrafting (SPR) branch swapping with a limit of 20 trees was used to assess relative support for clades. All clades present in at least 50 % of the bootstrap replicates are reported.
Statistical analysis
For illustrative purposes, the data of genome size were mapped on one of the most-parsimonious trees using squared-change parsimony (Fig. 1) using MacClade 4·01 (Maddison and Maddison, 2001). The continuous character genome size was classified in four discrete classes for illustrative purposes. The authors are aware that this classification is rather arbitrary but other classifications do not change the figure significantly. Mapping genome size on a tree makes a few assumptions necessary. For example, the inferences are dependent on taxon sampling. Retrieval of additional C-values for other species may potentially alter the results significantly. However, the most problematic assumption is that genome size evolves parsimoniously. Genome size was used as an ordered character with equal likelihood of a decrease or increase from one class of genome size to another, although it is easy to assume that decreases (or increases) are more likely than the reverse in a particular group.
Fig. 1.
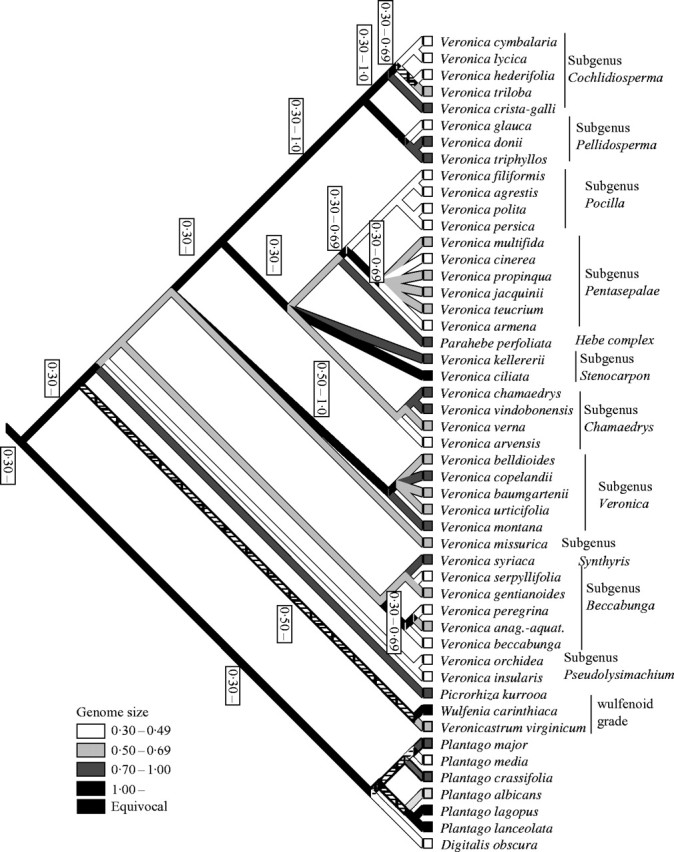
Genome size mapped on the strict consensus tree of the phylogenetic analysis of the trnL-F sequence data (ACCTRAN optimization). Numbers on the side of branches with equivocal result give the range of values found among species to which this branch leads.
A first statistical analysis was done using SPSS-Macintosh vers. 6.1.1.-package (SPSS Inc., Chicago, IL). Statistical correlations of two continuous variables were done using the Pearson two-tailed test, whereas the correlation of a continuous variable with a binary variable was tested using the Mann–Whitney U test.
The most commonly used method that incorporates phylogenetic relationships is the method of independent contrasts (Felsenstein, 1985; Harvey and Pagel, 1991), which has been shown to be a robust method (Martins and Garland, 1991; Martins, 1996). The method relies on the comparison of independent pairs of data points or taxa, represented either by terminals or nodes. In a bifurcating tree with n terminals, it is possible to find n − 1 independent pairs of such taxa and thus separate evolutionary events that can be compared. Independent contrasts are standardized differences calculated between these sister taxa at each node of the phylogeny. Values for internal nodes are estimated as averages of the values of the next lower nodes. One may argue that this inference of ancestral character states is not appropriate because it neglects parallel trends and depends on taxon sampling but error in ancestral character states seems to be less of a problem for independent contrasts (Oakley and Cunningham, 2000).
The method is implemented in the computer program CAIC (Purvis and Rambaut, 1995). CAIC has the advantage over other computer programs using independent contrast that it is possible to enter a phylogeny with polytomies. Therefore the strict consensus tree of the present analysis (Fig. 2) was used as the input phylogeny. Two analyses were conducted, one using branch lengths of one of the most-parsimonious tree (randomly chosen) and one omitting them. For reasons discussed above and the lack of significant differences with only increased significance in most cases (data not shown), results from the analysis including branch lengths are not presented. Ackerly (2000) showed that omitting branch lengths increases the type I error rate (results judged significant when they are not) in such analyses, but this is not the case in the present analyses. The BRUNCH-algorithm was used for dichotomous data (alpine species, annual species, selfing species), as suggested by Purvis and Rambaut (1995). All analyses were done for the whole data set and a subset containing only diploid taxa. Results were similar, so it was decided to present results from the whole data set only because of its greater statistical power.
Fig. 2.
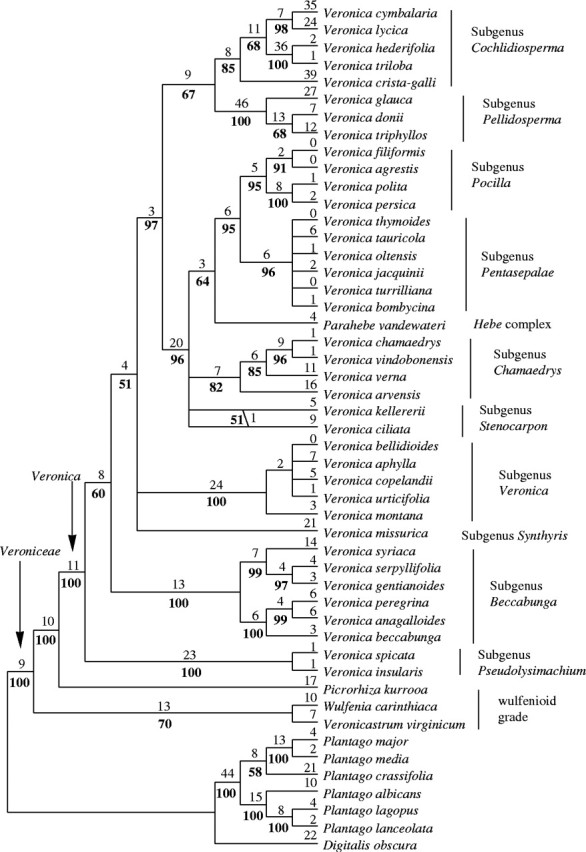
Strict consensus of 1000 most-parsimonious trees from the analysis of trnL-F sequence data. Numbers above the branches indicate estimated numbers of substitutions (ACCTRAN optimization) from one random most-parsimonious tree. Numbers below the branches indicate bootstrap percentages.
Recently, methods based on maximum likelihood and generalized least squares have also been used in comparative analyses to overcome problems of earlier methods (Pagel, 1997, 1999). Maximum likelihood methods are in some respect superior to parsimony methods because they can incorporate evolutionary models in their estimations. The correlations of DNA C-value and genome size were investigated using the generalized least squares method (GLS) as implemented in the computer program CONTINUOUS (Pagel, 1997, 1999). Scaling parameters, δ which scales the total path in the tree, λ which assesses the contribution of phylogeny to a character and κ which scales branch lengths in a tree, were optimized for DNAC-value and genome size. The correlations of both with life history, alpine habitat and breeding system were calculated from one random most-parsimonious tree with branches collapsing in the strict consensus tree set to have a length of 0·1 as suggested by M. Pagel in the manual distributed together with the program (http://sapc34.rdg.ac.uk/meade/Mark/files/ContinuousManual.pdf) because CONTINUOUS does not allow polytomies. Likelihood ratio tests were conducted testing a model with covariance between the two characters investigated set to zero against a model, in which the covariances vary with scaling parameters set to their optimal value for either DNA C-value or genome size.
Data on life history and habitat is based on data summarized in Albach et al. (2004a). Data on the breeding system in Veronica is scarce and rarely investigated rigorously. In those cases, which have not been investigated thoroughly, flower syndrome (Garnock-Jones, 1976; see discussion by Albach et al., 2004b) was relied on and species that did not fit any syndrome clearly were left out of the analysis (see Table 1). Chromosome numbers were taken from various sources in the literature if they were not observed during the estimation of genome size (see Results). Some species possess multiple ploidy levels. In some cases, the combination of geographical origin and morphology of the voucher specimen is enough to determine the cytotype (V. anagallis-aquatica, V. bellidioides, V. chamaedrys, V. jacquinii). In three instances (V. ciliata, V. gentianoides, V. propinqua) chromosome number has been estimated independently (D. C. Albach and Weiss, unpubl. res.). In the cases of V. cymbalaria and V. orchidea, a comparison with the other cytotype was possible (D. C. Albach, unpubl. res.; M. A. Fischer and D. C. Albach, in prep.). Character codings are provided in Table 1.
RESULTS
DNA sequence analysis
The analysis of trnL-F sequence data included 1336 characters, 261 of them potentially parsimony informative, but it did not find all the most-parsimonious trees. One thousand most-parsimonious trees were saved. They included 714 steps and a consistency index (CI) of 0·75 and a retention index (RI) of 0·86. The resulting strict consensus tree is shown in Fig. 2. The results do not differ significantly from other analyses of the trnL-F region in Veroniceae (Albach et al., 2004a, b). Subgenera Pseudolysimachium and Beccabunga are consecutive sisters to the remaining species of Veronica, whereas in Albach et al. (2004b) subgenus Veronica occupies this position, albeit weakly supported in both analyses. All analyses agree that subgenera Veronica, Beccabunga, Pseudolysimachium and Synthyris are sister to the remaining species. The position of all other subgenera is congruent among different analyses. Subgenera Cochlidiosperma and Pellidosperma are sister to the remainder. Within these the Hebe complex is sister to subgenera Pocilla and Pentasepalae. These differences are minor and so probably are their effects on the present correlation analyses. This justifies the present experimental design, in which only those taxa, for which genome size estimates were available, were sampled for the sequence analysis.
Chromosome counts
On occasion the estimation of genome sizes using Feulgen densitometry the chromosomes were well spread allowing the number of chromosomes to be counted. Earlier reports of 2n = 18 for Veronica crista-galli (origin: Lagodechi, Georgia) and 2n = 16 for V. armena (origin: Bot. Gard. Latvia) are confirmed here.
C-value and genome size
The 1C-value varied from 0·32 pg in V. cinerea to 2·26 pg in V. teucrium (mean 0·93 ± 0·48; Table 1 and Fig. 3A). Genome size varies 4·3-fold in Veronica from 0·30 pg per genome to 1·30 pg per genome in V. insularis and V. ciliata (mean 0·60 ± 0·24; Table 1 and Fig. 3B).
Fig. 3.
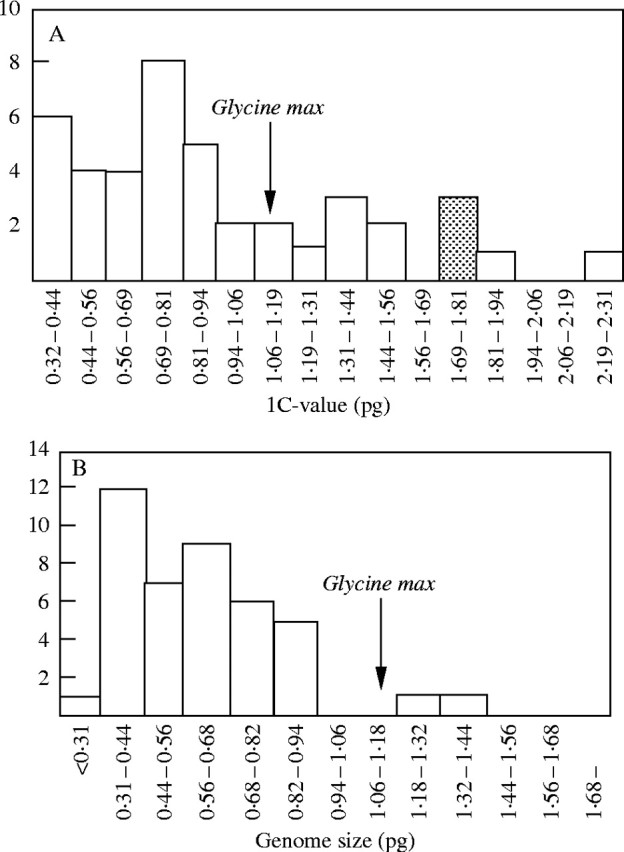
Distribution of known DNA C-values (A) and genome sizes (B) in Veroniceae.
Scaling parameters leading to the highest likelihood value for DNA 1C-value were κ = 0·07 (no correlation of character evolution with DNA substitution rate), δ = 0·22 (changes early in radiation more important) and λ = 0·99 (phylogenetic history has a large effect on character evolution). Scaling parameters leading to highest likelihood value for genome size were κ = 0 (again, no correlation of character evolution with DNA substitution rate), δ = 0·30 (again, changes early in radiation more important) and λ = 0 (phylogenetic history has no effect on character evolution). The effect of phylogenetic history on character evolution is not to be confused with effect of phylogenetic history on character correlation.
The 1C-value of alpine species varies between 0·32 and 1·74 pg (mean 1·03 ± 0·54), whereas that of non-alpine species varies between 0·33 and 2·26 pg (mean 0·90 ± 0·47). Genome size of alpine species varies between 0·32 and 1·35 pg (mean 0·75 ± 0·37), whereas that of non-alpine species varies between 0·31 and 0·90 pg (mean 0·55 ± 0·17). Alpine species of Veroniceae (Fig. 4) do not have a significantly higher or lower DNA C-value or genome size (Table 3, but see Discussion) unless one uses independent contrasts. With this method the relationship between alpine species and a higher genome size becomes significantly correlated (Table 3). The 1C-value of annuals varies between 0·33 and 1·41 pg (mean 0·69 ± 0·27), whereas that of perennials varies between 0·32 and 2·26 pg (mean 1·06 ± 0·53). Genome size of annuals varies between 0·33 and 0·75 pg (mean 0·5 ± 0·15), whereas that of perennials varies between 0·31 and 1·35 pg (mean 0·65 ± 0·27). The Mann–Whitney U test reveals a significant negative correlation of annual life history (Fig. 5) and DNA C-value (Table 3) but not with genome size. Taking phylogenetic information into consideration there is no significant correlation (Table 3) between 1C-value and annual life history. Between low genome size and annual life history a significant relationship is only found using the generalized least square (GLS) method but not with independent contrasts. The 1C-value of selfers varies between 0·33 and 1·41 pg (mean 0·74 ± 0·30), whereas that of out-crossers varies between 0·32 and 2·26 pg (mean 1·06 ± 0·54). Genome size of selfers varies between 0·32 and 0·71 pg (mean 0·47 ± 0·13), whereas that of out-crossers varies between 0·31 and 1·35 pg (mean 0·65 ± 0·24). Breeding system (Fig. 6) is significantly correlated with genome size but not DNA C-value using any test (Table 3).
Fig. 4.
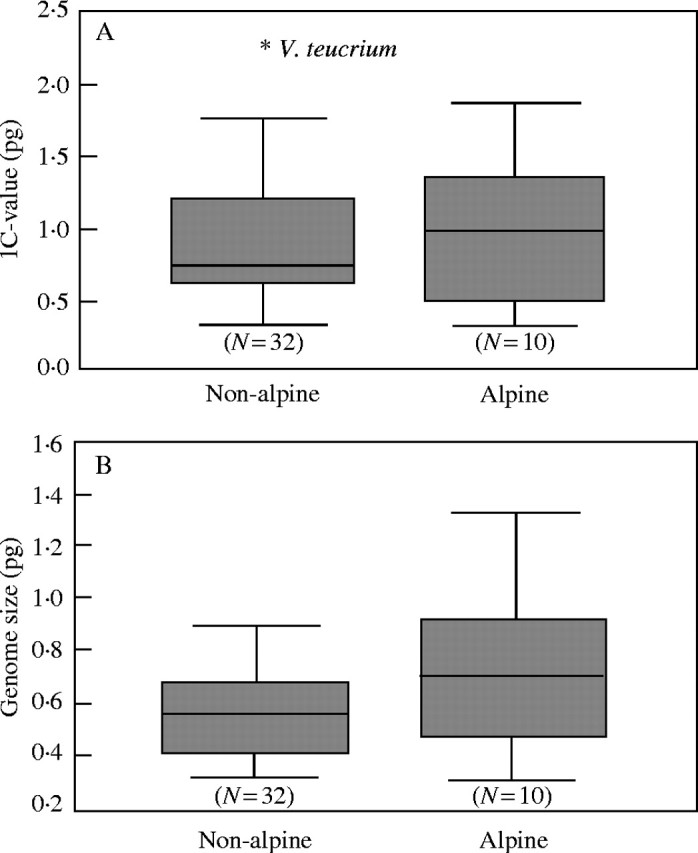
Boxplot indicating variation of DNA C-value (A) and genome size (B) among non-alpine and alpine taxa of Veroniceae. The shaded box indicates the interquartile (25–75 %) range. The bar within the box indicates the mean value. ‘Whiskers’ below and above the box indicate the range of values within three times the value of the upper or lower edge of the box.
Table 3.
Results of Mann–Whitney U test, independent contrast and generalized least square (GLS) analysis of correlations between DNA C-value and genome size by habitat, life history, breeding system and membership in Veronica
| Mann–Whitney U-test |
Independent contrasts |
GLS |
||||||||||
|---|---|---|---|---|---|---|---|---|---|---|---|---|
| Variables |
P |
d. f. |
R |
P |
d. f. |
R |
P |
|||||
| Alpine habitat (10 spp.) | 1C | 0·497 | 6 | 0·41 | 0·122 | 1 | 0·05 | 0·745 | ||||
| 1C/genome | 0·118 | 6 | 0·63 | 0·034* | 1 | 0·18 | 0·214 | |||||
| Annual life history (15 spp.) | 1C | 0·025* | 7 | −0·14 | 0·366 | 1 | −0·14 | 0·333 | ||||
| 1C/genome | 0·125 | 7 | −0·36 | 0·116 | 1 | −0·39 | 0·008* | |||||
| Selfing breeding system (12 spp.) | 1C | 0·112 | 9 | −0·09 | 0·397 | 1 | −0·20 | 0·211 | ||||
| 1C/genome | 0·016* | 9 | −0·55 | 0·014* | 1 | −0·32 | 0·044* | |||||
Asterisks indicate significance at P < 0·05.
Species numbers indicate number of species showing the derived state out of 42 species in the analysis.
Fig. 5.

Boxplot indicating variation of DNA C-value (A) and genome size (B) among perennial and annual taxa of Veroniceae. The shaded box indicates the interquartile (25–75 %) range. The bar within the box indicates the mean value. ‘Whiskers’ below and above the box indicate range of within three times the value of the upper or lower edge of the box.
Fig. 6.

Boxplot indicating variation of DNA C-value (A) and genome size (B) among outcrossing and selfing taxa of Veroniceae. The shaded box indicates the interquartile (25–75 %) range. The bar within the box indicates the mean value. ‘Whiskers’ below and above the box indicate range of within three times the value of the upper or lower edge of the box.
DISCUSSION
Comparison of methods to test correlations
For the tests of correlation, three different methods were used, the Mann–Whitney U test, independent contrasts and generalized least squares. The latter two should be preferred, because the samples are phylogenetically related, whereas Mann–Whitney U tests assume independent samples and increased statistical errors have been noted in comparative studies (Martins and Garland, 1991; Martins, 1996; Harvey and Rambaut, 1998). The other methods also involve several assumptions that need to be considered. Independent contrasts (Díaz-Uriarte and Garland, 1996) assume: (a) that the correct phylogenetic topology is available; (b) that within-species variation is negligible; (c) that character evolution can be modelled by a Brownian motion process (=equal probability for increase and decrease); and (d) that branch lengths of the phylogeny are available in units of expected variance of character evolution. Only the second assumption is met. The first is reasonably certain, although the true phylogeny can never be known. The third assumption is the most difficult. Evolutionary trends, such as a general trend towards lower or higher genome size, may prevent the evolution of genome size behaving randomly and give estimates for internal nodes that are either too large or too small, although simulations did not find inflated errors in these moderate deviations from Brownian motion models as long as there were no boundaries (Díaz-Uriarte and Garland, 1996). Even though the fourth assumption is met because branch lengths are available from the analysis of DNA sequence data, equal branch lengths were chosen because there are multiple most-parsimonious trees with different branch length estimates, and the portion of DNA used in the present analysis represents only a tiny portion of the genome. Further, the use of unequal branch lengths implies a correlation of the substitution rate of the DNA region with the rate of change in genome size. A speciation model with most changes occurring immediately after speciation is more realistic because such a correlation of DNA sequence and genome size changes is unlikely. Intraspecific stability of genome size (Greilhuber, 1998) and reports of rapid genome reorganization after speciation in diploids (Rieseberg et al., 1995; Rieseberg, 1998) and polyploids (Song et al., 1995; Ozkan et al., 2001) imply that genome size differences are not correlated with time since divergence or rate of mutation accumulation. Therefore, genome size differences seem to be associated with the number of speciation events, which are, however, impossible to estimate because it is not known what percentage of these speciation events was successful, i.e. survived. Additionally, different kinds of speciation may have different impacts on genome organization (Harrison, 1991). More intense founder effects and less hybridization in annuals compared with perennials (Ehrendorfer, 1970) cause it to be assumed that there are a greater number of and more dramatic effects in annuals than in perennials. This effect will be counter-balanced by a greater representation of annuals in the present data set. Assuming a speciational model disregarding branch lengths (following Martins and Garland, 1991) is therefore more realistic for the study of genome size evolution than a Brownian motion model, which is supported independently by the low values of κ estimated by the generalized least squares method.
Whereas the generalized least squares method has the advantage that evolutionary models can be incorporated in its estimations, it has problems of its own (Cunningham et al., 1998; Martins, 1999). If an evolutionary model is mis-specified, these methods can give worse estimates (Martins, 1999). Estimates of branch lengths can be incorporated in analyses using maximum likelihood but again errors in their estimation may worsen the accuracy of the analyses. Whereas branching order in the present phylogeny of Veronica is highly similar in analyses using different DNA regions and taxon sampling (Albach and Chase, 2001; Albach et al., 2004a, b), branch lengths are variable and a possible source of error. Statistical significance in one of the three methods should therefore be viewed sceptically and only by amalgamating the results from all three methods can a significant correlation be detected with reasonable confidence.
Polyploids
DNA C-value in polyploids should be the sum of its parents C-values. However, deviations from this pattern have been noted, with polyploids normally showing less than the expected genome size (reviewed by Grant, 1987; Soltis and Soltis, 1999). Polyploidy is common in Veronica and several polyploid taxa were analysed together with closely related diploid taxa (or taxa of a lower ploidy level). Genome sizes differ from <1 % between the present hexaploid sample of Veronica jacquinii and octoploid V. teucrium to 23 % between the hexaploid V. hederifolia and diploid V. triloba. Reasons for differences between these pairs may be different biology (see below), different times since divergence between these species and consequently more divergent genome sizes, influence from a different genome size of the unsampled parent, or genomic changes subsequent to polyploid formation. The greater the difference between the parental genomes, the greater the subsequent genomic changes, such as translocations, increased transposon activity and methylation, in the offspring polyploid (Soltis and Soltis, 1999). However, the taxon at the higher ploidy level always has the lower genome size. This supports other investigations that have demonstrated rapid elimination of DNA sequences after polyploid formation (Feldman et al., 1997; Wendel, 2000; Ozkan et al., 2001). Until more is known about the origin of the polyploid taxa in question it is pointless to discuss further the reasons for the reductions in these particular cases.
Alpine habitat
Studies in various groups of grasses (teosinte, Laurie and Bennett, 1985; maize, Rayburn and Auger, 1990; Secale, Bennett, 1976b) found an increase in genome size with higher altitude, but this correlation has not been tested thoroughly in any dicotyledonous plant group. In Californian plant species, Knight and Ackerly (2002) detected a trend of species with highest DNA amount in intermediate altitudes. In the Macaronesian flora, some groups show an increase, some a decrease with altitude (Suda et al., 2003). However, giving specific altitudinal ranges for a species is difficult. Therefore, species were classified as either alpine or non-alpine. A correlation of genome size with alpine habitat in the data set is not significant using the Mann–Whitney U test (Table 3). However, excluding Veronica armena and V. cinerea, the alpine species with lower genome size from subgenus Pentasepalae, the result becomes significant for genome size (P < 0·01). These two related outliers may be the reason why the test of independent contrast also shows a significantly larger genome size in alpine plants (Table 3). It should be noted that contrasts were made only between perennials for the comparison of alpine and non-alpine taxa and, therefore, life history cannot explain the correlation. Alpine species from Turkish mountains are probably derived recently from lowland taxa (Albach et al., 2004a) in contrast to species from other European or central Asian mountain systems. These two species may therefore be derived from lowland taxa adapted to xeric conditions in the Near East and have an ancestral low genome size.
According to Grime and Mowforth (1982) (see also Grime et al., 1985) large genome sizes are correlated with the capacity for growth at low temperatures and frost resistance (MacGillivray and Grime, 1995). This correlation is due to the advantage of growth by cell division conducted in the preceding favourable season and cell expansion early in the season at low temperatures (Grime and Mowforth, 1982). Large genomes in alpine plants may also be tolerated more readily because soils are generally more phosphate-rich at higher altitudes (Körner, 1989)—phosphate is often a limiting nutrient for DNA biosynthesis and plant growth (Raven et al., 1986). It may be that there is also a correlation of high genome size with phosphate-rich soil (Hanson et al., 2001a). If this is the case, a correlation of alpine habitats with large genomes would not be unexpected. However, Bennett (1987) argued against a correlation of high DNA amount with alpine or Arctic environment because of increased UV-damage with larger genomes (Sparrow and Miksche, 1961), although most genome size variation derives from repetitive DNA and heterochromatin (Rayburn et al., 1985; Tito et al., 1991; Greilhuber, 1995).
Annual life history
With the current taxon sampling, a significant correlation was found between annual life history and low genome size using only the GLS method (Table 3). This lack of significance using either the standard or independent contrast analysis is surprising because the correlations of low DNA amount and genome size with annual life history was one of the first published and is one of the most cited correlations of genome size and ecological or evolutionary factors. Bennett (1972) demonstrated that short mitotic and meiotic cycle times are positively correlated with annual life history, and annual (or facultative perennial) life history and lower nuclear DNA amount is likewise correlated. However, the latter correlation has not always been supported (Knight and Ackerly, 2002) and is not a strict correlation, because low genome size does not require annual life history. The present results (Fig. 5) do support the second important conclusion of Bennett (1972) about the existence of an upper boundary in DNA amount for annual species that is lower than that for perennials. The upper boundary of DNA amount for annuals constitutes the maximum amount of DNA that the plant is able to replicate quickly enough to complete the life cycle within one growing period and thus a low DNA amount is a pre-condition for the evolution of the annual life history. Thus, a lack of correlation between genome size and annual life history could be explained by the low genome size of many perennial species in Veronica. The significant correlation of annual life history and DNA C-value, without taking phylogenetic information into consideration, in comparison with the non-significance of a correlation with genome size can be therefore easily explained by the less frequent occurrence of polyploidy in annual species, which would otherwise exceed this upper boundary. Not surprisingly, the outlier in the boxplot of DNA amount in annuals (Fig. 5) is one of the few hexaploid annual species of Veronica (V. hederifolia). It is notable that this upper boundary for DNA amount in annuals seems to vary from taxon to taxon, because the upper boundary in Veronica (approx. 1·5 pg; Fig. 5) is much smaller than the value given by Bennett et al. (1998; 3·9 pg for 1C-value of weeds and non-weeds combined) for the average of all annual species. This upper boundary also leads to a reduced variance in annuals compared with perennials (0·07 vs. 0·28 for 1C-value; 0·02 vs. 0·07 for genome size, neither significant according to Siegel–Tukey rank dispersion test; P = 0·92 and P = 0·65, respectively).
A further explanation for an insignificant correlation between genome size and annual life history would be that they are parallel adaptations to more xeric and unstable habitats but not causally connected. These habitats require (a) a strategy to survive drought periods, which annuals do as seeds and (b) faster growth after germination, which requires a lower DNA amount. Additionally, small mesophyll cells are more drought resistant and consequently the requirement for smaller cells further selects for low DNA amount (Price, 1988; Castro-Jimenez et al., 1989). Kalendar et al. (2000) demonstrated that stress induces a transposon number decrease in drier habitats, which can explain the mechanism of decrease in genome size. Following this explanation, annuals would decrease their number of transposons (and DNA amount). However, a strong correlation between genome size and life history would not be necessary, because genome size and life history are influenced by several factors that can hide the correlation between the two.
Comparing annuals and perennials that are sister taxa (Table 4) reveals only this lack of strong correlation. Factors that may hide a correlation of life history with genome size in Veronica may be breeding system (see below) or polyploidy (see above). Genome size reduction in V. peregrina parallel to polyploidization is to some degree combined with dysploid reduction in chromosome number. A decrease in DNA amount with Robertsonian fusion of chromosomes was also found in Callitriche (Pijnacker and Schotsman, 1988). Veronica serpyllifolia may be only facultatively perennial (Boutin and Harper, 1991), which may explain its low genome size because for facultative perennials the same arguments are valid as for annuals (Bennett, 1972) but other factors may explain this as well (see below). The small difference between V. agrestis and V. filiformis is in line with the low genetic difference found in DNA sequence analyses pointing to a recent divergence (Fig. 2; Albach et al., 2004b). For both V. serpyllifolia and V. filiformis vegetative reproduction may be an explanation for their low genome size. Rees and Jones (1967) found a higher DNA amount in annual species of Lolium than in perennial species, which they explained by vegetative reproduction by tillering, among other factors. If a higher amount of vegetative reproduction is, indeed, correlated with lower DNA amount, this may explain the lower DNA amount of V. serpyllifolia and V. filiformis. However, data to support this hypothesis are scant at the moment.
Table 4.
Comparison of genome sizes between annual and perennial sister taxa
| Annual species |
Genome size |
Difference |
Genome size |
Perennial taxon |
|---|---|---|---|---|
| V. peregrina (6x) | 0·32 | –41 % | 0·54 | V. anagallis-aquatica (4x) |
| V. verna (2x) | 0·54 | –40 %/–27 % | 0·90/0·74 | V. vindobonensis (2x)/V. chamaedrys (4x) |
| V. agrestis (4x) | 0·37 | 2 % | 0·36 | V. filiformis (2x) |
| V. syriaca (2x) | 0·70 | 59 %/13 % | 0·44/0·62 | V. serpyllifolia (2x)/V. gentianoides (6x) |
Hanson et al. (2001a) suggested that small genome size may not reflect the necessity for rapid growth but the lack of nutrients, especially phosphorus needed for DNA biosynthesis, based on low genome sizes in carnivorous plants. In the case of annual plants, it is unlikely that they grow on soil that is significantly poorer in phosphate but rather phosphate uptake may be a problem due to paucity of soil moisture required for phosphate uptake per time unit. This hypothesis is supported by a study in Berberis (Bottini et al., 2000) and by the low genome size (1C = 0·09 pg per monoploid genome) of Canotia holacantha, a woody shrub from North American deserts (Hanson et al., 2001b). Whether desert plants in general have a lower genome size than plants from more mesic habitats remains to be studied, although results in annual species of Helianthus (Sims and Price, 1985) argue against generalization.
Breeding system
The association of annual life history with a selfing breeding system (Stebbins, 1957; Ehrendorfer, 1970; Barrett et al., 1997) has been known for even longer than the association with genome size (Bennett, 1972). The clear statistical support for a correlation of genome size and selfing breeding system using either test but only using the GLS method with annual life history in Veronica (Table 3) is contrary to expectations. Comparing genome sizes in related species with higher genome size differing in breeding system and life history will be necessary to evaluate the generality of the results here. A correlation of selfing with low genome size has also been found across 176 seed plants (Govindaraju and Cullis, 1991) and in Allium (Labani and Elkington, 1987) but not in Lolium (Rees and Jones, 1967). Comparing selfing species with their outcrossing sister species (Table 5), selfing species have consistently lower genome sizes as expected (Table 3). However, as in the case of annual species, different factors other than breeding system may account for the difference.
Table 5.
Comparison of genome sizes between selfing and outcrossing sister taxa
| Selfing species |
Genome size |
Difference |
Genome size |
Outcrossing species |
|---|---|---|---|---|
| V. triphyllos | 0·71 | −5 % | 0·75 | V. donii |
| V. cymbalaria | 0·42 | −5 % | 0·44 | V. lycica |
| V. hederifolia | 0·47 | −23 % | 0·61 | V. triloba |
Note: V. triloba is likely to be outcrossing but has not been scored as outcrossing in the analysis.
Changes in genome size affect the whole genome not specific parts (Petrov, 2001) and different mechanisms and parts of the genome have been proposed responsible (Bennetzen, 2002), such as intron length (Hughes and Hughes, 1995; Comeron, 2001; but see Ophir and Graur, 1997; Wendel et al., 2002b), transposons (Bennetzen, 2000) or repetitive heterochromatic DNA sequences (Rayburn et al., 1985; Tito et al., 1991; Greilhuber, 1995). However, generally, the exact mechanisms of genome size decreases are not known (Bennetzen, 2002; Bennetzen and Kellogg, 1997, but see Petrov et al., 1996; Comeron, 2001; Petrov et al., 2001; Wendel et al., 2002a) but a change in transposable element number is the favoured explanation (Bennetzen, 2000; Petrov, 2001; Wendel et al., 2002a).
A lower number of transposable elements in selfers is contrary to theoretical expectations assuming ectopic exchange controlling transposon number (Charlesworth and Charlesworth, 1995) but not assuming a deleterious recessive model (Wright and Schoen, 1999; Morgan, 2001). These models differ in their expectation of what causes the deleterious effect of transposable element insertion. Under the ectopic exchange model deleterious effects are caused by unequal crossing-over between elements at non-homologous insertion sites, which lead to harmful chromosomal rearrangements. The deleterious recessive model, on the other hand, assumes deleterious effects caused by insertions causing disruption of gene function. The models differ in their expectations of transposable element numbers in selfing species (Wright and Schoen, 1999; Morgan, 2001). Whereas the ectopic exchange model hypothesizes transposable element number increase because under inbreeding conditions translocations would more often be homozygous and meiotically not disturbing (due to a lower number of harmful unequal crossing-overs), under the deleterious recessive model transposable element numbers are reduced in selfers due to the greater homozygosity in selfing species, which increases the strength of selection against deleterious insertions that cannot be hidden by recessivity. Lower genome size of selfing Veroniceae would therefore further support the importance of the deleterious recessive model over the ectopic exchange model of transposable element regulation.
In Microseris, Price et al. (1981a, b) found lower DNA amounts in populations from more stressful and time-limited habitats in Microseris bigelovii (Price et al., 1981a) and M. douglasii (Price et al., 1981b). Selfing rates at natural sites were not estimated, but at least in M. bigelovii DNA amounts were lowest in marginal populations (Price et al., 1981a). Such populations generally tend to have higher selfing rates (Silvertown and Charlesworth, 2001, p. 45). It is therefore possible that higher selfing rates in these populations allowed adaptation to more stressful environments by lowering DNA amount through reduction in transposable element numbers in these populations. In line with this argument are findings that stressed inbred lines in the glasshouse had only marginally lower genome size than the non-stressed inbred control lines (Price et al., 1986). Results of lower transposable element number in barley in more arid habitats (Kalendar et al., 2000) may be explained in such a way. It must, however, be pointed out that different models of transposable element regulation may be important in different taxa because Lycopersicon seems to support the ectopic exchange model (Charlesworth and Charlesworth, 1995). Finally, other factors such as population size and transposition rate evolution may contribute to differences in transposable element number among selfing and outcrossing species (Charlesworth and Wright, 2001; Wright et al., 2001). It is therefore necessary to investigate more groups with contrasting breeding systems to either support the present conclusions as a general phenomenon or to find other reasons to explain the correlations found.
Acknowledgments
We thank the Studienstiftung des deutschen Volkes for a doctoral scholarship to D.C.A., E. Temsch, D. Dimitrova and R. Obermayer for technical assistance, R. Obermayer and I. Leitch for critically reading the manuscript and D. Hanfland for help in the field. We are grateful to Dr M. D. Bennett for allowing us to use the flow cytometer at the Jodrell Laboratory, Royal Botanic Gardens, Kew.
LITERATURE CITED
- Ackerly, DD. 2000. Taxon sampling, correlated evolution, and independent contrasts. Evolution 54: 1480–1492. [DOI] [PubMed] [Google Scholar]
- Albach DC, Chase MW. 2001. Paraphyly of Veronica (Veroniceae;Scrophulariaceae): evidence from the internal transcribed spacer (ITS) sequences of nuclear ribosomal DNA. Journal of PlantResearch 114: 9–18. [Google Scholar]
- Albach DC, Martínez-Ortega MM, Chase MW. 2004.Veronica: parallel morphological evolution and phylogeography in the Mediterranean. Plant Systematics and Evolution 246: 177–194. [Google Scholar]
- Albach DC, Martínez-Ortega MM, Chase MW, Fischer MA. 2004. Evolution of Veroniceae: a phylogenetic perspective. Annals of the Missouri Botanical Garden 91: 275–302. [Google Scholar]
- Albach DC, Martínez-Ortega MM, Chase MW, Fischer MA. 2004. Classification of Veroniceae: problems and possible solution. Taxon 53: 429–452. [Google Scholar]
- Bachmann K. 1993. Effects of stress on the genome. In: Fowden L, Mansfield T, Stoddart J, eds. Plant adaptations to environmental stress. London: Chapman and Hall, 275–292. [Google Scholar]
- Barrett SCH, Harder LD, Worley AC. 1997. The comparative biology of pollination and mating in flowering plants. In: Silvertown J, Franco M, Harper JL, eds. Plant life histories: ecology, phylogeny, and evolution. Cambridge: Cambridge University Press, 57–76. [Google Scholar]
- Bennett MD. 1971. The duration of meiosis. Proceedings of the Royal Society London, Series B, Biological Sciences 178: 277–299. [Google Scholar]
- Bennett MD. 1972. Nuclear DNA content and minimum generation time in herbaceous plants. Proceedings of the Royal Society London, Series B, Biological Sciences 181: 109–135. [DOI] [PubMed] [Google Scholar]
- Bennett MD. 1976. DNA amount, latitude, and crop plant distribution. Environmental and Experimental Botany 16: 93–108. [Google Scholar]
- Bennett MD. 1976. DNA amount, latitude and crop plant distribution. In: Jones K, Brandham PE, eds. Current chromosome research. Amsterdam: North-Holland, 151–158. [Google Scholar]
- Bennett MD. 1987. Variation in genomic form in plants and its ecological implications. New Phytologist 106 (Suppl): S177–S200. [Google Scholar]
- Bennett MD, Leitch IJ. 1995. Nuclear DNA amounts in angiosperms. Annals of Botany 76: 113–176. [Google Scholar]
- Bennett MD, Leitch IJ, Hanson L. 1998. DNA amounts in two samples of angiosperm weeds. Annals of Botany 82 (Suppl. A): 121–S134. [Google Scholar]
- Bennett MD, Smith JB. 1976. Nuclear DNA amounts in angiosperms. Philosophical Transactions of the Royal Society, Series B 274: 227–274. [DOI] [PubMed] [Google Scholar]
- Bennett MD, Smith JB. 1991. Nuclear DNA amounts in angiosperms. Philosophical Transactions of the Royal Society, Series B 334: 309–345. [DOI] [PubMed] [Google Scholar]
- Bennetzen JL. 2000. Transposable elements contributions to plant gene and genome evolution. Plant Molecular Biology 42: 251–269. [PubMed] [Google Scholar]
- Bennetzen JL. 2002. Mechanisms and rates of genome expansion and contraction in flowering plants. Genetica 115: 29–36. [DOI] [PubMed] [Google Scholar]
- Bennetzen JL, Kellogg, EA. 1997. Do plants have a one-way ticket to genomic obesity. Plant Cell 9: 1509–1514. [DOI] [PMC free article] [PubMed] [Google Scholar]
- Bharathan G. 1996. Reproductive development and nuclear DNA content in angiosperms. American Journal of Botany 83: 440–451. [Google Scholar]
- Bottini MCJ, Greizerstein EJ, Aulicino MB, Poggio L. 2000.Relationships among genome size, environmental conditions and geographical distribution in natural populations of NW Patagonian species of Berberis L. (Berberidaceae). Annals of Botany 86: 565–573. [Google Scholar]
- Boutin CJ, Harper L. 1991. A comparative study of the population dynamics of five species of Veronica in natural habitats. Journal of Ecology 79: 199–221. [Google Scholar]
- Castro-Jimenez Y, Newton RJ, Price HJ, Halliwell RS. 1989. Drought stress responses of Microseris species differing in nuclear DNA content. American Journal of Botany 76: 789–795. [Google Scholar]
- Cavalier-Smith T. 1985. Introduction: the evolutionary significance of genome size. In: Cavalier-Smith T, ed. The evolution of genome size. Chichester: John Wiley and Sons, 1–32. [Google Scholar]
- Charlesworth D, Charlesworth B. 1995. Transposable elements in inbreeding and outbreeding populations. Genetics 140: 415–417. [DOI] [PMC free article] [PubMed] [Google Scholar]
- Charlesworth D, Wright SI. 2001. Breeding systems and genome evolution. Current Opinion in Genetics and Development 11: 685–690. [DOI] [PubMed] [Google Scholar]
- Comeron JP. 2001. What controls the length of noncoding DNA? Current Opinion in Genetics and Development 11: 652–659. [DOI] [PubMed] [Google Scholar]
- Cox AV, Abdelnour GJ, Bennett MD, Leitch IJ. 1998. Genome size and karyotype evolution in the slipper orchids (Cypripedioideae: Orchidaceae). American Journal of Botany 85: 681–687. [PubMed] [Google Scholar]
- Cunningham CW, Omland KE, Oakley TH. 1998. Reconstructing ancestral character states: a critical reappraisal. Trends in Ecology and Evolution 13: 361–366. [DOI] [PubMed] [Google Scholar]
- Díaz-Uriarte R, Garland T. 1996. Testing hypotheses of correlated evolution using phylogenetically independent contrasts: sensitivity to deviations from Brownian motion. Systematic Biology 45: 27–47. [Google Scholar]
- Dimitrova D, Greilhuber J. 2000. Karyotype and DNA-content evolution in ten species of Crepis (Asteraceae) distributed in Bulgaria. Botanical Journal of the Linnean Society 132: 281–297. [Google Scholar]
- Dolezel J, Greilhuber J, Lucretti S, Meister A, Lysak MA, Nard L, Obermayer R. 1998. Plant genome size estimation by flow cytometry: inter-laboratory comparison. Annals of Botany 82 (Suppl. A): 17–26. [Google Scholar]
- Dolezel J, Sgorbati S, Lucretti S. 1992. Comparison of three DNA fluorochromes for flow cytometric estimation of nuclear DNA content in plants. Physiologia Plantarum 85: 625–631. [Google Scholar]
- Doyle JJ, Doyle JL. 1987. A rapid DNA isolation procedure for small quantities of fresh leaf tissue. Phytochemical Bulletin of the Botanical Society of America 19: 11–15. [Google Scholar]
- Ehrendorfer F. 1970. Evolutionary patterns and strategies in seed plants. Taxon 19: 185–195. [Google Scholar]
- Feldman M, Liu B, Segal G, Abbo S, Levy AA, Vega JM. 1997. Rapid elimination of low-copy DNA sequences in polyploid wheat: a possible mechanism for differentiation of homoeologous chromosomes. Genetics 147: 1381–1387. [DOI] [PMC free article] [PubMed] [Google Scholar]
- Felsenstein J. 1985. Phylogenies and the comparative method. American Naturalist 125: 1–15. [Google Scholar]
- Garnock-Jones PJ. 1976. Breeding systems and pollination in New Zealand Parahebe (Scrophulariaceae). New Zealand Journal of Botany 14: 291–298. [Google Scholar]
- Govindaraju DR, Cullis CA. 1991. Modulation of genome size inplants: the influence of breeding systems and neighbourhood size. Evolutionary Trends in Plants 5: 43–51. [Google Scholar]
- Grant WF. 1987. Genome differentiation in higher plants. In: Differentiation patterns in higher plants. New York: Academic Press, 9–32. [Google Scholar]
- Gregory TR. 2001. Coincidence, coevolution, or causation? DNA content, cell size, and the C-value enigma. Biology Reviews 76: 65–101. [DOI] [PubMed] [Google Scholar]
- Greilhuber J. 1995. Chromosomes of the monocotyledons (generalaspects). In: Rudall PJ, Cribb PJ, Cutler DF, Humphries CJ, eds. Monocotyledons: systematics and evolution. Kew: Royal Botanic Gardens, 379–414. [Google Scholar]
- Greilhuber J. 1998. Intraspecific variation in genome size: a critical reassessment. Annals of Botany 82: 27–35. [DOI] [PMC free article] [PubMed] [Google Scholar]
- Greilhuber J, Ebert I. 1994. Genome size variation in Pisum sativum Genome 37: 646–655. [DOI] [PubMed] [Google Scholar]
- Greilhuber J, Temsch EM. 2001. Feulgen densitometry: some observations relevant to best practice in quantitative nuclear DNA content determination. Acta Botanica Croatica 60: 285–298. [Google Scholar]
- Grime JP. 1986. Prediction of terrestrial vegetation responses to nuclear winter conditions. International Journal of Environmental Studies 28: 11–19. [Google Scholar]
- Grime JP, Mowforth MA. 1982. Variation in genome size—an ecological interpretation. Nature 299: 151–153. [Google Scholar]
- Grime JP, Shacklock JML, Band SR. 1985. Nuclear DNA contents, shoot phenology and species co-existence in a limestone grassland community. New Phytologist 100: 435–445. [Google Scholar]
- Hanson L, McMahon KA, Johnson MAT, Bennett MD. 2001. First nuclear DNA C-values for another 25 angiosperm families. Annals of Botany 88: 851–858. [DOI] [PubMed] [Google Scholar]
- Hanson L, McMahon KA, Johnson MAT, Bennett MD. 2001. First nuclear DNA C-values for 25 angiosperm families. Annals of Botany 87: 251–258. [DOI] [PubMed] [Google Scholar]
- Harrison RG. 1991. Molecular changes at speciation. Annual Review in Ecology and Systematics 22: 281–308. [Google Scholar]
- Harvey PH, Pagel MD. 1991.The comparative method in evolutionary biology. Oxford Series in Ecology and Evolution. Oxford: Oxford University Press. [Google Scholar]
- Harvey PH, Rambaut A. 1998. Phylogenetic extinction rates and comparative methodology. Proceedings of the Royal Society London, Series B, Biological Sciences 265: 1691–1696. [Google Scholar]
- Hughes AL, Hughes MK. 1995. Small genomes for better flyers. Nature 377: 391. [DOI] [PubMed] [Google Scholar]
- Jobson RW, Albert VA. 2002. Molecular rates parallel diversification contrasts between carnivorous plant sister lineages. Cladistics 18: 127–136. [DOI] [PubMed] [Google Scholar]
- Kalendar R, Tanskanen J, Immonen S, Nevo E, Schulman AH. 2000. Genome evolution of wild barley (Hordeum spontaneum) by BARE-1 retrotransposon dynamics in response to sharp microclimatic divergence. Proceedings of the National Academy of Sciences of the USA 97: 6603–6607. [DOI] [PMC free article] [PubMed] [Google Scholar]
- Kellogg EA. 1998. Relationships of cereal crops and other grasses. Proceedings of the National Academy of Sciences of the USA 95: 2005–2010. [DOI] [PMC free article] [PubMed] [Google Scholar]
- Knight CA, Ackerly DD. 2002. Variation in nuclear DNA content across environmental gradients: a quantile regression analysis. EcologyLetters 5: 66–76. [Google Scholar]
- Körner C. 1989. The nutritional status of plants from high altitudes. A worldwide comparison. Oecologia 81: 379–391. [DOI] [PubMed] [Google Scholar]
- Labani RM, Elkington TT. 1987. Nuclear DNA variation in the genus Allium L. (Liliaceae). Heredity 59: 119–128. [Google Scholar]
- Laurie DA, Bennett MD. 1985. Nuclear DNA content in the genera Zea and Sorghum Intergeneric, interspecific, and intraspecific variation. Heredity 55: 307–313. [Google Scholar]
- MacGillivray CW, Grime JP. 1995. Genome size predicts frost resistance in British herbaceous plants: implications for rates of vegetation response to global warming. Functional Ecology 9: 320–325. [Google Scholar]
- Maddison DR, Maddison WP. 2001.MacClade 4. Sunderland, MA: Sinauer Associates. [Google Scholar]
- Martins EP. 1996. Phylogenies, spatial autoregression, and the comparative method: a computer simulation test. Evolution 50: 1750–1765. [DOI] [PubMed] [Google Scholar]
- Martins EP. 1999. Estimation of ancestral states of continuous characters: a computer simulation study. Systematic Biology 48: 642–650. [Google Scholar]
- Martins EP, Garland T. 1991. Phylogenetic analyses of the correlated evolution of continuous characters: a simulation study. Evolution 45: 534–557. [DOI] [PubMed] [Google Scholar]
- Michaelson MJ, Price HJ, Ellison JR, Johnston JS. 1991. Comparison of plant DNA contents determined by Feulgen microspectrophotometry and laser flow cytometry. American Journal of Botany 78: 183–188. [Google Scholar]
- Mirsky A, Ris RH. 1951. The desoxyribonucleic acid content of animal cells and its evolutionary significance. Journal of General Physiology 34: 451–462. [DOI] [PMC free article] [PubMed] [Google Scholar]
- Morgan M. 2001. Transposable element number in mixed mating populations. Genetical Research 77: 261–275. [DOI] [PubMed] [Google Scholar]
- Oakley TH, Cunningham CW. 2000. Independent contrasts succeed where ancestor reconstruction fails in a known bacteriophage phylogeny. Evolution 54: 397–405. [DOI] [PubMed] [Google Scholar]
- Obermayer R, Swiecicki WK, Greilhuber J. 1999. Flow cytometric determination of genome size in some Old World Lupinus species (Fabaceae). Plant Biology 1: 403–407. [Google Scholar]
- Ophir R, Graur D. 1997. Patterns and rates of indel evolution in processed pseudogenes from humans and murids. Gene 205: 191–202. [DOI] [PubMed] [Google Scholar]
- Ozkan H, Levy AA, Feldman M. 2001. Allopolyploidy-induced rapid genome evolution in the wheat (Aegilops-Triticum) group. Plant Cell 13: 1735–1747. [DOI] [PMC free article] [PubMed] [Google Scholar]
- Pagel M. 1997. Inferring evolutionary processes from phylogenies. Zoologica Scripta 26: 331–348. [Google Scholar]
- Pagel M. 1999. Inferring the historical patterns of biological evolution. Nature 401: 877–884. [DOI] [PubMed] [Google Scholar]
- Petrov DA. 2001. Evolution of genome size: new approaches to an old problem. Trends in Genetics 17: 23–28. [DOI] [PubMed] [Google Scholar]
- Petrov DA. 2002. Mutational equilibrium model of genome size evolution. Theoretical Population Biology 61: 533–546. [DOI] [PubMed] [Google Scholar]
- Petrov DA, Lozovskaya ER, Hartl DL. 1996. High intrinsic rate of DNA loss in Drosophila Nature 384: 346–349. [DOI] [PubMed] [Google Scholar]
- Petrov DA, Sangster TA, Johnston JS, Hartl DL, Shaw KL. 2001. Evidence for DNA loss as a determinant of genome size. Science 287: 1060–1062. [DOI] [PubMed] [Google Scholar]
- Pijnacker LP, Schotsman HD. 1988. Nuclear DNA amounts in European Callitriche species (Callitrichaceae). Acta Botanica Neerlandica 37: 129–135. [Google Scholar]
- Price HJ 1976. Evolution of DNA content in higher plants. Botanical Review 42: 27–82. [Google Scholar]
- Price HJ. 1988. DNA content variation among higher plants. Annals of the Missouri Botanical Garden 75: 1248–1257. [Google Scholar]
- Price HJ, Chambers KL, Bachmann K. 1981. Genome size variation in diploid Microseris bigelovii (Asteraceae). Botanical Gazette 142: 156–159. [Google Scholar]
- Price HJ, Chambers KL, Bachmann K. 1981. Geographic and ecological distribution of genomic DNA content variation in Microseris douglasii (Asteraceae). Botanical Gazette 142: 415–426. [Google Scholar]
- Price HJ, Chambers KL, Bachmann K, Riggs J. 1986. Patterns of mean nuclear DNA content in Microseris douglasii (Asteraceae) populations. Botanical Gazette 147: 496–507. [Google Scholar]
- Price HJ, Sparrow AG, Nauman AF. 1973. Correlations between nuclear volume, cell volume, and DNA content in meristematic cells of herbaceous angiosperms. Experientia 29: 1028–1029. [Google Scholar]
- Purvis A, Rambaut A. 1995. Comparative analysis by independent contrasts (CAIC): an Apple Macintosh application for analysing comparative data. Computer Applications in Bioscience 11: 247–251. [DOI] [PubMed] [Google Scholar]
- Raven PH, Evert RF, Eichhorn E. 1986.Biology of plants, 4th edn. New York: Worth Publishers. [Google Scholar]
- Rayburn AL, Auger JA. 1990. Genome size variation in Zea mays ssp. mays adapted to different altitudes. Theoretical and Applied Genetics 79: 470–474. [DOI] [PubMed] [Google Scholar]
- Rayburn AL, Price HJ, Smith JD, Gold JR. 1985. C-band heterochromatin and DNA content in Zea mays American Journal of Botany 71: 1610–1617. [Google Scholar]
- Rees H, Hazarika MH. 1969. Chromosome evolution in Lathyrus In: Darlington CD, Lewis KR, eds. Chromosomes today. Edinburgh: Oliver and Boyd, 158–165. [Google Scholar]
- Rees H, Jones GH. 1967. Chromosome evolution in Lolium Heredity 22: 1–18. [Google Scholar]
- Rieseberg LH. 1998. Genetic mapping as a tool for studying speciation. In: Soltis DE, Soltis PS, Doyle JJ, eds. Molecular systematics of plants II. Boston, Dordrecht, London: Kluwer Academic Publishers, 459–487. [Google Scholar]
- Rieseberg LH, van Vossen C, Desrochers A. 1995. Genomic reorganization accompanies hybrid speciation in wild sunflowers. Nature 375: 313–316. [Google Scholar]
- Rønsted N, Chase MW, Albach DC, Bello A. 2002. Phylogenetic relationships within Plantago (Plantaginaceae): evidence from nuclear ribosomal ITS and plastid trnL-F sequence data. Botanical Journal of the Linnean Society 139: 323–338. [Google Scholar]
- Silvertown J, Charlesworth D. 2001.Introduction to plant population biology. Oxford: Blackwell Science. [Google Scholar]
- Sims LE, Price HJ. 1985. Nuclear DNA content variation in Helianthus (Asteraceae). American Journal of Botany 72: 1213–1219. [Google Scholar]
- Soltis DE, Soltis PS. 1999. Polyploidy: recurrent formation and genome evolution. Trends in Ecology and Evolution 14: 348–352. [DOI] [PubMed] [Google Scholar]
- Song K, Lu P, Tang K, Osborn TC. 1995. Rapid genome change in synthetic polyploids of Brassica and its implications for polyploid evolution. Proceedings of the National Academy of Sciences of the USA 92: 7719–7723. [DOI] [PMC free article] [PubMed] [Google Scholar]
- Sparrow AH, Miksche JP. 1961. Correlation of nuclear volume and DNA content with higher plant tolerance to chronic radiation. Science 134: 282–283. [DOI] [PubMed] [Google Scholar]
- Stebbins GL. 1957. Self fertilization and population variability in higher plants. American Naturalist 91: 337–354. [Google Scholar]
- Suda J, Kyncl T, Freiova R. 2003. Nuclear DNA amounts in Macaronesian angiosperms. Annals of Botany 92: 153–164. [DOI] [PMC free article] [PubMed] [Google Scholar]
- Swofford DL. 1998.PAUP* Phylogenetic analysis using parsimony (*and other methods). Sunderland, MA: Sinauer Associates. [Google Scholar]
- Taberlet P, Gielly L, Pautou G, Bouvet J. 1991. Universal primers for amplification of three non-coding regions of chloroplast DNA. Plant Molecular Biology 17: 1105–1109. [DOI] [PubMed] [Google Scholar]
- Tito CM, Poggio L, Naranjo CA. 1991. Cytogenetic studies in the genus Zea 3. DNA content and heterochromatin in species and hybrids. Theoretical and Applied Genetics 83: 58–64. [DOI] [PubMed] [Google Scholar]
- Van't Hof J. 1965. Relationships between mitotic cycle duration, S period duration and the average rate of DNA synthesis in the root meristem cells of several plants. Experimental Cell Research 39: 48–58. [DOI] [PubMed] [Google Scholar]
- Van't Hof J, Sparrow A. 1963. A relationship between DNA content, nuclear volume and minimum mitotic cycle time. Proceedings of the National Academy of Sciences of the USA 49: 897–902. [DOI] [PMC free article] [PubMed] [Google Scholar]
- Vilhar B, Greilhuber J, Dolenc Koce J, Temsch EM, Dermastia M. 2001. Plant genome size measurement with DNA image cytometry. Annals of Botany 87: 719–728. [Google Scholar]
- Wagstaff SJ, Bayly, MJ, Garnock-Jones PJ, Albach DC. 2002. Classification, origin, and diversification of the New Zealand hebes (Scrophulariaceae). Annals of the Missouri Botanical Garden 89: 38–63. [Google Scholar]
- Wendel JF. 2000. Genome evolution in polyploids. Plant MolecularBiology 42: 225–249. [PubMed] [Google Scholar]
- Wendel JF, Cronn RC, Alvarez I, Liu B, Small RL, Senchina DS. 2002. Intron size and genome size in plants. Molecular Biology and Evolution 19: 2346–2352. [DOI] [PubMed] [Google Scholar]
- Wendel JF, Cronn RC, Johnston JS, Price HJ. 2002. Feast and famine in plant genomes. Genetica 115: 37–47. [DOI] [PubMed] [Google Scholar]
- Wright SI, Schoen DJ. 1999. Transposon dynamics and the breeding system. Genetica 107: 139–148. [PubMed] [Google Scholar]
- Wright SI, Hien Le Q, Schoen DJ, Bureau TE. 2001. Population dynamics of an Ac-like transposable element in self- and cross-pollinating Arabidopsis Genetics 158: 1279–1288. [DOI] [PMC free article] [PubMed] [Google Scholar]