Abstract
• Background and Aims Bromus tectorum (cheatgrass or downy brome) is an exotic annual grass that is dominant over large areas of former shrubland in western North America. To flower in time for seed production in early summer, B. tectorum plants generally require vernalization at winter temperatures, either as imbibed seeds or as established seedlings.
• Methods Variation in response to increasing periods of vernalization as seeds or seedlings for progeny of ten full‐sib families from each of four B. tectorum populations from contrasting habitats was studied.
• Key Results As vernalization was increased from 0 to 10 weeks, the proportion of plants flowering within 20 weeks increased, weeks to initiation of flowering decreased, and seed yield per plant increased, regardless of whether plants were vernalized as seeds or seedlings. Most of the variation was accounted for by differences among populations. Plants of the warm desert population flowered promptly even without vernalization, while those of the cold desert, foothill and montane populations showed incremental changes in response variables as a function of vernalization period. Populations differed in among‐family variance, with the warm desert population generally showing the least variance and the cold desert population the most. Variation among populations and among families within populations decreased as vernalization period increased, whereas the non‐genetic component of variance showed no such pattern.
• Conclusions Variation in vernalization response was found to be adaptively significant and apparently represents the result of contrasting selection regimes on a range of founder genotypes.
Key words: Bromus tectorum, cheatgrass, chilling, downy brome, ecological genetics, flowering phenology, reproductive output, vernalization, winter annual
INTRODUCTION
Vernalization has been defined as the exposure of a plant to chilling conditions that induce or hasten the subsequent development of floral primordia (Chouard, 1960). It is a key process in the life history of both winter annuals and monocarpic perennials of temperate regions. In winter annuals, the vernalization process is referred to as quantitative because it accelerates flowering, but even unvernalized plants will flower eventually. In addition, winter annuals can usually be vernalized either as seeds or as seedlings. This ensures timely flowering in spring, whether seedlings emerge the previous autumn or in spring shortly before flowering. Summer annuals, on the other hand, have no vernalization requirement, and can flower in summer following germination in late spring. A primary ecological function of the vernalization response for winter annuals is to prevent precocious flowering of autumn‐emerging cohorts, which would not have adequate time to ripen seeds prior to the onset of winter. Different genotypes within a species may have different vernalization requirements, or may even function as winter versus summer annuals. The most familiar examples are cereal crops such as wheat (Triticum aestivum). Winter wheat varieties must be autumn‐planted because they have a vernalization requirement for flowering, whereas spring wheat varieties can be sown in spring and function as summer annuals (Fowler et al., 1996).
Most studies on the vernalization requirements of winter annual grass weeds have included only a single population (e.g. Baskin and Baskin, 1981 for Bromus japonicus; Gleichsner and Appleby, 1996 for Bromus diandrus). Different studies of the same species sometimes report contrasting results (e.g. Donald, 1984 vs. Walenta et al., 2002 for Aegilops cylindrica). Systematic studies of among‐population variation in vernalization requirement in annual grass weeds include Chauvel et al. (2002) for Alopecurus myosuroides and Loskutov (2001) for Avena species. The genetic basis for variation in vernalization requirement in cereal crops has been studied in detail and is known to involve a few major genes (Flood and Halloran, 1984). The genetic differentiation into winter and summer annual biotypes in grain lupin (Lupinus angustifolius, Landers, 1995) and pennycress (Thlaspi arvense, McIntyre and Best, 1978) is also known to be under the control of one or two genes.
Few winter annual grass weeds are dominant over as wide an array of environments as Bromus tectorum (cheatgrass or downy brome). This cosmopolitan species is especially abundant in western North America, where it has invaded plant communities from warm desert shrubland to subalpine forest (Mack, 1981; Pierson and Mack, 1990; Meyer and Allen, 1999a). It has achieved dominant status on tens of millions of hectares of former cold desert shrubland and sagebrush steppe vegetation (Whisenant 1990; D’Antonio and Vitousek, 1992). The remarkable success of this species, which is an obligate inbreeder (McKone, 1985), is attributable to a combination of phenotypic plasticity and adaptively significant genetic variation. In a previous study it was found that dormancy status of recently dispersed seeds in this species is under strong genetic control, with major differences among Intermountain populations and among full‐sib families within populations (Meyer and Allen, 1999a). Rice and Mack (1991a) found significant genetic variation for flowering time both among populations and among families within populations of B. tectorum in eastern Washington. They observed clear population differentiation in days from emergence to flowering as measured in a common environment that included winter vernalization in an unheated greenhouse, and these differences persisted in the field in reciprocal transplant experiments (Rice and Mack, 1991b). Vernalization studies on B. tectorum by Hulbert (1955), Finnerty and Klingman (1962) and Richardson et al. (1986) gave results that were similar in broad outline but differed substantially in detail, further suggesting that genetically based among‐population variation in vernalization response might be characteristic of this species.
In the study reported here, variation in flowering phenology and reproductive output among and within populations of B. tectorum was examined in response to variation in vernalization regime. Our goal was to determine whether adaptively significant variation in vernalization response exists in western North American B. tectorum populations. Four populations were selected for these detailed studies, representing a range of habitats (Table 1). For purposes of comparison, an experimental design was used similar to that employed by Rice and Mack (1991a) as well as in our earlier work with seed dormancy (Meyer and Allen, 1999a).
Table 1.
Habitat attriibutes for four B. tectorum populations included in the study
| Climate | |||||
| Population | Elevation (m) | Plant community type | Mean annual precip. (mm) | Mean January temp. (°C) | Mean July temp. (°C) |
| Potosi Pass, NV | 1500 | Blackbrush (warm desert) | 250 | 1·7 | 26·5 |
| Whiterocks, UT | 1450 | Shadscale (cold desert) | 180 | –2·3 | 25·8 |
| Hobble Creek, UT | 1530 | Sagebrush‐gambel oak (foothills) | 400 | –2·1 | 24·8 |
| Strawberry, UT | 2400 | Subalpine meadow (montane) | 560 | –7·8 | 16·1 |
The study addressed the following hypotheses: (1) as vernalization period is increased to the duration needed for maximal response, the proportion of plants flowering will increase, time to initiation of flowering will decrease, and seed yield per plant will increase; (2) vernalization as imbibed seeds will be as effective as vernalization as seedlings in eliciting rapid, complete and abundant flowering; (3) populations and full‐sib families within populations will show quantitative genetic differences in vernalization response; (4) genetic differences among populations and among full‐sib families within populations will be most evident in response to inadequate vernalization regimes, i.e. with adequate vernalization these differences will be small or absent; and (5) among‐population differences in vernalization response will be habitat‐correlated and therefore of adaptive significance.
MATERIALS AND METHODS
The Bromus tectorum L. populations included in this study have been the subject of several types of investigation, including physiological ecology (Meyer et al., 1997; Christensen et al., 1996; Bauer et al., 1998) and genetics (Meyer and Allen, 1999a, b) of seed dormancy regulation, patterns of resistance to the pathogen U. bullata (Meyer et al., 2001) and patterns of variation in molecular genetic markers (Ramakrishnan, 2002). Full‐sib families (seed progeny of individual plants) were first collected in the field at these study locations in 1992 (Meyer and Allen, 1999a). For each population, the ten full‐sib families used in that study were included. The seeds were the progeny of plants reared in a common greenhouse environment from the original seed collections, thus minimizing any possible maternal effects. Seeds were stored under laboratory conditions until fully after‐ripened prior to planting.
Two vernalization experiments were performed. The first experiment was carried out from January to August 1998, and examined the effect of varying periods of vernalization as imbibed seeds. The second experiment was carried out from December 1999 to August 2000 and studied the effects of vernalization as established plants. For each experiment, two replications of six planted seeds were included for each line (full‐sib family) by vernalization treatment combination. The seeds were planted into small root‐trainer cells (Spencer‐Lemaire, Edmonton, Canada) filled with aerated steam‐treated potting medium consisting of screened peat moss, vermiculite, sand and calcined montmorillonite clay in the ratio 2 : 2 : 1 : 1 by volume (see Meyer et al., 2001 for details). Each box contained ten rows of six planted cells, with an empty row (potting medium but no seeds) as a buffer on each end of the box. The ten rows corresponded to the ten full‐sib families of a population, so that each population was represented by two boxes per vernalization treatment. In most cases, all six planted seeds resulted in established plants, but occasionally a seed failed to emerge or a seedling died. Calculations are based on actual plant numbers.
In the experiment with vernalization as seeds, the six vernalization treatments were 0, 2, 4, 6, 8 and 10 weeks for a total of 48 boxes. Vernalization was carried out on germination blotters in Petri dishes in the dark at 2 °C. Seeds began germinating in the vernalization treatment by 4 weeks, and by 6 weeks all the seeds had germinated. The dates for initiation of each treatment were staggered so that all vernalization treatments ended on the same day in early April. The vernalized seeds (or germinants) were planted, and the plants were allowed to grow out in an unheated greenhouse without supplemental light. During the spring, temperatures in the greenhouse generally fluctuated between 10–25 °C. During the summer, the temperatures fluctuated between 15–35 °C. No detailed record was kept of temperature fluctuations.
In the experiment with vernalization as established plants, the unvernalized seeds were planted in the same design as above, except that there were two additional vernalization treatments, 12 and 14 weeks, for a total of 64 boxes. The plants were allowed to grow for 2–3 weeks in a heated (15–25 °C temperature range) greenhouse, then moved to a controlled‐environment chamber for vernalization. The temperature in the chamber varied from 2–5 °C. Because a previous trial had shown that the seedlings would not vernalize in the dark, fluorescent lighting was provided for 8 h each day. This caused some temperature fluctuation in the chamber. Once again the initiation of the treatments was staggered, so that all the treatments came out of vernalization on the same day in early April. The post‐vernalization period was started on approximately the same date in April as in the previous experiment, so that day length would be comparable across experiments. Greenhouse temperature conditions for the post‐vernalization period were approximately the same as in the previous experiment, although variation in spring weather between years could have caused some differences.
During the greenhouse post‐vernalization period for each experiment, the plants were examined weekly and scored for flowering status. Initiation of flowering for each replication of each treatment combination was scored as the week when the first individual in the group of six plants showed the first visible sign of flowering, namely the appearance of awn tips through the boot. Each week for 20 weeks following the end of vernalization, the number of individuals that had initiated flowering in each group was scored. Flowering proportion for each treatment combination and replication was calculated as the number of plants that flowered within the 20‐week post‐vernalization period divided by the total number of plants.
As seeds ripened during the course of the experiment, the inflorescences were harvested by clipping the main stalk of each flowering culm just below the lowermost panicle branch. Seeds that developed late in the 20‐week period were allowed to finish ripening prior to harvest. The inflorescences were bulked by treatment combination and replication, air‐dried and weighed. Yield per plant was determined as the total weight divided by the number of plants that set seed.
Data from each of the two experiments were first analysed using nested analysis of variance (ANOVA) with population and vernalization treatment as fixed main effects and full‐sib family nested within population as a random effect. Because of major departures from homogeneity of variance in the resulting analyses, the results were not subjected to significance testing. Instead, further analyses were performed to partition the variance in each experiment into its genetic versus environmental components. For each experiment, separate ANOVAs were carried out for each population, in order to examine among‐population differences in variance partitioning. Differences among population variances were examined using Levy’s test (Zar, 1984). Similarly, separate ANOVAs were carried out for each vernalization treatment in order to see how total variance as well as variance partitioning changed as a consequence of increasing vernalization period. The three response variables examined in these analyses were proportion of plants flowering, mean weeks to initiation of flowering and mean seed yield per plant, as calculated above. The proportion of plants flowering was arcsine‐transformed to improve normality prior to analysis. Mean weeks to initiation of flowering and mean seed yield per plant could only be calculated for treatment combinations that resulted in some flowering and seed production.
RESULTS
Vernalization caused an overall increase in the proportion of plants flowering, but there were dramatic differences among populations in vernalization response (Fig. 1). All individuals of the warm desert Potosi Pass population flowered within 20 weeks regardless of vernalization treatment, whereas 4–6 weeks of vernalization were required for the cold desert Whiterocks population to approach 100 % flowering, and the foothill Hobble Creek population required 6–8 weeks. The montane Strawberry population did not exceed 80 % flowering even after 10 weeks of vernalization as seeds, but reached 100 % after only 6 weeks of vernalization as established plants. In general, vernalization as established plants appeared to result in a faster and more complete response, although the fact that even unvernalized plants flowered to higher percentages in the experiment with vernalization as established plants suggests that some difference in post‐vernalization conditions between the two experiments might also have been involved.
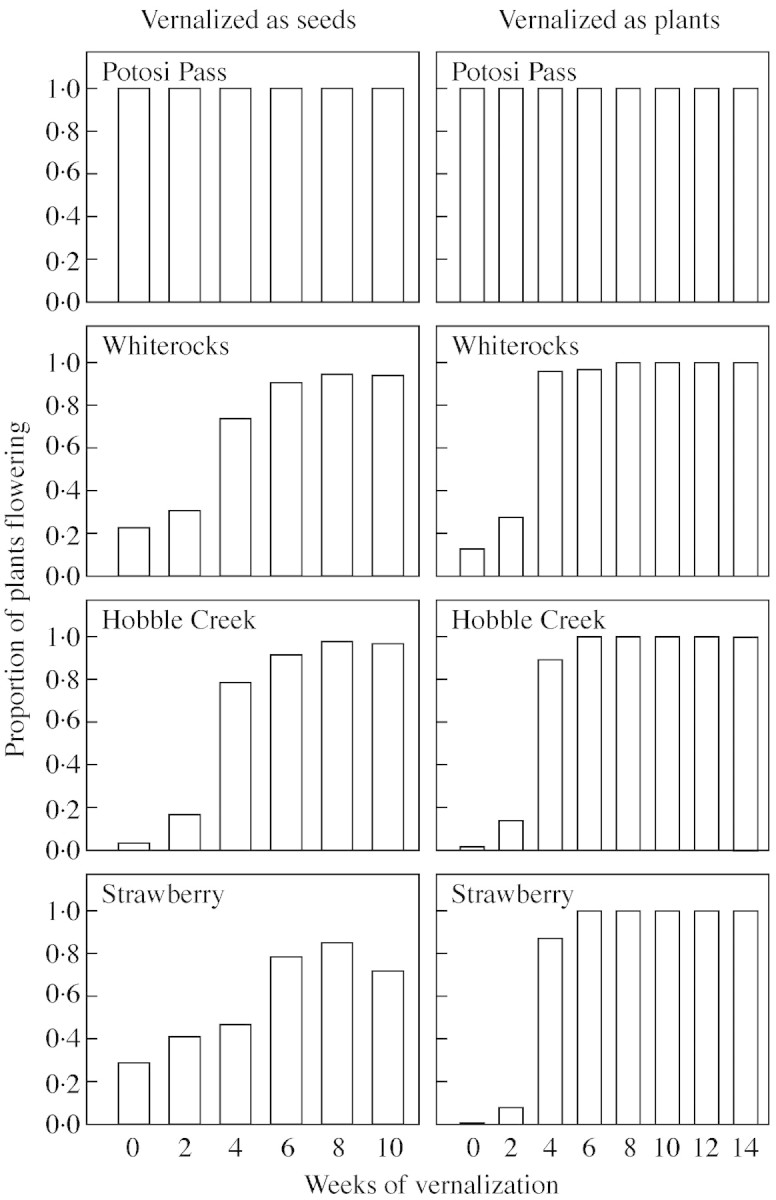
Fig. 1. Mean proportion of plants flowering for each of four B. tectorum populations in response to 0–10 weeks of vernalization as seeds and 0–14 weeks of vernalization as plants.
Time to initiation of flowering decreased as a function of increasing vernalization period in both experiments (Fig. 2). Values for this measure leveled off at 5–6 weeks after 8 weeks of vernalization in the experiment with vernalization as seeds, but showed continuously decreasing values throughout 14 weeks in the experiment with vernalization as established plants, with final values from 3–4 weeks. Potosi Pass plants not only flowered completely without vernalization, they did so relatively quickly (4–8 weeks to initiation of flowering). There was little further decrease in flowering time after 2 weeks of vernalization for this population. For the other three populations, the decrease in flowering time in response to increasing vernalization was much more dramatic, with the few unvernalized plants that did flower generally requiring 15 or more weeks to initiate flowering.
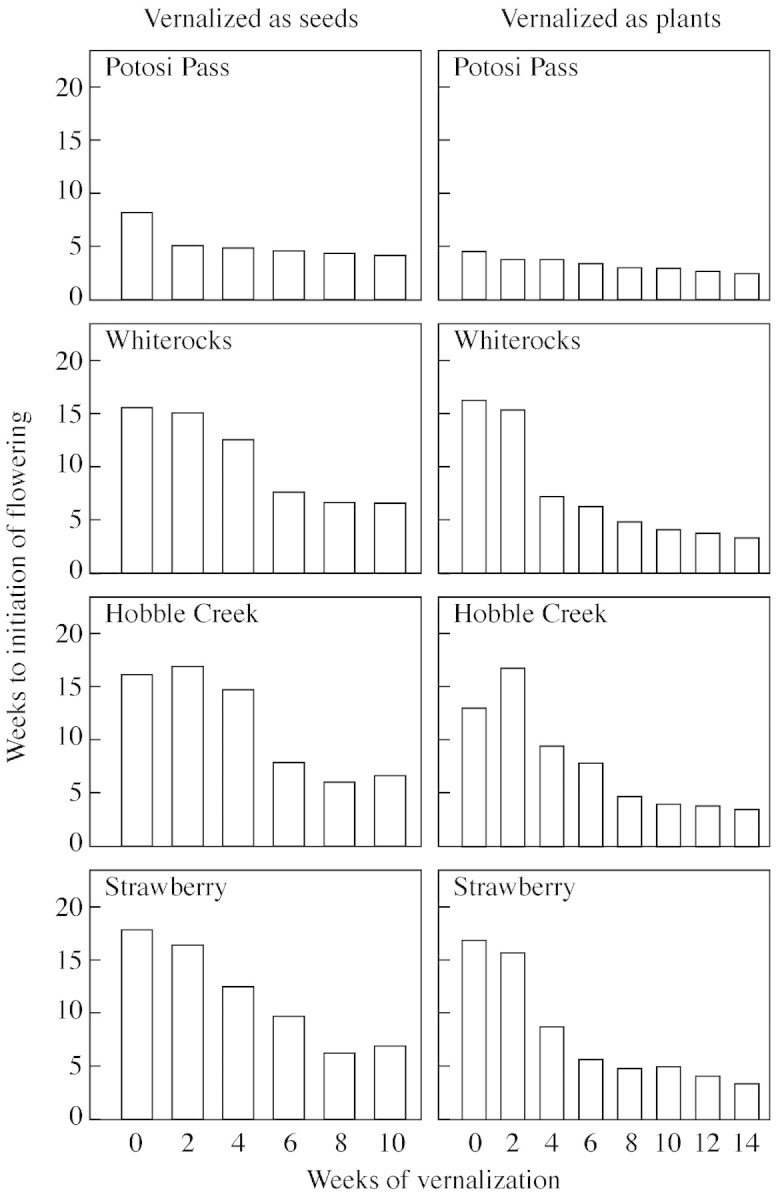
Fig. 2. Mean weeks to initiation of flowering for each of four B. tectorum populations in response to 0–10 weeks of vernalization as seeds and 0–14 weeks of vernalization as plants.
Seed yield per plant generally increased with increasing vernalization period in both experiments (Fig. 3). Seed yield values tended to level off after 8 weeks of vernalization in the experiment with vernalization as seeds, but tended to increase more or less linearly in response to up to 14 weeks of vernalization as established plants. Seed yield for the Potosi Pass population did not show this trend, but instead showed values that shifted irregularly from one vernalization period to the next. There was also some irregularity in the seed yield response for the other three populations, especially in response to vernalization as established plants, but the overall trend of increasing yield is clear.
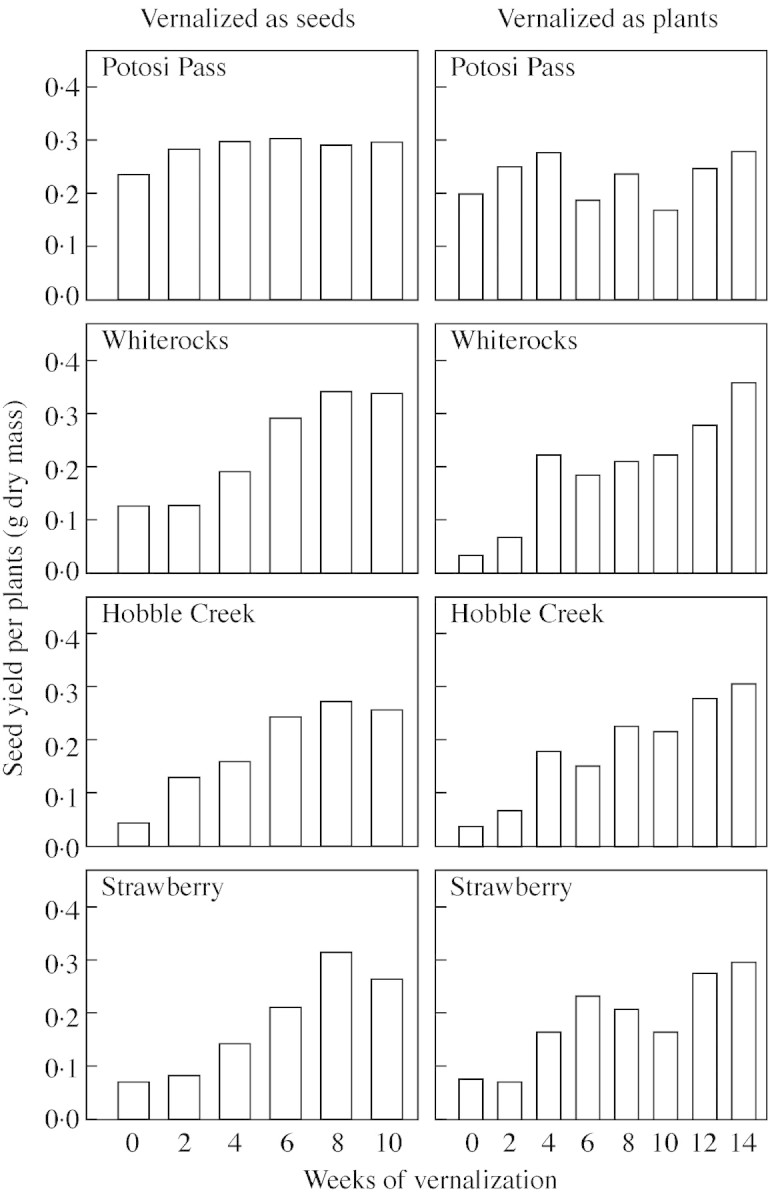
Fig. 3. Mean seed yield per plant for each of four B. tectorum populations in response to 0–10 weeks of vernalization as seeds and 0–14 weeks of vernalization as plants.
When the distribution of variance among components for proportion of plants flowering was examined for each vernalization period in each of the two experiments, it was apparent that the genetic components of variance (among‐population and among‐family within population) decreased in absolute magnitude as vernalization period was increased, (Table 2). This means that, as the requirement for vernalization is met, the differences among populations and among families within populations largely disappear. The non‐genetic (within‐family or error) variance in both experiments was generally very small, with genetic sources accounting for almost all the variance in those treatments where there was substantial variance, namely the shorter vernalization periods. Among‐family variance was always much smaller than among‐population variance, undoubtedly because the Potosi Pass response pattern was so different from the other populations. Within‐family variance showed no trend in absolute magnitude as a function of vernalization treatment, so that, as vernalization period increased, the proportion of variance due to differences within families tended to increase.
Table 2.
Among‐population (VP), among‐family (VF), and within‐family (VW) variance components for each vern alization period in each of two experiments (vernalization as imbibed seeds vs. as young plants), genetic variance proportion (VP + VF /VP + VF + VW), and proportion of genetic variance due to among‐population variance (VP/VP + VF) for the response variable proportion of plants flowering
| V P | V F | V W | VP + VF/VP + VF + VW | VP/VP + VF | |
| Vernalized as seeds | |||||
| 0 weeks | 3·571 | 0·175 | 0·013 | 0·996 | 0·953 |
| 2 weeks | 2·689 | 0·177 | 0·025 | 0·991 | 0·938 |
| 4 weeks | 0·955 | 0·113 | 0·047 | 0·958 | 0·894 |
| 6 weeks | 0·156 | 0·040 | 0·020 | 0·907 | 0·796 |
| 8 weeks | 0·087 | 0·012 | 0·012 | 0·892 | 0·788 |
| 10 weeks | 0·322 | 0·027 | 0·011 | 0·969 | 0·923 |
| Vernalized as plants | |||||
| 0 weeks | 11·29 | 0·067 | 0·009 | 0·999 | 0·994 |
| 2 weeks | 8·450 | 0·162 | 0·044 | 0·995 | 0·981 |
| 4 weeks | 0·153 | 0·090 | 0·083 | 0·754 | 0·630 |
| 6 weeks | 0·016 | 0·011 | 0·012 | 0·692 | 0·593 |
| 8 weeks | 0·002 | 0·002 | 0·002 | 0·667 | 0·500 |
| 10 weeks | 0·002 | 0·002 | 0·002 | 0·667 | 0·500 |
| 12 weeks | 0·003 | 0·004 | 0·005 | 0·583 | 0·429 |
| 14 weeks | 0·002 | 0·002 | 0·002 | 0·667 | 0·500 |
The response variable was arcsine‐transformed for analysis.
A somewhat similar pattern in the magnitude and distribution of variance as a function of vernalization period is seen for weeks to initiation of flowering (Table 3). Once again the among‐population component of variance tended to decrease with increasing vernalization period, except for an increase from 0–2 weeks, probably due to the fact that variance in the treatment with no vernalization was based on fewer experimental units. Genetic sources dominated the variance structure across all vernalization treatments (>93 %), and among‐population differences were the principal source of this variance (>92 %), again because of the sharply different response pattern shown by the Potosi Pass population, which had a shorter time to flowering than the other populations even after 14 weeks of vernalization (Figure2). Among‐family and within‐family variance for this trait were of approximately the same absolute magnitude and showed little or no trend with regard to vernalization period.
Table 3.
Among‐population (VP), among‐family (VP), and within‐family (VW) variance components for each vern alization period in each of two experiments (vernalization as imbibed seeds vs. as young plants), genetic variance proportion (VW) and proportion of genetic variance due to among‐population variance (VP/VP + VF) for the response variable weeks to initiation of flowering
| V P | V P | V W | V W | VP/VP + VF | |
| Vernalized as seeds | |||||
| 0 weeks | 201·7 | 1·86 | 1·85 | 0·991 | 0·991 |
| 2 weeks | 500·2 | 2·20 | 3·12 | 0·994 | 0·996 |
| 4 weeks | 351·2 | 3·57 | 2·08 | 0·994 | 0·990 |
| 6 weeks | 77·3 | 4·18 | 1·80 | 0·978 | 0·949 |
| 8 weeks | 17·9 | 0·59 | 0·47 | 0·975 | 0·968 |
| 10 weeks | 27·8 | 2·43 | 0·92 | 0·970 | 0·920 |
| Vernalized as plants | |||||
| 0 weeks | 219·4 | 0·60 | 0·78 | 0·996 | 0·997 |
| 2 weeks | 529·9 | 0·90 | 1·01 | 0·998 | 0·998 |
| 4 weeks | 122·3 | 2·76 | 1·42 | 0·989 | 0·978 |
| 6 weeks | 69·0 | 0·55 | 0·56 | 0·992 | 0·992 |
| 8 weeks | 16·7 | 0·19 | 0·13 | 0·992 | 0·989 |
| 10 weeks | 12·4 | 0·08 | 0·03 | 0·998 | 0·994 |
| 12 weeks | 7·5 | 0·07 | 0·10 | 0·987 | 0·991 |
| 14 weeks | 3·9 | 0·07 | 0·28 | 0·934 | 0·982 |
Among‐population variance for the trait seed yield per plant also tended to decrease as a function of increasing vernalization period, although it generally dominated the variance structure even after longer vernalization (Table 4), apparently because of among‐population differences in maximum yield (Fig. 3). Among‐family variance in seed yield per plant also tended to decrease with increasing vernalization; it exceeded within‐family variance only for the shorter vernalization periods. For this trait, within‐family variance actually tended to increase with increasing vernalization period.
Table 4.
Among‐population (VP), among‐family (VF), and within‐family (VW) variance components for each vern alization period in each of two experiments (vernalization as imbibed seeds vs. as young plants), genetic variance proportion (VP + VF /VP + VF + VW) and proportion of genetic variation due to among‐population variance (VP/VP + VF) for the response variable seed yield per plant
| V P | V F | V W | VP + VF/VP + VF + VW | VP/VP + VF | |
| Vernalized as seeds | |||||
| 0 weeks | 0·1875 | 0·0218 | 0·0012 | 0·994 | 0·896 |
| 2 weeks | 0·1265 | 0·0036 | 0·0012 | 0·991 | 0·972 |
| 4 weeks | 0·0930 | 0·0045 | 0·0016 | 0·984 | 0·954 |
| 6 weeks | 0·0347 | 0·0054 | 0·0045 | 0·899 | 0·865 |
| 8 weeks | 0·0180 | 0·0056 | 0·0062 | 0·792 | 0·763 |
| 10 weeks | 0·0280 | 0·0070 | 0·0110 | 0·761 | 0·800 |
| Vernalized as plants | |||||
| 0 weeks | 0·0434 | 0·0004 | 0·0005 | 0·989 | 0·991 |
| 2 weeks | 0·1172 | 0·0010 | 0·0004 | 0·997 | 0·992 |
| 4 weeks | 0·0486 | 0·0052 | 0·0020 | 0·964 | 0·903 |
| 6 weeks | 0·0234 | 0·0008 | 0·0008 | 0·957 | 0·967 |
| 8 weeks | 0·0035 | 0·0008 | 0·0007 | 0·768 | 0·814 |
| 10 weeks | 0·0193 | 0·0007 | 0·0014 | 0·935 | 0·965 |
| 12 weeks | 0·0055 | 0·0012 | 0·0011 | 0·859 | 0·821 |
| 14 weeks | 0·0217 | 0·0013 | 0·0014 | 0·943 | 0·943 |
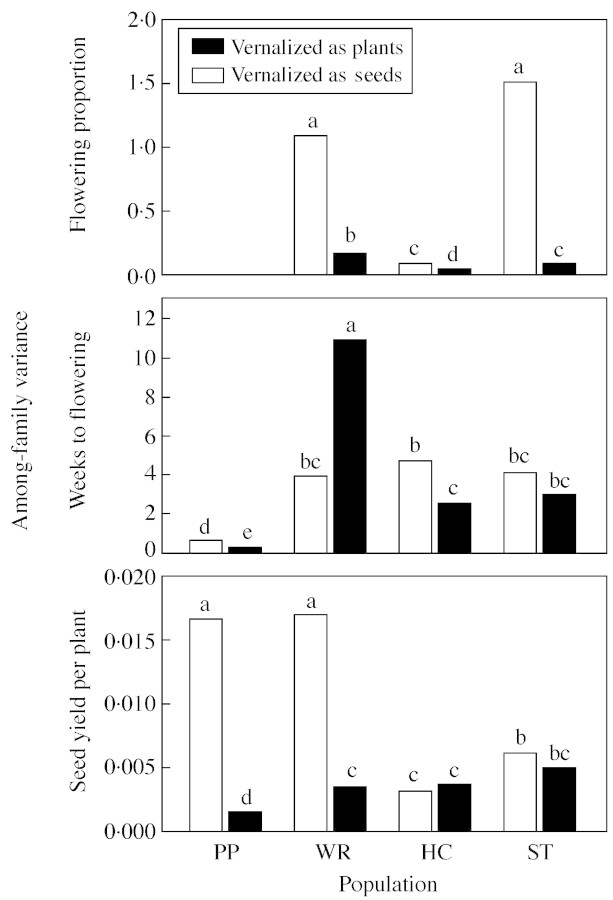
When data sets from each experiment were analyzed by population, there were major differences among populations in among‐family variances for each of the three traits (Fig. 4). For the trait proportion of plants flowering, Potosi Pass exhibited no variation (i.e. all plants flowered, regardless of family or vernalization treatment, in both experiments), resulting in identical, flat reaction norms for all ten families (Figure 5). Both the Whiterocks and Strawberry populations exhibited significantly more among‐family variance in the experiment with vernalization as seeds than when established plants were vernalized, while the Hobble Creek population exhibited low among‐family variance for this trait in both experiments (Fig. 4). Reaction norms for the ten Strawberry lines show the source of the higher variance in the first experiment (Fig. 5). The differences among lines in the first experiment are especially apparent in the shorter vernalization periods, including the no vernalization treatment, suggesting that the lines are showing differential responses to some unquantified aspect of the post‐vernalization environment in the first experiment that was not evident in the second experiment. The Whiterocks lines show a similar though less extreme pattern, while reaction norms for proportion of plants flowering for the ten Hobble Creek lines were generally similar to each other in both experiments.
Fig. 4. Among‐family variance for the response variables proportion of plants flowering, weeks to initiation of flowering, and seed yield per plant in each of four B. tectorum populations in response to vernalization as seeds or as plants. For each response variable, bars headed by the same letter are not significantly different at the P < 0·05 level according to Levy’s multiple comparison test for differences among variances. PP, Potosi Pass; WR, Whiterocks; HC, Hobble Creek; ST, Strawberry.
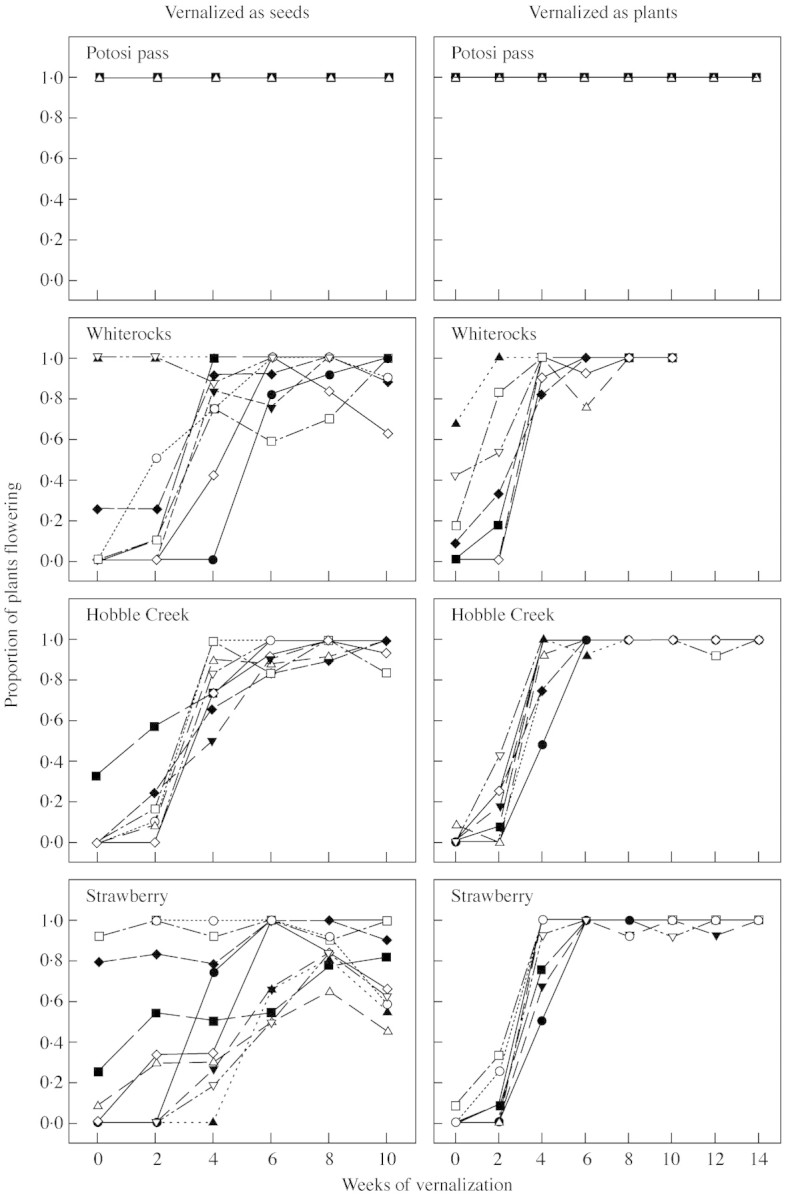
Fig. 5. Reaction norms for proportion of plants flowering in response to 0–10 weeks of vernalization as seeds and 0–14 weeks of vernalization as plants for the seed progeny of ten randomly selected families in each of four B. tectorum populations.
Potosi Pass also showed low among‐family variance in the response variable weeks to initiation of flowering in both experiments, though the variance was significantly higher in the experiment with vernalization as seeds (Fig. 4). Reaction norms for the ten Potosi Pass lines show that the source of among‐family variance was a difference among lines in response to shorter vernalization periods (Fig. 6). The other three populations generally had similar among‐family variances for this trait; these were significantly larger than Potosi Pass among‐family variances (Fig. 4). These differences are evident in the more variable reaction norms for this trait exhibited by lines of these populations (Fig. 6).
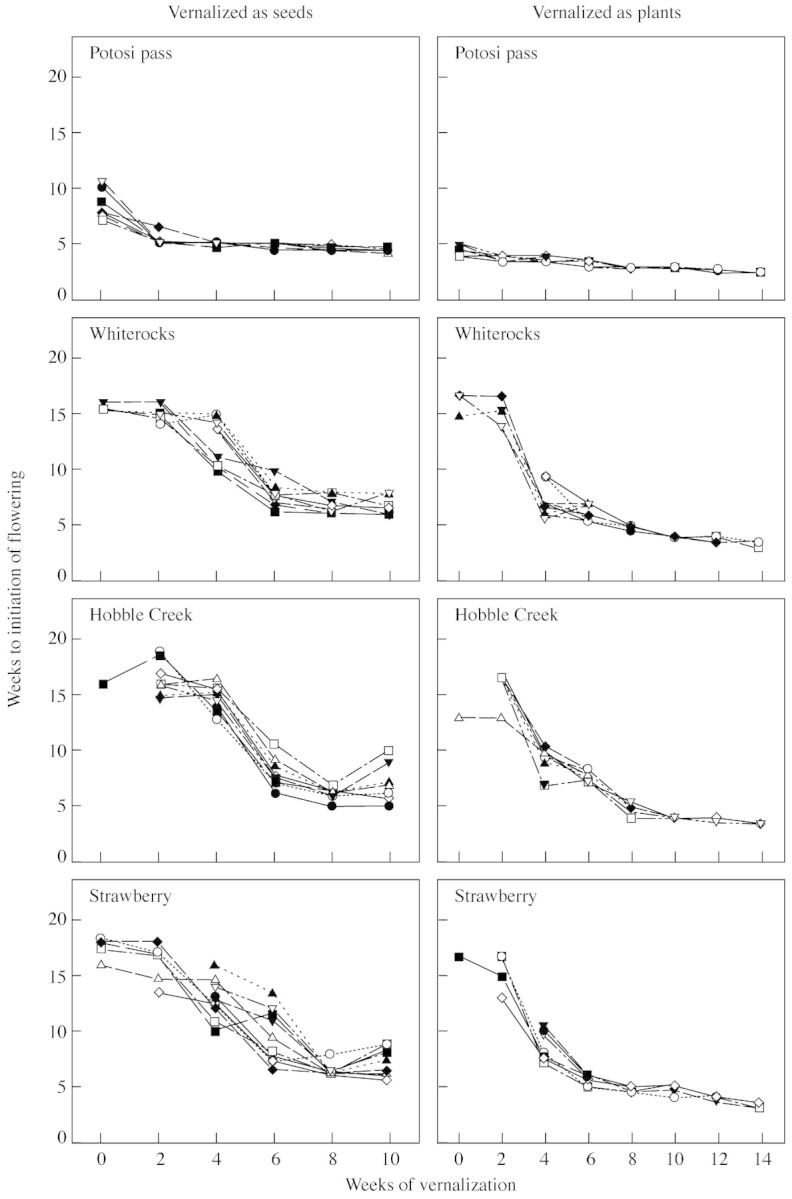
Fig. 6. Reaction norms for weeks to initiation of flowering in response to 0–10 weeks of vernalization as seeds and 0–14 weeks of vernalization as plants for the seed progeny of ten randomly selected families in each of four B. tectorum populations.
Major differences between experiments are seen in the among‐family variances for the variable mean seed yield per plant, at least for the Potosi Pass and Whiterocks populations (Fig. 4). These two populations showed substantially more among‐family variance in this trait when plants were vernalized as seeds. The differences among lines in the Potosi Pass population were manifested in spite of the general lack of response to vernalization, whereas reaction norms for the Whiterocks lines show that the differences among lines actually seemed to increase with increasing vernalization (Fig. 7). These differences among lines are not seen in the reaction norms in response to vernalization as established plants. Reaction norms for the Hobble Creek population are generally similar both among lines and across experiments, while the Strawberry population seemed to show greater variation among lines with vernalization as seeds, although this difference in variance was not significant (Fig. 4). The trend for decreased yield in response to 6 and 10 weeks of vernalization relative to 4, 8 and 12 weeks in the experiment with vernalization as established plants is especially evident in Potosi Pass reaction norms, but can also be seen in the reaction norms for Hobble Creek and Strawberry (Fig. 7). The reason for this irregularity in response as a function of vernalization treatment is not known.
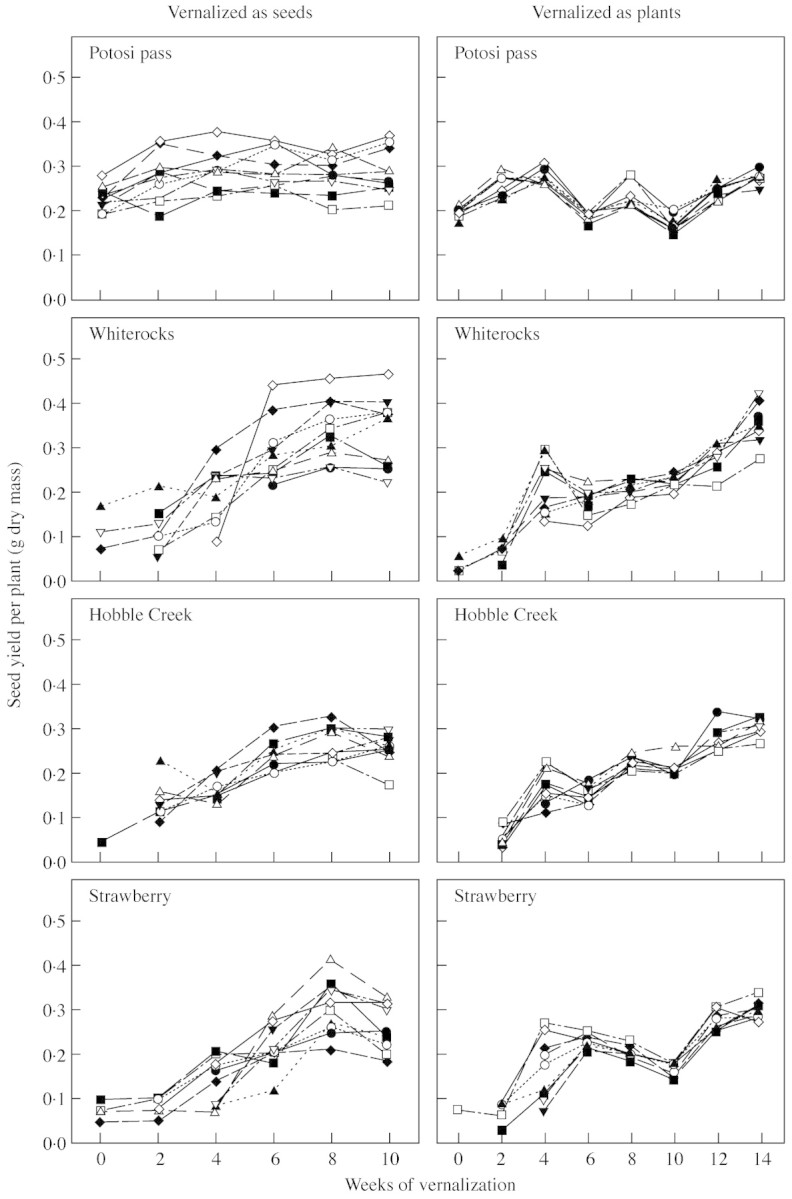
Fig. 7. Reaction norms for seed yield per plant in response to 0–10 weeks of vernalization as seeds and 0–14 weeks of vernalization as plants (3‐week‐old seedlings) for the seed progeny of ten randomly selected families in each of four B. tectorum populations.
DISCUSSION
Plants of B. tectorum in these experiments showed vernalization responses typical of winter annuals. In general, flowering proportion increased, time to flowering decreased and seed yield increased with increasing periods of vernalization when plants were subsequently grown under long days. Finnerty and Klingman (1962) reported similar increases in flowering proportion and decreases in time to flowering with vernalization periods from 7–30 d as seeds or seedlings for a Nebraska B. tectorum population. The relatively long flowering times they report (>8 weeks post‐vernalization) suggest that none of their vernalization regimes were saturating (Brooking, 1996). Richardson et al. (1986) found that 30 d vernalization as seeds was completely ineffective in promoting flowering for an eastern Washingon population, but as long as 30 d vernalization as established plants was carried out under short days, temperatures from 3–15 °C induced flowering under subsequent long days, with the most rapid flowering (3 weeks to initiation) after the 3 °C short‐day treatment. Baskin and Baskin (1981) reported that B. japonicus plants would flower without vernalization as long as they were grown under long days, but that vernalization as established plants for periods up to 6 weeks resulted in stepwise decreases in the time to flowering. Gleichsner and Appleby (1996) found that, for B. diandrus, vernalization was not necessary for flowering, but increasing the vernalization period as imbibed seeds from 0–4 weeks resulted in a decrease in time to flowering from 8 to 3 weeks. Similarly, increased periods of vernalization as established plants resulted in shorter time to flowering. But, unlike the plants in our experiments, for B. diandrus shortened time to flowering was associated with a decrease in seed yield per plant rather than an increase.
No major difference in vernalization response as seeds versus seedlings was seen in the present studies, although it is not possible to compare these results directly because the two experiments were carried out in different years. In fact, the biggest differences between the two experiments were seen in response to the no vernalization treatment. These differences could not be due to contrasting vernalization regimes, but instead must be due to unquantified differences in post‐vernalization conditions. Photoperiod was comparable between the two experiments because they were carried out without supplemental lighting under long days during the same season (i.e. from April to August). But there may have been differences between years in the temperature of the unheated greenhouse. Particularly during the first few weeks of the post‐vernalization period, when plants could have spent considerable time at temperatures in the vernalization range (<15 °C), differences between the two years could have had considerable impact. These effects could be quite complex, as the integration between vernalization and growth, especially at higher vernalization temperatures, is not easily interpretable (Brooking, 1996).
Temperatures in the range 0–5 °C are generally reported as optimum for vernalization, although temperatures as high as 15–20 °C can have a vernalizing effect under some conditions in some species (Chouard, 1960; Richardson et al., 1986; Fowler et al., 1996). Yan and Hunt (1999) have proposed a curvilinear temperature model for vernalization that uses only the minimum, optimum and maximum temperatures to model vernalization response at any temperature. Vernalization rate increases as a function of temperature from the minimum (taken as 0 °C) to the optimum, then decreases to zero as temperature increases to the maximum. Although we have insufficient data to fit this model for B. tectorum, results of Richardson et al. (1986) suggest a maximum around 15 °C and an optimum around 3 °C. Our regimes of 2 °C and 2–5 °C were probably close enough to the optimum that differences between the two experiments were likely not to be due to differences in vernalization temperature.
Major differences among populations in vernalization response were observed. These differences can be interpreted as a consequence of contrasting selection regimes on an array of founder genotypes. Plants of the warm desert Potosi Pass population did not require vernalization in order to flower, and showed no increase in seed yield and only minimal decreases in time to flowering in response to increasing vernalization period. This pattern of response is adaptive in the warm desert habitat, where the vernalization period is likely to be short and where early autumn establishment is unlikely, reducing the risk of premature flowering (Table 1). In contrast, plants of the cold desert, foothill and particularly the montane population from northern Utah showed more pronounced effects of increasing vernalization for all response variables. A well‐defined vernalization requirement is adaptive in these habitats, where autumn precipitation permits early establishment and its accompanying risk of premature flowering, and where winter vernalization conditions are more reliable.
Among‐population differences in flowering time in response to a common vernalization environment were also observed by Hulbert (1955) and Rice and Mack (1991a). Hulbert (1955) found that a population from the warm desert in Israel flowered more quickly than any of 15 North American populations in field trials at Pullman, Washington. Perhaps this population was similar to our warm desert Potosi Pass population in lacking a vernalization requirement. A minimal or non‐existant vernalization requirement is of clear adaptive significance in a warm desert habitat where winters are short and warm. The population from Israel was also not winter hardy, unlike the Potosi Pass population in this study, making it unlikely that the two populations have a common origin. Rice and Mack (1991a) found that time from October sowing to flowering in an unheated greenhouse in Pullman, Washington, was longest for a population from openings in a subalpine hemlock forest and shortest for a population from a valley greasewood flat, with a difference of approx. 40 d. It seems likely that the differences among populations in these two studies represent differences in vernalization requirement, in that times to flowering are different under a common, presumably marginally adequate, vernalization regime. The longer vernalization requirement in the high mountain population would be of adaptive significance in preventing premature flowering in autumn.
Our study clearly shows that measured differences in flowering phenology among populations are a function of vernalization regime, with large differences and consequently large measured variance after short, generally inadequate vernalization regimes (Tables 2–4). For example, an experiment with 4 weeks of vernalization as seeds would have given us a clear difference among populations in proportion of plants flowering, with a range from 45 % for the Strawberry population to 100 % for Potosi Pass (Fig. 1), while the data for 6 weeks of vernalization as seeds would have given us a similar conclusion for time to initiation of flowering, with a range from 4 weeks for Potosi Pass to 9 weeks for Strawberry (Fig. 2). As vernalization period was increased, these differences among populations largely disappeared.
Differences among lines (full‐sib families) within populations also tended to decrease with increasing vernalization period (Tables 2–4), so that estimates of heritability, such as the intraclass correlation coefficient [(among‐family variance – within family variance)/(among‐family variance + within‐family variance); Rice and Mack 1991a], would also tend to decrease. This suggests that the genetic variation that is present within populations represents variation in vernalization requirement and not in flowering time per se.
There was also considerable variation among populations in the degree of difference among lines for the three traits as measured by among‐family variance (Fig. 4). In general, the Potosi Pass population showed the least variability among lines and the Whiterocks population showed the most. This result is in accordance with results on phenotypic variation in seed dormancy for these same populations and lines (Meyer and Allen, 1999a).
Ramakrishnan (2002) showed that all ten lines from the Potosi Pass population included in these studies represent a single unique microsatellite marker genotype, while the ten lines from Whiterocks represented nine different marker genotypes, and the Hobble Creek and Strawberry populations were represented by intermediate numbers of genotypes. The concordance between neutral molecular markers and phenotypic traits in these four populations supports the conclusion that different inbreeding lines characterized by distinctive molecular marker fingerprints may also possess distinctive genotypes for adaptively significant traits. Introduction of inbreeding lines through dispersal into an area is presumed to be a random process. The presence of habitat‐correlated variation in adaptively significant traits is therefore most likely a result of habitat‐specific selection regimes operating on an array of founder genotypes within a population.
ACKNOWLEDGEMENTS
This research was supported in part by Grant 98‐35303‐6957 from the US Department of Agriculture, Cooperative State Research, Extension, and Education Service, National Research Initiative Plant Pathology Program.
Supplementary Material
Received: 20 February 2003; Returned for revision: 7 May 2003; Accepted: 29 January 2004; Published electronically: 15 April 2004
References
- BaskinJM, Baskin CC.1981. Ecology of germination and flowering in the weedy winter annual grass Bromus japonicus Journal of Range Management 34: 369–372. [Google Scholar]
- BauerMC, Meyer SE, Allen PS.1998. A field simulation model to predict seed dormancy loss for Bromus tectorum Journal of Experimental Botany 49: 1235–1244. [Google Scholar]
- BrookingIR.1996. Temperature response of vernalization in wheat: a developmental analysis. Annals of Botany 78: 507–512. [Google Scholar]
- ChauvelB, Munier‐Jolain NM, Grandgirard D, Gueritaine G.2002. Effect of vernalization on the development and growth of Alopecurus myosuroides Weed Research 42: 166–175. [Google Scholar]
- ChouardP.1960. Vernalization and its relations to dormancy. Annual Review of Plant Physiology 11: 191–238. [Google Scholar]
- ChristensenM, Meyer SE, Allen PS.1996. A hydrothermal time model of seed after‐ripening in Bromus tectorum L. Seed Science Research 6: 155–163. [Google Scholar]
- D’AntonioCM, Vitousek PM.1992. Biological invasions by exotic grasses, the grass‐fire cycle, and global change. Annual Review of Ecology and Systematics 23: 63–88. [Google Scholar]
- DonaldWW.1984. Vernalization requirements for flowering of jointed goatgrass (Aegilops cylindrica). Weed Science 32: 631–637. [Google Scholar]
- FinnertyDW, Klingman DL.1962. Life cycles and control studies of some weed bromegrasses. Weeds 10: 40–47. [Google Scholar]
- FloodRG, Halloran GM.1984. The nature and duration of gene action for vernalization response in wheat. Annals of Botany 53: 363–368. [Google Scholar]
- FowlerDB, Limin AE, Wang S, Ward RW.1996. Relationship between low‐temperature tolerance and vernalization response in rye and wheat. Canadian Journal of Plant Science 76: 37–42. [Google Scholar]
- GleichsnerJA, Appleby AP.1996. Effects of vernalization on flowering in ripgut brome (Bromus diandrus). Weed Science 44: 57–62. [Google Scholar]
- HulbertLC.1955. Ecological studies of Bromus tectorum and other annual bromegrasses. Ecological Monographs 25: 181–213. [Google Scholar]
- LandersKF.1995. Vernalization responses in narrow‐leaved lupin (Lupinus angustifolius) genotypes. Australian Journal of Agri cultural Research 46: 1011–1025. [Google Scholar]
- LoskutovIG.2001. Influence of vernalization and photoperiod to the vegetation period of wild species of oats (Avena spp.). Euphytica 117: 125–131. [Google Scholar]
- MackRN.1981. Invasion of Bromus tectorum L. into western North America: an ecological chronicle. AgroEcosystems 7: 145–163. [Google Scholar]
- McIntyreGI, Best KF.1978. Studies on the flowering of Thlaspi arvense L. IV. Genetic and ecological differences between early‐ and late‐flowering strains. Botanical Gazette 139: 190–195. [Google Scholar]
- McKoneMK.1985. Reproductive biology of several bromegrasses (Bromus): breeding system, pattern of fruit maturation, and seed set. American Journal of Botany 72: 1334–1339. [Google Scholar]
- MeyerSE, Allen PS.1999a. Ecological genetics of seed germination regulation in Bromus tectorum I. Phenotypic variance among and within populations. Oecologia 120: 27–34. [DOI] [PubMed] [Google Scholar]
- MeyerSE, Allen PS.1999b. Ecological genetics of seed germination regulation in Bromus tectorum L. II. Reaction norms in response to a water stress gradient imposed during seed maturation. Oecologia 120: 35–43. [DOI] [PubMed] [Google Scholar]
- MeyerSE, Allen PS, Beckstead J.1997. Seed germination regulation in Bromus tectorum (Poaceae) and its ecological significance. Oikos 78: 475–485. [Google Scholar]
- MeyerSE, Nelson DL, Clement S.2001. Evidence for resistance polymorphism in the Bromus tectorum – Ustilago bullata pathosystem: Implications for biocontrol. Canadian Journal of Plant Pathology 23: 1–9. [Google Scholar]
- PiersonEA, Mack RN.1990. The population biology of Bromus tectorum in forests: Distinguishing the opportunity for dispersal from environmental restriction. Oecologia 84: 526–533. [DOI] [PubMed] [Google Scholar]
- RamakrishnanAP.2002.Molecular marker variation and its ecological significance in Bromus tectorum L. MSc thesis, Brigham Young University, Provo, Utah. [Google Scholar]
- RiceKJ, Mack RN.1991a. Ecological genetics of Bromus tectorum. I. A hierarchical analysis of phenotypic variation. Oecologia 88: 77–83. [DOI] [PubMed] [Google Scholar]
- RiceKJ, Mack RN.1991b. Ecological genetics of Bromus tectorum. III. The demography of reciprocally‐sown populations. Oecologia 88: 91–101. [DOI] [PubMed] [Google Scholar]
- RichardsonJM, Morrow LA, Gealy DR.1986. Floral induction of downy brome (Bromus tectorum) as influenced by temperature and photoperiod. Weed Science 34: 698–703. [Google Scholar]
- WalentaDL, Yenish JP, Young FL, Ball DA.2002. Vernalization response of plants grown from spikelets of spring and fall cohorts of jointed goatgrass. Weed Science 50: 461–465. [Google Scholar]
- WhisenantSG.1990. Changing fire frequencies on Idaho’s Snake River Plains: ecological and management implications. In: McArthur ED, Romney EM, Smith SD, Tueller PT, eds. Proceedings – Symposium on cheatgrass invasion, shrub die‐off, and other aspects of shrub biology and management Ogden, Utah: USDA Forest Service General Technical Report INT‐276, 4–10. [Google Scholar]
- YanW, Hunt LA.1999. Reanalysis of vernalization data of wheat and carrot. Annals of Botany 84: 615–619. [Google Scholar]
- ZarJH.1984.Biostatistical analysis. Second edition. Englewood Cliffs, NJ, USA: Prentice Hall, pp. 718. [Google Scholar]
Associated Data
This section collects any data citations, data availability statements, or supplementary materials included in this article.


