Abstract
• Background and Aims The relationship between composition and structure of plant primary cell walls, and cell mechanical properties is not fully understood, partly because intrinsic properties of walls such as Young’s modulus cannot be obtained readily. The aim of this work is to show that Young’s modulus of walls of single suspension‐cultured tomato cells can be determined by modelling force‐deformation data.
• Methods The model simulates the compression of a cell between two flat surfaces, with the cell treated as a liquid‐filled sphere with thin compressible walls. The cell wall and membrane were taken to be permeable, but the compression was so fast that water loss could be neglected in the simulations. Force‐deformation data were obtained by compressing the cells in micromanipulation experiments.
• Key Results Good fits were obtained between the model and low‐strain experimental data, using the modulus and initial inflation of the cell as adjustable parameters. The mean Young’s modulus for 2‐week‐old cells was found to be 2·3 ± 0·2 GPa at pH 5. This corresponds to an instantaneous bulk modulus of elasticity of approx. 7 MPa, similar to a value found by the pressure probe method. However, Young’s modulus is a better parameter, as it should depend only on the composition and structure of the cell wall, not on bulk cell behaviour. This new method has been used to show that Young’s modulus of cultured tomato cell walls is at its lowest at pH 4·5, the pH optimum for expansin activity.
• Conclusions The linear elastic model is very suitable for estimating wall Young’s modulus from micromanipulation experiments on single tomato cells. This is a powerful method for determining cell wall material properties.
Key words: Tomato, cell wall, micromanipulation, Young’s modulus
INTRODUCTION
The relationship between the composition and structure of plant primary cell walls, and cell mechanical properties is not fully understood. The strength of the cell wall is considered to be mainly due to cellulose microfibrils (Fry, 1995) but the contribution of other wall components and their interaction with cellulose is not clear (Cosgrove, 2000a). Ideally, one would relate the material properties of the cell wall to its composition and structure, preferably using a functional genomics approach, and consider how and why these properties respond to the cell environment. In this respect, the relative simplicity of undifferentiated single cells from suspension cultures makes them a useful tool. Using single cells, one could conceive of using functional genomics to define the roles of different cell wall polymer types in determining cell wall mechanical behaviour. However, no reliable method of measuring the material properties of walls of single cells has yet been reported.
Using mainly uniaxial stretching, mechanical tests on isolated walls have indicated that the cell wall material is non‐linear viscoelastic‐plastic (e.g. Kawamura et al., 1995). Attempts have been made to simulate turgor and multiaxial tensions in some experiments (Kamiya et al., 1963; Richmond et al., 1980), but it would be preferable to study walls in situ with the actual turgor and original geometry of living cells. The properties of living and dead cells with growing or non‐growing walls may be different. A micro‐penetration technique has been used for mechanical testing of potato tuber parenchyma tissue (Hiller et al., 1996; Davies et al., 1998), leading to calculated values of cell wall stiffness. Unfortunately these values depended on a difficult estimation of cell radius. In any case, this method cannot be used on single cells, although it is a potentially valuable method for studies on tissue.
The pressure probe is an excellent tool for studying plant water relationships and can provide some mechanical property measurements (Tomos, 2000). However, it has only rarely been used on single suspension cells (Tomos and Leigh, 1999; Hukin, 2002). Furthermore, the pressure probe method can only cause small deformations, not deformations leading to cell bursting. Therefore it cannot be used to investigate the full range of cell wall mechanical behaviour.
A method of studying particle mechanics that has recently been used on many cell types is micromanipulation, in which a single cell is compressed between flat, parallel surfaces to provide information on the whole‐cell mechanical response to an applied compressive load (Zhang et al., 1991; Thomas et al., 2000). Initial work on tomato cells from suspension cultures has been undertaken using such compression experiments (Blewett et al., 2000), and it has been shown that force‐deformation data can be obtained up to cell bursting. Key measurements are bursting force and percentage deformation at bursting, but these are not ‘intrinsic’ properties of the walls, i.e. they have values that depend on the measurement method. Intrinsic wall material parameters such as Young’s modulus are required if the mechanical properties of the wall are ever to be related to its composition and structure. It would be useful therefore to be able to extract these properties from force‐deformation data, and this can be achieved by mathematical modelling. As pointed out by Smith et al. (1998), this task is facilitated if the form of the cell wall constitutive equation is known a priori. The cell wall material properties can then be determined by matching the force‐deformation response of the mathematical model to that obtained in a compression experiment.
Several investigators have modelled the compression mechanics of thin‐walled, liquid‐filled spheres. Thin walls in this mechanical context are often referred to as ‘membranes’. Such a membrane is a thin material element that cannot support bending stresses across its thickness. A cell wall might be considered to be a (mechanical) membrane. Feng and Yang (1973) considered the problem of the deformation and the consequential stresses in an inflated, non‐linear elastic, gas‐filled spherical membrane compressed between two frictionless rigid plates. Lardner and Pujara (1980) extended this model further by considering the sphere to be filled with an incompressible liquid rather than gas. Their model was able to predict accurately the deformation of sea urchin eggs, as previously reported by Yoneda (1973). Liu et al. (1996) improved the computational algorithm, and applied the model to data on microcapsules. None of these studies allowed for water loss from the sphere. Smith et al. (1998) created a finite element model in which volume loss was included, and applied this to compression data from yeast cells (Smith et al., 2000). Using a finite element method, it was possible in principle to consider any cell wall material constitutive equation, although in practice Smith et al. (2000) only considered the linear elastic case.
There are only two reports of use of the compression experiment to characterize intrinsic material properties of plant primary cell walls. Liu (1995) attempted to estimate Young’s modulus from compression experiments on single pericarp tissue tomato cells, but obtained few data. In an extensive study, Blewett (2000) developed the experimental method used here, but found it difficult to derive Young’s modulus by mathematical modelling. Bounds of 100–2300 MPa were found for single suspension‐cultured tomato cells. In the present work, a linear elastic material model was used to determine Young’s modulus of walls of single undifferentiated tomato cells from suspension cultures. The quality of the fit of this model to experimental data, and the sensitivity of the model to changes in parameter values, were investigated.
MATERIALS AND METHODS
Tomato cell suspensions
Cell cultures and isolation of single tomato cells have been described elsewhere (Blewett et al., 2000). The tomato cell line Lycopersicon esculentum vf36 was used as a model system. This is a suspension culture derived from a root radicle callus (provided by Unilever Research Colworth, Bedford, UK). Cells were subcultured weekly in medium consisting of MS basal salts (43 g for 10 L), 30 g sucrose L–1, 2 mg 2,4‐dichlorophenoxy acetic acid (2,4‐D) L–1, 1 mg 2,isopentyladenine L–1, and 50 µL vitamin solution (100 mg nicotinic acid, 40 mg glycine, 10 mg pyridoxine hydrochloride, 10 mg thiamine hydrochloride, 10 mg folic acid, 1 mg biotin, 20 mL water). The pH was initially 6·0. Cells were grown in a horizontal rotary shaker set at 100 rpm and 25 °C with low light. Suspension cultures obtained by this method are nearly in synchronous growth, and so the cells within a sample are of similar age (Blewett et al., 2000).
Single cells were evident in the culture from week 2 and passage through a 72 µm mesh separated them from any aggregates. The single cells were suspended in 0·03 m mannitol at pH 5, the same osmolality and pH as the medium at harvest. They were held at 27 ± 1 °C during compression testing.
Compression experiment
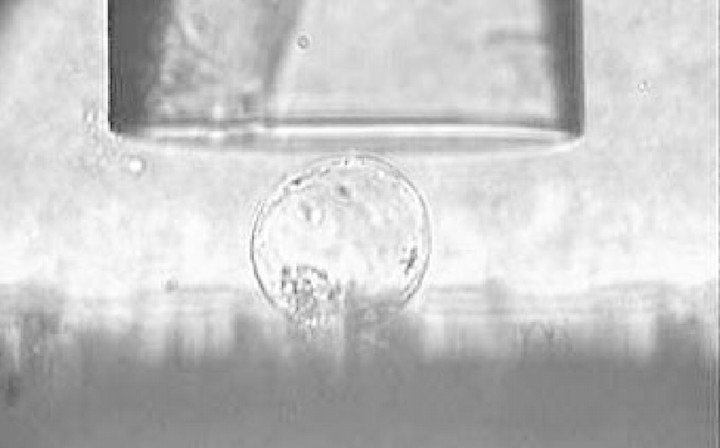
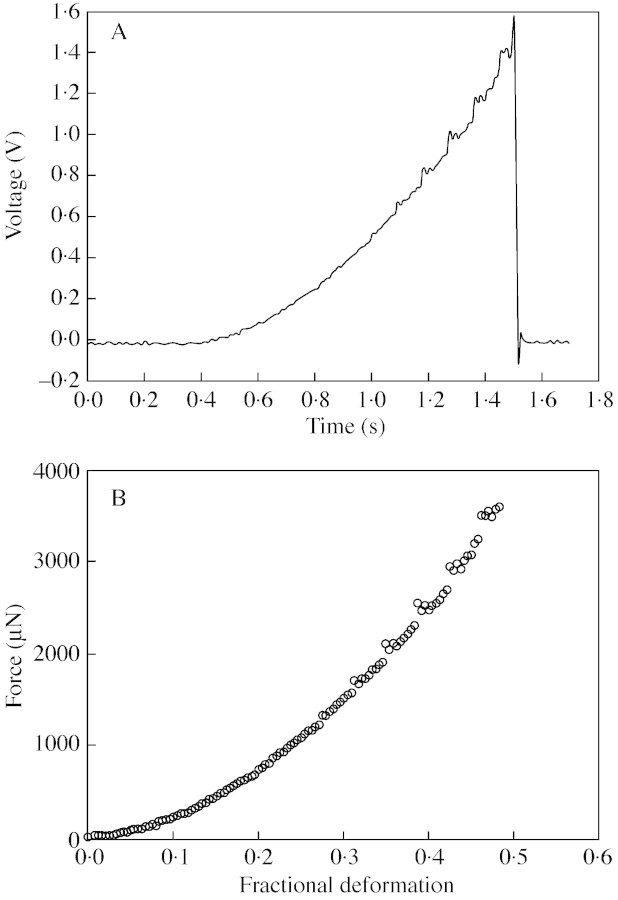
The basic experimental apparatus and procedure were described by Blewett et al. (2000). Cells were compressed between the flat end of an optic fibre (the micromanipulation probe) and a glass surface (see Fig. 1). The probe was mounted on a force transducer, which in turn was mounted on a micromanipulator (MicroInstruments Ltd, Oxford, UK). This allowed the probe to be driven at a chosen speed towards the slide, compressing the cell. The chosen speed here was 23 µm s–1. The voltage and the time of deformation could be recorded on a PC‐30D data acquisition card (Amplicon Live‐line, Brighton, UK) in a personal computer. Figure 2A shows typical raw data. A five‐point moving average was used to smooth the data and to determine the exact start of the compression. Using the speed of motion of the probe, and allowing for compliance (Mashmoushy et al., 1998), the probe displacement and the cell deformation could be calculated, and a force‐deformation curve generated, as shown in Fig. 2B.
Fig. 1. Photograph of a single tomato cell from a suspension culture being compressed between a micromanipulation probe and a glass surface.
Fig. 2. (A) Raw voltage–time data for compression of a single tomato cell, and (B) the corresponding calculated force‐deformation curve.
The parameters required and the measurements taken
To remove some of the risks of the model producing non‐unique solutions that would fit the experimental curve using different combinations of parameter values (Smith et al., 1998), some of the parameters were fixed by using values previously measured on cells grown under the same conditions. These are described below.
Initial thickness of the cell wall.
Using freeze‐fracture scanning electron microscopy, the mean cell wall thickness of 2‐week‐old tomato cells from suspension cultures has been found to be 126 ± 16 nm (Blewett, 2000). This value was used as the initial wall thickness in the model.
Internal osmotic pressure of the cell and the initial turgor pressure.
The mean initial osmotic pressure of the cells under the conditions of test was measured directly by single‐cell sampling followed by freezing point depression (Tomos et al., 1994). The mean initial turgor pressure was calculated by subtracting the external osmolality from the internal osmolality. For the 2‐week‐old tomato cells, the mean initial osmotic pressure difference and therefore the mean initial turgor pressure was found to be 0·363 MPa.
MODELLING
Model definition
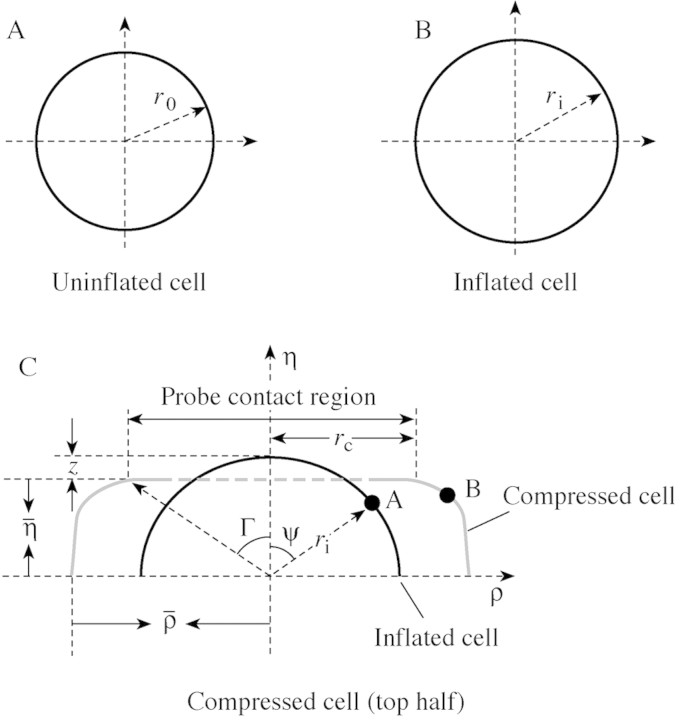
To derive material properties from force‐deformation data, a mechanical model must be developed. The model formulated here is based on that of Lardner and Pujara (1980), considering the plant cell wall and membrane as a liquid‐filled sphere. Unlike Lardner and Pujara (1980), the wall is considered to be permeable. The outer radius of the uninflated sphere (equivalent to the cell at incipient plasmolysis) is r0 (Fig. 3A; see Table 1 for list of symbols used) and its initial wall thickness is h0. The sphere is inflated by an internal pressure to an outer radius of ri (Fig. 3B). Then the initial stretch ratio λs is defined as λs = ri/r0. The inflated sphere is then compressed between two flat, parallel surfaces, with the top surface moving at a constant velocity towards the bottom surface. Following Lardner and Pujara (1980), it is also assumed that the cell is axi‐symmetrical around its vertical axis before and during compression, and is symmetric across its equatorial plane. The geometry of this problem is shown in Fig. 3C.
Fig. 3. Schematic diagram showing: (A) the geometry of the initial sphere; r0 is the initial radius of the cell before inflation; (B) the geometry of the inflated sphere before compression; ri is the radius of the cell after inflation; and (C) the geometry of a compressed sphere; η is the half‐distance between the probe surface and the plate, ρ is the maximum radius of the deformed wall and membrane. In compression, a typical point like A, at an angle ψ to the vertical axis of symmetry, moves to point B. The angle Γ identifies points that move to the edge of the contact region, which has radius rc.
Table 1.
List of symbols
| A | Surface area available for flux, µm2 |
| E | Young’s modulus, MPa |
| F | Compressive force, µN |
| h 0 | Initial wall thickness, nm |
| L p | Hydrostatic conductivity, ms–1 MPa–1 |
| P | Turgor pressure, MPa |
| r 0 | Initial cell radius, µm |
| r c | Radius of contact region, µm |
| r i | Inflated cell radius, µm |
| t | Time, s |
| T | Membrane tension, N m–1 |
| v | Probe velocity, µm s–1 |
| V | Instantaneous internal volume, µm3 |
| W | Strain energy function |
| X | Deformation |
| z | Half the distance that the cell has been compressed, µm |
| Greek letters | |
| ϵ | Bulk modulus of elasticity, MPa |
| η | Coordinate perpendicular to the cell equatorial plane |
| η | Half distance between the probe surface and the plate |
| λ | Principle stretch ratio |
| λs | Initial stretch ratio |
| ν | Poisson’s ratio |
| Δπ | Osmotic pressure difference, MPa |
| ρ | Coordinate in equatorial plane |
| ρ | Maximum radius of the deformed sphere |
| ψ | Angular position of point on cell wall from vertical axis of symmetry |
| Γ | Value of ψ for points on the edge of the contact region |
| Subscripts | |
| i | Inflated state |
| 0 | Initial state |
| 1 | Meridian direction |
| 2 | Equatorial direction |
The liquid is taken to be incompressible, but the wall is considered permeable and so the internal volume decreases with compression. Equation (1) describes the volume change (Kedem and Katchalky, 1958).

where V is the instantaneous internal volume, t is time, Lp is the hydraulic conductivity of the cell wall, A is the area available for flow, ΔP = Pexternal – Pinternal is the hydrostatic pressure difference and Δπ = πexternal – πinternal is the osmotic pressure difference. As the probe velocity (v) is constant, the volume change can be related to the distance that the cell has been compressed, rather than to time (Smith et al., 1998):

where z is half the distance the cell has been compressed (see Fig. 3C). Equation (2) assumes that solutes do not pass through the cell membrane, that the cytoplasm is a dilute and ideal solution, and that the hydraulic conductivity of the wall, Lp, is constant throughout compression. It is further assumed here that the osmotic pressure difference (Δπ) is constant during compression, i.e. the water flows into or out of the cell cause negligible changes in internal cell solute concentrations. The area available for flow is taken to be the exposed area, i.e. the area not in contact with the two flat surfaces.
To model the cell, the cell wall material properties (its constitutive equation) need to be considered. Here the cell wall is considered to be isotropic and its constitutive equation to be linear elastic and compressible (Poisson’s ratio ν is not 0·5). The behaviour is also assumed to be time‐independent, i.e. no viscoelasticity. It should be noted that the time‐scale of the compression experiments is of the order of 1 s, far too rapid for many physiological responses that may change the cell wall material characteristics, e.g. the creep phenomenon described by Cosgrove (2000b).
The theoretical analysis and numerical simulation
The derivation of the equations governing the deformation of the cell is based on analysis by Feng and Yang (1973) and Lardner and Pujara (1980). The derivation is given in the Appendix.
In the numerical simulations, the governing equations were solved by a Runge–Kutta method, using the Matlab (MathWorks Inc.) ode45 solver. As the chosen constitutive equation for the wall material is time‐independent, the compression of the cell was solved as a series of static equilibrium problems following the calculation procedure of Liu et al. (1996). In each step, the model simulates the displacement of the probe corresponding to the time between steps. The probe displacement deforms the cell from its previous shape. During the time taken for the step there may be water loss, depending on the wall permeability. At the end of the step, the volume of the deformed sphere is determined from the calculated cell boundary coordinates ρ and η (see Fig. 3C). The equations are given in the Appendix. As in the method of Liu et al. (1996), the simulated pressure is then adjusted until the new volume equals the previous volume minus any estimated water loss. This pressure is then the starting pressure for the next step. The simulations lead to predicted force‐deformation data, which depend on the values of the model parameters. These are the hydraulic conductivity (Lp), which determines the water flow from the cell; Young’s modulus (E); Poisson’s ratio (ν), which describes the compressibility of the cell wall material; and the initial stretch ratio (λs), which is the diameter of the cell at the start of compression compared with that at incipient plasmolysis.
Dimensionless analysis
To reduce the number of variables and to gain insight, a dimensionless analysis was conducted. The force has a dimensionless form of F/(Eh0r0λ02) and the deformation X = z/(r0λs), where z is half the distance the cell has been compressed, i.e. half the displacement of the probe.
RESULTS
One aim of developing the model was to run a series of simulations that would show how changes in the parameters alter the shape and magnitude of the force‐deformation curves generated by the model. These simulations were carried out by changing the hydraulic conductivity (Lp), Poisson’s ratio (ν) and initial stretch ratio (λs). Other parameters were either fixed a priori (h0, Δπi and v) or were to be found by fitting (E).
Effect of hydraulic conductivity (Lp)
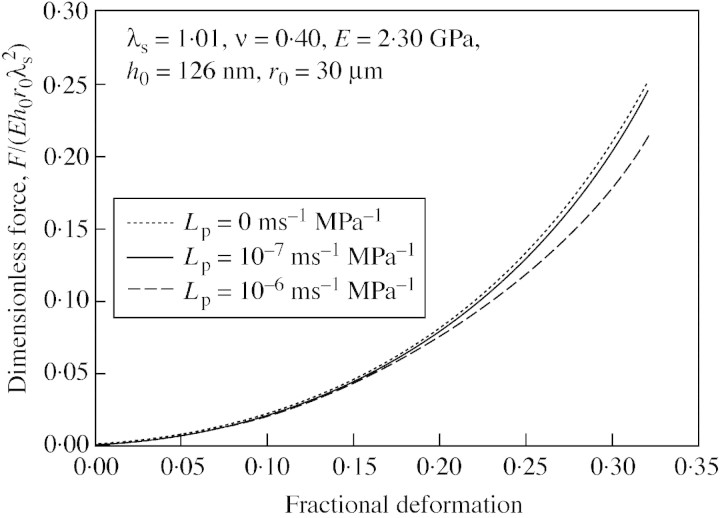
Typical simulation results are shown in Fig. 4. It can be seen that increasing the hydraulic conductivity (Lp) produced a lower force for a given displacement. If the cell membrane has a higher hydraulic conductivity, then the resistance to flow is lower, and this will lead to a lower increase in pressure during the deformation because of the greater water loss. It has been reported that Lp values of different plant cell types range from 2 × 10⁻⁸ to 10–5 ms–1 MPa–1 (Maurel, 1997). For single tomato cells, the hydraulic conductivity is about 10–7 ms–1 MPa–1 (Maggio et al., 1995; Hukin et al., 2002). The two curves in Fig. 4 for Lp = 0 and Lp = 10–7 ms–1 MPa–1 almost coincide, especially at smaller cell deformations (up to about 20 %). So, although the wall is considered permeable, it is reasonable in the case of rapid compression at small deformations to neglect water loss in simulations.
Fig. 4. Simulation of how hydraulic conductivity changes can alter the dimensionless force‐deformation curves generated with the linear elastic model (initial stretch ratio, 1·01; Poisson’s ratio, 0·40; initial cell radius, 30 µm; compression speed, 23 µm s–1; Young’s modulus, 2·30 GPa; initial wall thickness, 126 nm).
Effect of Poisson’s ratio (ν)
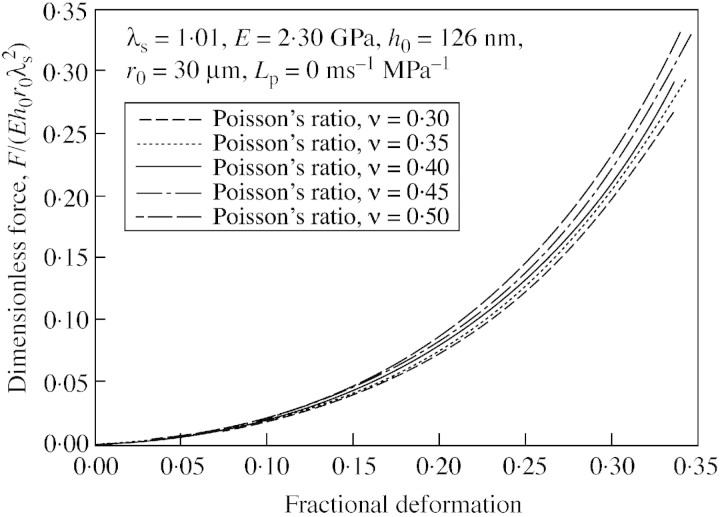
In previous analyses of compression of a liquid‐filled sphere or a cell (Lardner and Pujara, 1980; Smith et al., 1998), the wall was taken to be incompressible, equivalent to a Poisson’s ratio of 0·5. In this study cell wall material is considered to be compressible, with a Poisson’s ratio of less than 0·5. However, no data are available concerning the Poisson’s ratio of tomato cell walls and there is no reliable method to measure this parameter. Therefore a range of values from 0·3 to 0·5 was used in simulations to investigate the influence of Poisson’s ratio on the force‐deformation curves. Figure 5 shows typical simulation results. There is no great difference in the force at a given deformation for a change in Poisson’s ratio from 0·3 to 0·5, especially at small deformations. This is consistent with the low sensitivity to Poisson’s ratio of the calculated elastic modulus of cell walls of potato tuber parenchyma tissue, found by a micro‐penetration technique (Hiller et al., 1996). To confirm that the results are insensitive to Poisson’s ratio, the simulated deformed profiles of the compressed cells were compared at a different Poisson’s ratio. No difference was observed that could be distinguished easily (e.g. by image analyses of cell profiles). Thus, it was not possible to obtain a reliable value of Poisson’s ratio from fits to force‐deformation data, but as the choice is not critical, a Poisson’s ratio of 0·4 was chosen for all subsequent model fits.
Fig. 5. Influence of Poisson’s ratio on the force‐deformation curves generated with the linear elastic model (initial stretch ratio, 1·01).
Effect of initial stretch ratio (λs)
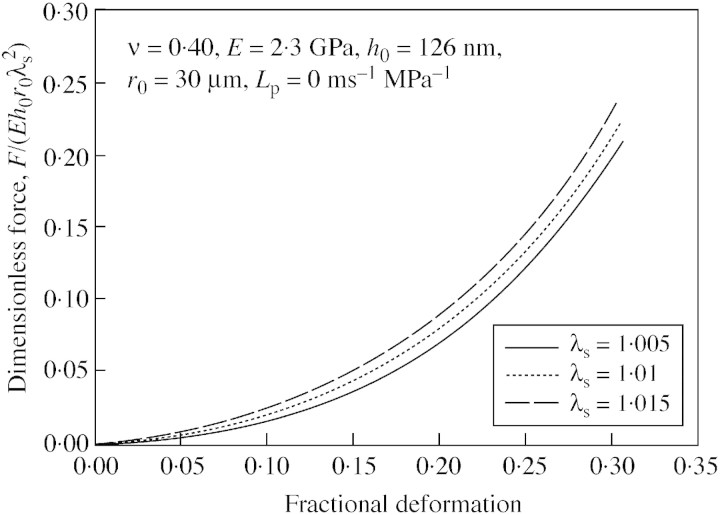
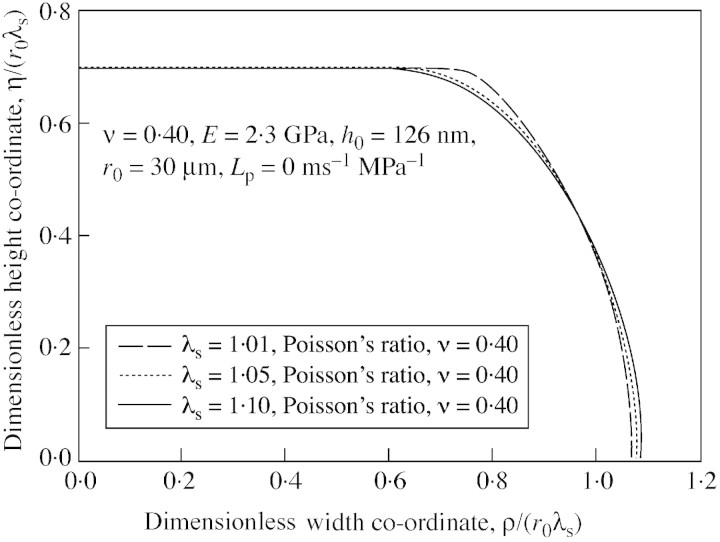
Among the factors that might influence the force‐deformation curves, some were fixed a priori. These were the initial thickness of the cell wall (126 nm), the osmotic pressure difference across the cell wall (0·363 MPa), and the probe motion velocity (23 µm s–1). As described above, hydraulic conductivity and Poisson’s ratio were not found to be of significance. However, the initial stretch ratio, λs, i.e. the inflation of cell above incipient plasmolysis, was potentially important. It is very difficult to measure the initial stretch ratio of tomato cells accurately and, in any case, it is not practical to measure this ratio for individual cells before each compression experiment. Therefore a series of initial stretch ratios were tried in simulations. Figure 6 shows the resulting simulated force‐deformation curves. The influence of initial stretch ratio on force‐deformation curves was clearly significant. A check on the simulated shape of the cell boundary confirmed this (see Fig. 7).
Fig. 6. Influence of initial stretch ratio on the dimensionless force versus deformation curves generated with the linear elastic model (Poisson’s ratio, 0·40).
Fig. 7. Influence of initial stretch ratio on the cell wall boundary shapes generated with the linear elastic model.
Given the significance of λs, and the difficulty of its measurement, it was decided to treat it as an adjustable parameter to be identified during data fitting.
DATA ANALYSIS
Matching force‐deformation curves
The remaining unknowns, i.e. initial stretch ratio λs and Young’s modulus, E, can be found by matching force‐deformation curves from simulations with data obtained from compression experiments. A series of simulations with different initial stretch ratios were generated. The values chosen were 1·005, 1·01, 1·015, 1·02, 1·03, 1·04 and 1·05. Figure 6 shows data for initial stretch ratios of 1·005, 1·01 and 1·015 only. In each case simulated and experimental force‐deformation curves were compared for deformations up to 20 %, with Young’s modulus adjusted to give best fit, using a minimum root mean square error. For each experimental force‐deformation curve, this method resulted in a value of Young’s modulus for each λs value. Root mean square errors were then used to choose overall best fit, and therefore to determine the best value of λs and Young’s modulus.
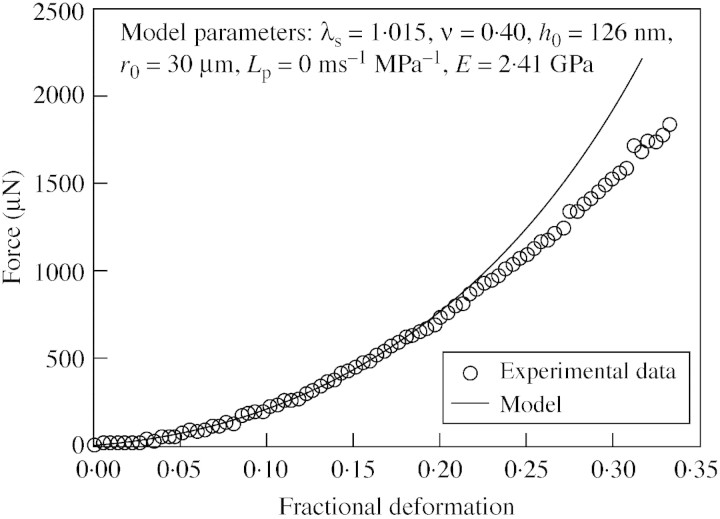
An example of such fitting is shown in Table 2 and Fig. 8. As can be seen from Table 2, the best value of λs and Young’s modulus for these data were 1·015 and 2·41 GPa, respectively. The good fit, which is typical, indicates that the linear elastic model is suitable for determining the Young’s modulus of the walls of the tomato cells used in this study. Fitting data from 22 cells, the mean Young’s modulus of 2‐week‐old tomato cell walls at pH 5·0 and 27 °C was found to be 2·3 ± 0·2 GPa, which is comparable with values reported in the literature, as discussed later. An average initial stretch ratio of 1·01 ± 0·002 was obtained, consistent with a value of 1·01 ± 0·002 found using image analysis on similar cells (Blewett, 2000). This shows that it is possible to determine the initial stretch ratio of tomato cells through modelling force‐deformation data.
Table 2.
Example of fitting the model to force‐deformation data up to 20 % cell deformation, and the choice of best fit
| Initial stretch ratio, λs | Young’s modulus, E (GPa) | Root mean square errors |
| 1.005 | 3.26 | 0.0075 |
| 1.01 | 2.76 | 0.0046 |
| 1.015 | 2.41 | 0.0038 |
| 1.02 | 2.15 | 0.0039 |
The minimum root mean square error was 0.0038. The chosen initial stretch ratio, λs, was therefore 1.015, with a corresponding Young’s modulus of 2.41 GPa.
Fig. 8. An example of a fit of the experimental data to the model up to bursting using low‐strain parameters (parameters for the model: initial stretch ratio, 1·015; Poisson’s ratio, 0·40; initial thickness of the cell wall, 126 nm; Lp = 0 ms–1 MPa–1; Young’s modulus for the cell wall, 2·41 GPa).
Because the micromanipulation method does not allow meaningful hysteresis experiments on rapidly adapting cells, the appropriate deformation range for elastic behaviour of the cell walls could not be found directly. The chosen upper bound of 20 % cell deformation was validated by determining Young’s modulus for the typical data of Fig. 2, with upper bounds of 10, 15, 20 and 25 % cell deformation. Table 3 shows the results. The modulus was not significantly different whether 10, 15 or 20 % was used, but appeared to drop at 25 %. This suggested elastic behaviour up to 20 % cell deformation. It should be noted that the correlation coefficient for all the bounds was very high (>0·95). It was assumed that an upper bound of cell deformation of 20 % could be used in all subsequent analyses, and this was confirmed by continued good fits of experimental and simulation data. 20 % cell deformation represents a wall strain of about 0·07 at the cell equator.
Table 3.
Influence of choice of upper bound of the cell deformation range fitted by the model
| Upper deformation bound (%) | Young’s modulus, E (GPa) | Initial stretch ratio, λs |
| 10 | 2.39 | 1.015 |
| 15 | 2.43 | 1.015 |
| 20 | 2.41 | 1.015 |
| 25 | 1.78 | 1.03 |
DISCUSSION
Compression of cells by micromanipulation can be used to obtain force‐deformation data up to cell bursting. However, bursting force and percentage deformation at bursting are not intrinsic parameters, as they depend on bulk cell behaviour, not only on cell wall composition and structure. In the present study, a linear elastic material model has been used to extract Young’s modulus of cell walls of single suspension tomato cells from low‐strain force‐deformation data. Although the cell wall and membrane were taken to be permeable and the model could therefore account for any volume loss by flow from the cell, this was found to be insignificant on the time scale of the compression (1 s), assuming a reasonable value for the hydraulic conductivity of single tomato cells (10–7 ms–1 MPa–1). Water loss through the cell wall was therefore neglected in simulations. However, given the range of Lp values for plant cells in general (2 × 10⁻⁸ to 10–5 ms–1 MPa–1; Maurel, 1997), this assumption might not be true for compression tests on other plant cell types nor indeed on single tomato cells under other conditions. Should the assumption not be valid, simulations could still allow for water loss during compression, using a separately determined value of Lp. Preliminary studies have shown that Lp might be found by compressing cells and holding them, and measuring volume loss directly using image analysis (Blewett, 2000). This would be a powerful adjunct to the present method.
The cell wall was taken to be compressible in this study, which meant that Poisson’s ratio could not be 0·5, as often assumed in other compression experiment studies (e.g. Lardner and Pujara, 1980; Smith et al., 2000). However, it was shown in the simulations that there was no great difference in the force at a given deformation for changes in Poisson’s ratio from 0·3 to 0·5. This is unfortunate, as it does not seem likely that the Poisson’s ratio of plant cell walls could ever be estimated from force‐deformation data, or even from a study of the cell shape during compression. On the other hand, the insensitivity of the modelling to this ratio means that Young’s modulus might be found without this knowledge. The choice of a Poisson’s ratio of 0·4 for model fitting seems reasonable, although it would be equally acceptable from a modelling viewpoint to assume a value of 0·5, i.e. incompressible cell walls.
Compared with Poisson’s ratio, the influence of Young’s modulus and initial stretch ratio on the force‐deformation curves was found to be very significant. Adjusting these parameters allowed very good fits between model and low‐strain experimental data. Low strain in this study was taken to mean <20% cell deformation. Typically this represents wall strains of <0·07. The good fitting up to these strains indicates that the linear elastic model is very suitable for determining primary cell wall Young’s moduli from micromanipulation experiments, at least for these undifferentiated tomato cells. It is not known if this observation is applicable to other plant cell types.
The mean Young’s modulus of the walls of 2‐week‐old cultured tomato cells was found to be 2·3 ± 0·2 GPa. This value cannot be compared with values for similar cells in the literature, as such data are not available. Besides Blewett (2000), who estimated values for single suspension‐cultured tomato cells of 100–2300 MPa, the nearest study was on potato tuber parenchyma tissue cells, using a micro‐penetration technique (Hiller et al., 1996). A value of 3 GPa was indicated by the analysis, assuming a cell wall thickness of 100 nm. For giant algal cell walls, the modulus has been found to be 407–662 MPa for Chara corallina (Toole et al., 2001) and up to 4 GPa for Nitella opaca (Probine and Preston, 1962). Other than these relatively direct determinations, many investigators have also studied the mechanical properties of plant cell wall components or wall analogues. The modulus of individual cellulose microfibrils has been both measured and calculated (Marhöfer et al., 1996; Ishikawa et al., 1997) giving a modulus range of 0·7–3·5 GPa. These calculated values are close to those obtained from measurements made on cellulosic networks under uni‐axial tensile conditions, e.g. moduli of 2·7 GPa for softwood fibres at a relative humidity of 50 % (Hamad, 1998) or 1–3 GPa for a cast network of sugar beet cellulose microfibrils (Dufresne et al., 1997). By deforming cell wall analogues based on Acetobacter xylinus cellulose under equi‐biaxial tension, moduli ranging from 200 MPa to 500 MPa have been obtained for a cellulose‐only system (Chanliaud et al., 2002). Overall, it appears that Young’s modulus estimated by the present method gives values that are reasonable compared with prior estimations on related materials.
It should be noted that the value of Young’s modulus from model fitting depends critically on the chosen value of the initial cell wall thickness, as also reported by Hiller et al. (1996) for modelling of micro‐penetration tests on potato tuber parenchyma tissue cells. Indeed, the modulus is inversely proportional to wall thickness for given force‐deformation data. Freeze fracture scanning electron microscopy was used to measure the wall thickness used in this study (Blewett, 2000), which should give a reliable value. However, it should be noted that not all of the cell wall is necessarily load‐bearing. It may therefore be wisest to treat Eh0 as one parameter combining modulus and wall thickness. This should be invariant for any set of data. Furthermore, it was necessary to use a mean value of the thickness, as measurements of thickness for specific cells are not possible during the compression experiment. Some possible effects of variations around the mean are shown in Table 4.
Table 4.
Influence of choice of cell wall thickness on Young’s modulus determined by modelling
| Chosen wall thickness (nm) | Estimated Young’s modulus (GPa) |
| 100 | 2.9 |
| 126 | 2.3 |
| 150 | 1.9 |
| 200 | 1.4 |
Base case of mean Young’s modulus of 2.3 GPa with a wall thickness of 126 nm.
Using the pressure probe, measurements have been made of the instantaneous bulk modulus of elasticity, ϵ, of single suspension tomato cells (Tomos and Leigh, 1999; Hukin, 2002). ϵi is defined by:

As the name and definition imply, ϵi is not an intrinsic material property of a cell as it depends on bulk parameters such as cell size. Nevertheless, it is possible to use the Young’s modulus found in the present work to estimate ϵi for the cells under test. Assuming linear elastic behaviour during pressure probe measurements, ϵi was estimated to be about 7 MPa. This value agrees very well with direct pressure probe measurements (5·9–7·1 MPa; Hukin, 2002). This is further validation of the present approach and the value of Young’s modulus determined here.
This method for determining Young’s modulus of single undifferentiated plant cells has great potential for further studies, specifically in investigating how the elasticity of primary plant cell walls depends on their composition and structure, and environmental conditions. Table 5 shows some preliminary data obtained using the method, which show how Young’s modulus varies with pH. Although these data need proper interpretation, it is interesting to note that the optimum pH for expansin activity is between 3·5 and 4·5 (McQueen‐Mason et al., 1992), while at pH 4·5 Young’s modulus is lowest, i.e. the cell wall is least stiff.
Table 5.
Preliminary data showing the influence of pH on Young’s modulus determined by modelling lower deformation compression data
| pH | Young’s modulus (GPa) |
| 3.5 | 3.4 ± 0.3 |
| 4.5 | 1.9 ± 0.1 |
| 5.0 | 2.3 ± 0.2 |
| 6.0 | 2.33 ± 0.1 |
It is sometimes suggested that plant cell walls might be viscoelastic (Preston, 1974), although it is difficult to separate water flows and true viscoelasticity for tissue samples. Such time‐dependent behaviour was not considered here. The compression experiment is relatively fast, and creep and enzyme responses act on longer time‐scales (Haughton et al., 1968; Cosgrove, 2000b). By using additional techniques such as image analysis of cell shape, and different compression speeds, it may eventually be possible to use the compression experiment to investigate any true time‐dependent behaviour, as well as measuring cell hydraulic conductivity directly.
CONCLUSIONS
Compressing cells by micromanipulation to obtain force‐deformation data has been used widely to investigate the mechanical properties of cells, including single plant cells from suspension cultures (Blewett et al., 2000). Normally it can only provide the bursting force and percentage deformation at bursting to characterize the mechanical properties of the cells. The intrinsic material properties of cell walls cannot be obtained directly from these compression experiments. In this study, it was shown that a linear elastic model could be used to determine the Young’s modulus of single cultured tomato cell walls from micromanipulation data. It was surprising how well this simple model fitted the data. Because of the speed of the compression, it appears water loss due to cell permeability was not significant. Although the Poisson’s ratio could not be determined, it seemed that Young’s modulus did not depend greatly on its value, and a reasonable value of the modulus was found.
Combining the compression experiment with mathematical modelling is a powerful method for investigating plant cell wall mechanics. It should be useful in determining how the elasticity and the strength of plant cell walls depend on their composition and structure, and how these change under different environmental conditions.
ACKNOWLEDGMENTS
The authors would like to thank the EPSRC of the UK for financial support for this work.
APPENDIX
Theoretical analysis of cell compression
For a linear elastic material, Cheng (1987) gives an expression for the generalized Hooke’s law strain energy function (W). This is important as it can be used to identify the tensions in a cell wall, if this can be assumed to show linear elastic behaviour. In the case of a (mechanical) membrane, a simplified expression for W is given by eqn A1, where bending and shear effects can be neglected. At any given compression,

where W is the strain energy per unit volume caused by deformation; λ1 and λ2 are the principal stretch ratios, each defined (in a given direction) as the ratio of the length of a small section of membrane after deformation, to its original length in the uninflated state. Subscripts 1 and 2 refer to the meridian and circumferential direction, respectively (see Table 1). E is the Young’s Modulus; ν is the Poisson’s ratio; and h0 is the initial wall thickness before inflation.
It can be seen that the strain energy not only depends on the stretch ratios but also on the parameters E, ν and h0. The tensions in the wall may be found from the strain energy function using eqn (A2), adapted from Skalak et al. (1973).

where Ti is the tension in the ith direction with a stretch ratio λi.
The tension–stretch relationships are therefore found by combining eqns (A1) and (A2).


Lardner and Pujara (1980) derived two groups of governing equations for two separate deformation regions: the contact region and the non‐contact region. The contact region is where the cell wall touches the compression surfaces (see Fig. 3C). The details of the derivation of these equations are given elsewhere (Feng and Yang, 1973; Lardner and Pujara, 1980). Only the final equations are presented here. The independent variable in these equations is ψ, which relates the position of any point on the boundary of the cell back to the original position of that point in the inflated but uncompressed cell. ψ is the angular position of the point measured from the vertical axis of symmetry.
Contact region:


where f1, f2 and f3 depend on the tensions and are defined later.
Non‐contact region:

where

and

For the linear elastic case, f1, f2 and f3 are found to be:


There is a relationship between the (turgor) pressure P in the cell and ω given by:

Equation (A13) allows the deformation to be linked to the force on the cell through the pressure P.
One boundary condition for this problem is

Other boundary conditions refer to the edge of the contact region, where it meets the non‐contact region. For the points on the edge, ψ = Γ by definition. See Fig. 3C in the main text. For these points:


where η is the coordinate perpendicular to the equatorial plane, and η is the distance between the rigid plate and the equator of the spherical membrane after deformation. Note that the distance moved by the probe is 2z, where z is related to η by eqn (A18).

Finally, on the equatorial plane

because of the symmetry.
When all the boundary conditions have been satisfied, the model equations give corresponding values for P and η for given E, ν, h0 and λs. The force (F) and the deformation (X) can be obtained from P and η using the following equations:

where P is the (turgor) pressure inside the compressed cell at deformation X, and Ac is the contact area between the cell and the probe surface. This equals to πrc2 (where rc = r0λ2 sinΓ).

Using chosen values of E, ν, h0 and λs, corresponding values of F and X can be found and compared with experimental data. If some of these parameters are pre‐determined, fitting of the model to the experimental data can be used to derive the others. This is described more fully below.
Numerical simulation
Since the original boundary‐value problem has been transformed into an initial value problem, the governing equations (eqns A5 to A7 and A13), with their boundary conditions can be solved by the Runge–Kutta method, here using the Matlab (MathWorks Inc.) ode45 solver.
As the constitutive relationship of the wall material is time‐independent, the compression of the cell was solved as a series of static equilibrium problems following the calculation procedure of Liu et al. (1996). In each step, the model simulates the displacement of the probe corresponding to the time between steps. The probe displacement deforms the cell from its previous shape. During the time taken for the step, there may be water loss, depending on the wall permeability. At the end of the step, the volume (V) of the deformed sphere is determined from the boundary coordinates of the cell (ρ and η; see Fig. 3C).

For any boundary point, η can be found from eqn. (A23):

while

In the method of Liu et al. (1996), the pressure P in eqn (A13) is adjusted at each step until the new volume V equals to the previous volume minus any water loss. When this is achieved, the force for a given simulated deformation is known (eqns A20 and A21).
Received: 25 September 2003; Returned for revision: 4 December 2003; Accepted: 19 December 2003
References
- BlewettJ.2000.Micromanipulation of plant cell mechanical properties. PhD Thesis, University of Birmingham, UK. [Google Scholar]
- BlewettJ, Burrows K, Thomas C.2000. A micromanipulation method to measure the mechanical properties of single tomato suspension cells. Biotechnology Letters 22: 1877–1883. [Google Scholar]
- ChanliaudE, Burrows KM, Jeronimidis G, Gidley MJ.2002. Mechanical properties of primary plant cell wall analogues. Planta 215: 989–996. [DOI] [PubMed] [Google Scholar]
- ChengLY.1987. Deformation analyses in cell and development biology. Part I. Formal methodology. Transactions of the American Society of Mechanical Engineers: Journal of Biomedical Engineering 109: 10–17. [DOI] [PubMed] [Google Scholar]
- CosgroveDJ.2000a. Expansive growth of plant cell walls. Plant Physiology and Biochemistry 38: 109–124. [DOI] [PubMed] [Google Scholar]
- CosgroveDJ.2000b. Loosening of plant cell walls by expansins. Nature 407: 321–326. [DOI] [PubMed] [Google Scholar]
- DaviesGC, Hiller S, Bruce DM.1998. A membrane model for elastic deflection of individual plant cell walls. Journal of Texture Studies 29: 645–667. [Google Scholar]
- DufresneA, Cavaill JY, Vignon MR.1997. Mechanical behavior of sheets prepared from sugar beet cellulose microfibrils. Journal of Applied Polymer Science 64: 1185–1194. [Google Scholar]
- FengWW, Yang WH.1973. On the contact problem of an inflated spherical nonlinear membrane. Transactions of the American Society of Mechanical Engineers: Journal of Applied Mechanics 40: 209–214. [Google Scholar]
- FrySC.1995. Polysaccharide‐modifying enzymes in the plant cell wall. Annual Review of Plant Physiology and Plant Molecular Biology 46: 497–520. [Google Scholar]
- HamadWY.1998. On the mechanisms of cumulative damage and fracture in native cellulose fibres. Journal of Materials Science Letters 17: 433–436. [Google Scholar]
- HaughtonPM, Sellen DB, Preston RD.1968. Dynamic properties of Nitella cell walls. Journal of Experimental Botany 19: 1–12. [Google Scholar]
- HillerS, Bruce DM, Jeronimidis G.1996. A micro‐penetration technique for mechanical testing of plant cell walls. Journal of Texture Studies 27: 559–587. [Google Scholar]
- HukinD.2002.Water relations and biophysics of plant cells. PhD Thesis, University of Birmingham, UK. [Google Scholar]
- HukinD, Doering‐Saad C, Thomas CR, Pritchard J.2002. Sensitivity of cell hydraulic conductivity to mercury is coincident with symplasmic isolation and expression of plasmalemma aquaporin genes in growing maize roots. Planta 215: 1047–1056. [DOI] [PubMed] [Google Scholar]
- IshikawaA, Okano T, Suguyama J.1997. Fine structure and tensile properties of ramie fibres in the crystalline form of cellulose I, II, IIII and IVI Polymer 38: 463–468. [Google Scholar]
- KamiyaN, Tazawa M, Takata T.1963. The relation of turgor pressure to cell volume in Nitella with special reference to the mechanical properties of the wall. Protoplasma 57: 501–521. [Google Scholar]
- KawamuraY, Hoson T, Kamisaka S, Yamamoto R.1995. Formulation of pre‐extension in a practical stress‐relaxation measurement of the plant cell wall. Biorheology 32: 611–620. [Google Scholar]
- KedemO, Katchalsky A.1958. Thermodynamic analysis of the perme ability of biological membranes to non‐electrolytes. Biochimica et Biophysica Acta 27: 229–246. [DOI] [PubMed] [Google Scholar]
- LardnerTJ, Pujara P.1980. Compression of spherical cells. Mechanics Today 5: 161–176. [Google Scholar]
- LiuKK.1995.The deformation of cellular entities. PhD Thesis, University of London, UK. [Google Scholar]
- LiuKK, Williams DR, Briscoe BJ.1996. Compressive deformation of a single microcapsule. Physical Review E 54: 6673–6680. [DOI] [PubMed] [Google Scholar]
- McQueen‐MasonS, Durachko DM, Cosgrove DJ.1992. Two endogenous proteins that induce cell wall extension in plants. Plant Cell 4: 1425–1433. [DOI] [PMC free article] [PubMed] [Google Scholar]
- MaggioA, Joly RJ.1995. Effects of mercuric chloride on the hydraulic conductivity of tomato root systems. Plant Physiology 109: 331–335. [DOI] [PMC free article] [PubMed] [Google Scholar]
- MarhöferRJ, Reiling S, Brickmann J.1996. Computer simulations of crystal structures and Young’s properties of cellulose. Berichte der Bunsengesellschaft‐Physical Chemistry Chemical Physics 100: 1350–1354. [Google Scholar]
- MashmoushyH, Zhang Z, Thomas CR.1998. Micromanipulation measurement of the mechanical properties of baker’s yeast cells. Biotechnology Techniques 12: 925–929. [Google Scholar]
- MaurelC.1997. Aquaporins and water permeability of plant membranes. Annual Review of Plant Physiology and Plant Molecular Biology 48: 399–429. [DOI] [PubMed] [Google Scholar]
- PrestonRD.1974.The physical biology of plant cell walls. London: Chapman and Hall. [Google Scholar]
- ProbineMC, Preston RD.1962. Cell growth and the structure and mechanical properties of the wall in internodal cells of Nitella opaca II. Mechanical properties of the walls. Journal of Experimental Botany 13: 111–127. [Google Scholar]
- RichmondPS, Metraux JP, Taiz L.1980. Cell expansion patterns and directionality of wall mechanical properties in Nitella Plant Physiology 65: 211–217. [DOI] [PMC free article] [PubMed] [Google Scholar]
- SkalakR, Tozeren A, Zarda RP, Chien S.1973. Strain energy function of red blood cell membranes. Biophysical Journal 13: 245–263. [DOI] [PMC free article] [PubMed] [Google Scholar]
- SmithAE, Moxham KE, Middelberg APJ.1998. On uniquely determining cell – wall material properties with the compression experiment. Chemical Engineering Science 53: 3913–3922. [Google Scholar]
- SmithAE, Moxham KE, Middelberg APJ.2000. Wall material properties of yeast cells. Part II. Analysis. Chemical Engineering Science 55: 2043–2053. [Google Scholar]
- ThomasCR, Zhang Z, Cowen C.2000. Micromanipulation measurements on biological materials. Biotechnology Letters 22: 531–537. [Google Scholar]
- TomosAD, Hinde P, Richardson P, Pritchard J, Fricke W.1994. Microsampling and measurements of solutes in single cells. In: Harris and Oparka KJ, eds. Plant Cell Biology. A Practical Approach, Oxford: IRL Press, 297–314. [Google Scholar]
- TomosAD, Leigh RA.1999. The pressure probe: a versatile tool in plant cell physiology. Annual Review of Plant Physiology and Plant Molecular Biology 50: 447–472. [DOI] [PubMed] [Google Scholar]
- TomosD.2000. The plant cell pressure probe. Biotechnology Letters 22: 437–442. [Google Scholar]
- TooleGA, Gunning PA, Parker ML, Smith AC, Waldron KW.2001. Fracture mechanics of the cell wall of Chara corallina Planta 212: 606–611. [DOI] [PubMed] [Google Scholar]
- YonedaM.1973. Tension at the surface of sea‐urchin eggs on the basis of ‘liquid‐drop’ concept. Advances in Biophysics 4: 153–190. [PubMed] [Google Scholar]
- ZhangZ, Ferenczi MA, Lush AC, Thomas CR.1991. A novel micromanipulation technique for measuring the bursting strength of single mammalian cells. Applied Microbiology and Biotechnology 36: 208–210. [DOI] [PubMed] [Google Scholar]


