Abstract
A previously developed dynamic lettuce model, designed to predict growth and nitrate content under the normal range of glasshouse environmental conditions, has been extended to cover high nitrogen‐stress situations. Under severe shortage of nitrogen, lettuce has been observed to grow at a very slow rate, as well as to have abnormally low water content, low reduced‐nitrogen content and negligible nitrate content. The new model mimics these observations by adding to the original model a storage compartment for ‘excess’ carbon. The resulting model has three compartments: (1) ‘vacuole’, where the soluble non‐structural material is stored, and the nitrate : carbon ratio may vary as needed to maintain a constant osmotic potential; (2) ‘structure’, a metabolically active compartment with fixed chemical composition; and (3) ‘excess‐carbon’, which serves as a long‐term storage of ‘waterless’ carbohydrates. Simulations with the model illustrate its ability to predict the effect of light, temperature and nitrogen in the nutrient solution on the long‐term growth and composition of lettuce. They also illustrate the effects of plant size, and the associated relative growth rate, on the characteristic times of transient responses resulting from step changes in the environment.
Key words: Lactuca sativa L., glasshouse, N‐stress, dynamic response, Nicolet
INTRODUCTION
The history of mathematical modelling of lettuce goes back at least 20 years (Sweeney et al., 1981). Since then, other lettuce models (e.g. Seginer et al., 1991; van Henten, 1994) have been developed to predict growth rate and to assist in controlling the crop environment, such as in glasshouses. These models have all assumed that water and nutrients are abundantly available, and do not consider the non‐carbon constituents of the crop.
Many plants, including lettuce, tend to accumulate nitrate in their vegetative tissue, particularly when carbon source : sink activity ratio is low (e.g. in low light). Since excessive nitrate in leafy vegetables is considered a health hazard (Maynard et al., 1976; Walters and Walker, 1979), the European Community imposed an upper limit on nitrate concentration [3500 and 4500 mg (NO3) kg–1 (FM), for summer and winter lettuce, respectively; European Commission, 1999]. Therefore, a model to predict nitrate content at harvest time could be a useful decision support tool for the lettuce industry.
Nitrate is taken up by plants for two main uses: (1) as an essential raw material, mainly for the synthesis of proteins; and (2) as an important anion osmoticum (Mott and Steward, 1972; MacRobbie, 1976; Clement et al., 1979). Cell osmotic potential is maintained by a combined contribution from shoot‐produced organic compounds and root‐supplied inorganic compounds, of which nitrate is an important constituent (Behr and Wiebe, 1988). The concentration of organic compounds (mainly sugars and organic acids) in the vacuolar substrate pool (cell sap) is the result of a balance between carbon source flux due to photosynthesis, and carbon sink flux due to structural growth and maintenance (e.g. Sweeney et al., 1981; Gary, 1988; van Henten, 1994). The rate of production of assimilates by photosynthesis has a wide temperature plateau (20–40 °C for soybean, Boote et al., 1998; flat parabolic response, Jones and Luyten, 1998, Fig. 7) and is mainly determined by light flux and carbon dioxide concentration. On the other hand, the rates of growth and of respiration increase significantly with temperature (Gent and Enoch, 1983; Criddle et al., 1997). As a result, the concentration of soluble carbon compounds decreases when growth is source‐limited (low light), and increases when it is sink‐limited.
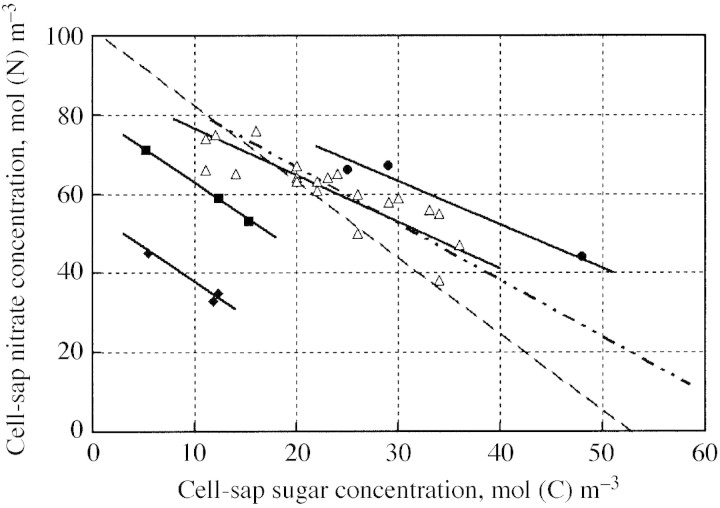
Maintenance of a steady long‐term osmotic potential requires that changes in concentration of the organic solutes be compensated for by opposite changes in the inorganic solutes. Alberda (1965) described the effects of temperature and light level in producing a negative correlation between concentrations of total soluble carbohydrates and nitrate, and Veen and Kleinendorst (1985) presented evidence in support of the compensatory roles of soluble carbohydrates and nitrate in the regulation of osmotic potential. In studies with lettuce (Blom‐Zandstra and Lampe, 1985; Behr and Wiebe, 1988; Blom‐Zandstra et al., 1988; Drews et al., 1995), clear negative correlations have been obtained between sugar and nitrate in the cell sap. Figure 1 shows that the negative slopes are similar and that different sets of data are shifted relative to each other owing to genotype differences (Blom‐Zandstra et al., 1988) and, possibly, as a result of differences in osmotic potential and/or other reasons.
Fig. 1. Negative relationships between cell‐sap sugar and nitrate concentrations in lettuce. Data from Blom‐Zandstra and Lampe, 1985 (open triangles); Blom‐Zandstra et al., 1988 (closed squares and diamonds; two genotypes); Behr and Wiebe, 1992 (closed circles); ——, best fits for former data; – · · –, Drews et al., 1995 (individual points not shown); – – – , Behr and Wiebe, 1988 (determination of this line is explained in the Appendix).
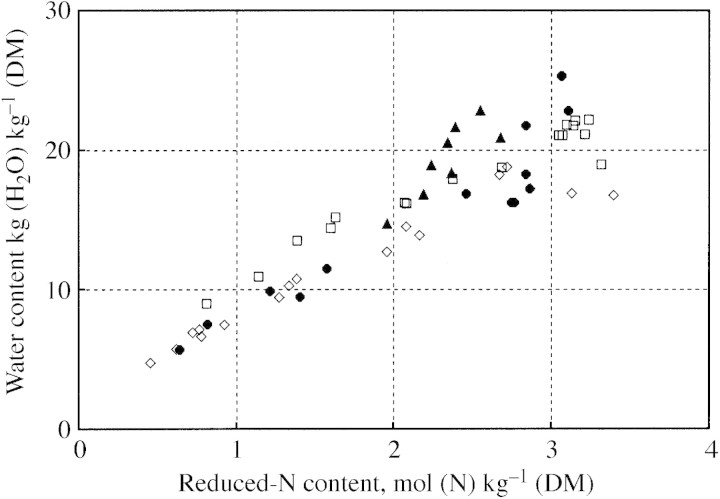
Based on the preceding description, the ‘Nicolet’ (NItrate COntrol in LETtuce) simulation model has been developed to predict growth and nitrate content of lettuce (Seginer et al., 1998, 1999). Although the model can be used to calculate continuous variations, the Nicolet project focused on the medium‐ to long‐term variations, hence allowing certain simplifying assumptions, such as a constant osmotic potential. The Nicolet model has been shown (Seginer et al., 1998) to predict sufficiently well the seasonal variation of nitrate content of glasshouse lettuce (Drews et al., 1995) grown under ordinary agricultural conditions, where crops are not severely stressed. In many experiments, however, nutrient stresses are purposely imposed, resulting in a reduced growth rate, as well as in reduced nitrogen and water contents. This has been observed in young plants in general (e.g. Oscarson et al., 1989), and in lettuce in particular (Burns, 1992; Buwalda and Warmenhoven, 1999; Broadley et al., 2000). Under prolonged constant N‐stress conditions, the relative growth rate (RGR) becomes essentially equal to the relative N‐addition rate (RNR) (Oscarson et al., 1989; Ingestad and Ågren, 1992), while the N : C ratio of the plants becomes approximately proportional to the RNR. Moreover, the water content decreases with increasing stress in proportion to the N : C ratio (Fig. 2). The dry matter content (DMC) of N‐stressed lettuce may triple relative to its normal range of 4–5 %.
Fig. 2. Relationship between reduced‐N content and water content of lettuce, resulting from changes in nitrogen stress. Normal plants are represented by the right‐top data points (DMC = 4–5 %). Data provided by: F. Buwalda (Aalsmeer, The Netherlands) (open diamonds and squares); Burns, 1992 (closed circles); De Pinheiro Henriques and Marcelis, 2000 (closed triangles).
It is possible to distinguish two stages in the development of N‐stress over the course of a typical interruption experiment with lettuce (Burns, 1992). During the first stage, while the stress is ‘mild’, nitrate is quickly depleted, but reduced‐N (organic‐N) and water content decrease only slightly. The nitrate removed during this stage may perhaps be associated with ‘luxury consumption’ of nitrogen (Justes et al., 1994; Grindlay, 1997) in a previous period. As soon as the nitrate is effectively depleted, the ‘severe’ stress stage sets in, and the reduced‐N : dry‐mass ratio, as well as the water content, decrease sharply. Figure 3 shows clearly the two stages. Initially, the nitrate concentration is high and the DMC is ‘normal’. As nitrate is depleted, the dry matter content increases by about 1 %, most of which can be attributed to the replacement of inorganic ions with soluble organic compounds in the osmotica pool. Note, however, that the change in Fig. 3 is considerably smaller than that reported, also for lettuce, by Cárdenas‐Navarro et al. (1999, Fig. 7). In the ‘severe’ N‐stress region, DMC increases to more than three times the normal value, which can be seen in Fig. 2 to be accompanied by a decrease in reduced‐N content.
Fig. 3. Two stages of N‐stress in the course of an N‐interruption experiment with lettuce. Sequence of data points is from top to right bottom. In the ‘severe’ stress stage, reduced‐N continues to decrease, as seen in Fig. 2. Data provided by F. Buwalda (Aalsmeer, The Netherlands).
The present paper describes a modification of the original Nicolet model, designed to predict the observed reduction in RGR, N : C ratio and water content under severe nitrogen‐stress conditions. Like the original model, it describes a single‐organ crop and is based on carbon, nitrogen and osmotica balances. The original two compartments of the model are supplemented by a third one, and some other changes are also introduced.
The next section describes the model and attempts to justify the choices made in formulating it. The guiding line was parsimony, namely keeping the number of influencing factors and parameters to the minimum. The description of the model is followed by simulations that show that the model produces sound long‐term and transient results. Fitting the model to specific experimental data is beyond the scope of this paper and is addressed elsewhere (R. Linker and I. Seginer, unpubl. res.).
MODEL
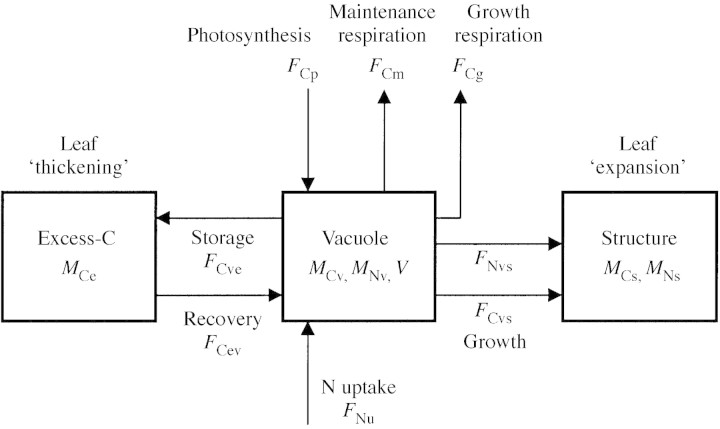
The modified model is described schematically in Fig. 4 as composed of three compartments (rectangles). The original two compartments, labelled ‘structure’ and ‘vacuole’, are similar to the ‘structural’ and ‘non‐structural’ compartments in many other crop models. The carbon in these compartments is assumed, in the Nicolet model, to be well correlated (positively or negatively) with nitrogen and water. The additional ‘excess‐carbon’ (excess‐C) compartment holds any ‘excess’ carbon that has no matching nitrogen and water. Excess carbon compounds are assumed not to contribute to osmotic potential.
Fig. 4. A schematic description of the model. The three compartments and the carbon and nitrogen fluxes are shown. Symbols are explained in the text.
The excess‐C compartment is modelled with the following simplified view of the leaf in mind: when N is freely available, leaves are of a ‘basic’ mass‐thickness and water content, as necessary for mechanical strength and to support the various metabolic processes, such as photosynthesis. When growth is N‐limited, ‘excess’ carbohydrates are stored by thickening (not expanding) existing leaves. In reality, they may also be stored in stems and other organs. Since the storage compounds are associated with little or no water, both N : dry‐matter and water : dry‐matter ratios decrease when plants are short of nitrogen. Leaf thickening by ‘excess’ carbon can also result from a high carbon source : sink ratio.
Support for this view of leaf thickening can be found in Grindlay (1997), who states that there is little change in nitrogen per unit leaf area in response to availability of nitrogen, although nitrogen‐starved plants have a considerably smaller N content on a dry mass basis. Alt et al. (2000; cauliflower) and de Pinheiro Henriques and Marcelis (2000; lettuce) show that leaves exposed to high light levels are thicker (in terms of mass) than partially shaded leaves, apparently as a result of a higher carbon source : sink ratio. In tomato, the excess carbon, much of it in the form of starch, is thought to be responsible for the Short Leaves Syndrome (SLS; Nederhoff et al., 1992; de Groot et al., 2001). No significant amounts of starch have been found in lettuce, however, even when N‐stressed.
Balance equations
In accord with Fig. 4, the carbon balances of the model are:
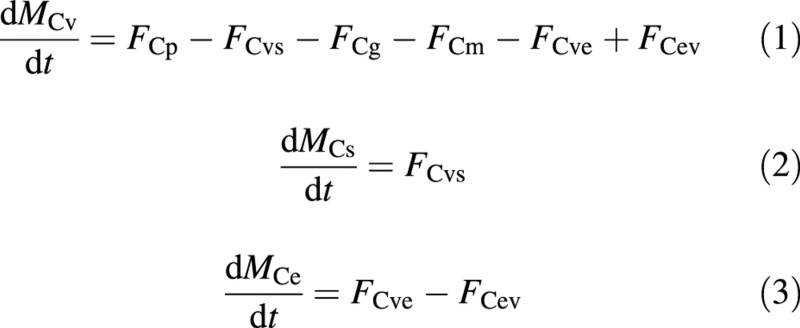
where MC is the molar mass of carbon (subscript C) per unit ground area, the subscripts v, s and e refer to the vacuole, structure and excess‐C compartments, respectively, and FC is the molar flux of carbon (all terms are defined in the Appendix). Fluxes with double compartment subscripts are between compartments (from the first to the second subscript), and the other fluxes, namely FCp, FCg and FCm are the photosynthesis, growth respiration and maintenance respiration fluxes (all between the ‘vacuole’ and the environment). These masses and fluxes are expected to be non‐negative. In particular, the solution should not allow a negative MCe.
The nitrogen balances are:
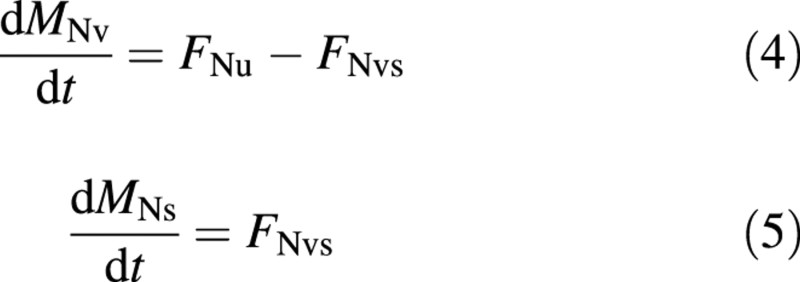
where the subscripts N and u denote nitrogen and uptake from the nutrient solution. ‘Vacuolar’ nitrogen is assumed to be nitrate and ‘structural’ nitrogen is assumed to be reduced‐N.
Compositional relationships
Two constant compositional ratios are assumed, namely N : C in the structure, and water : structural‐carbon.

where V is the volume of crop water per unit ground area, and r and λ denote the two proportionality coefficients. Both ratios are direct consequences of the ‘basic’ leaf concept, and together they imply a constant reduced‐N : water ratio. The latter is in agreement with the view of Leigh and Johnston (1985, 1987), who suggest that ‘tissues must have a certain nitrogen concentration [in water]’, as well as with that of Thornton et al. (1990) and with Fig. 2.
Constant proportions are also assumed regarding two of the fluxes. First, in view of eqns (2) and (5), eqn (6) implies that

Secondly, growth respiration is assumed to be a constant fraction of growth, namely

A central element of the Nicolet model is the osmotica balance:

where βC and βN are the osmotic contributions of one unit of vacuolar C or N, and Π is the total osmotic potential of the cell sap, assumed here to be constant. The latter assumption is based on the narrow range of measured values for lettuce, around 240 osmol m–3 (Blom‐Zandstra and Lampe, 1985; Behr and Wiebe, 1988; Blom‐Zandstra et al., 1988), and on the medium‐ to long‐term focus of the project, namely ignoring details of the diurnal variation. Equation (10), which is equivalent to a straight line in Fig. 1, ensures that the combined osmotic contribution of the vacuolar soluble carbon compounds, MCv, and of the vacuolar nitrate, MNv, together with other compounds that are well correlated with them (see the Appendix, ‘Negative nitrate–sugar correlation’), is constant.
Differentiating the osmotica balance, eqn (10), with respect to time, and substituting from eqns (1), (2), (4), (8) and (9), results in the flux form

where

is a collection of parameters. It is assumed that the four fluxes on the right‐hand side of eqn (11) depend only on the shoot environment and on the state of the crop, while the two fluxes on the left‐hand side may also be affected by the availability of nutrients in the nutrient solution, and hence may have to be formulated differently for different nutritional situations (abundant or limiting). Given one of the latter two fluxes, the other one can be determined from the equation. Which flux is unknown depends on the nutritional situation (to be considered below).
The overall model description is now complete. It involves six constituents, namely MCs, MCv, MCe, MNs, MNv and V, constrained by three inter‐relationships, eqns (6), (7) and (10). Hence, only three (six minus three) of the five differential equations, eqns (1) to (5), are required for a complete description of the model dynamics. In this study, eqns (1)–(3) were chosen to serve as the state equations, so that the three carbon masses MCs, MCv and MCe are the three state variables of the model.
Nutritional situations
When nutrients are abundant, the plant takes up as much of them as is required to match the potential carbon growth, denoted by FCvs,A, where the subscript A indicates abundant. In such a case the osmotica balance [eqn (11)] becomes:

If the supply of nutrients (here nitrogen) is limiting, and the available flux is FNu,L (‘L’ for limiting), growth must adjust to the limited nitrogen supply:

At any point in simulation time it is possible to decide which one of eqns (13) and (14) is valid, by replacing the actual fluxes FCvs and FNu on the left‐hand side of eqn (11) by the ‘abundant’ and ‘limiting’ fluxes, FCvs,A and FNu,L. If the resulting left‐hand side is larger than the right‐hand side, namely if

then the instantaneous growth is N‐limited [eqn (14)] and the crop is N‐stressed (the demand for nitrogen is larger than its supply). If the opposite is true, growth is not N‐limited [eqn (13)].
Carbon fluxes
The various fluxes need now to be expressed in terms of the state of the crop and its environment. For this purpose it is convenient to define normalized concentrations, Γ, for the vacuolar material, namely

leading to a normalized‐concentration osmotica balance [originally eqn (10)]

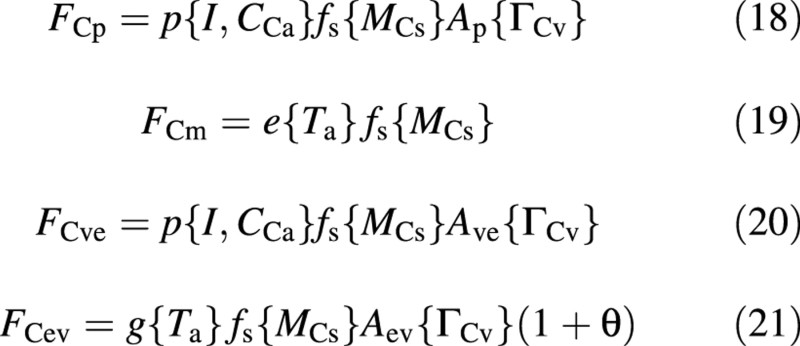
The carbon fluxes on the right‐hand side of eqn (11) are now formulated as:
and the structural growth (leaf expansion), when nutrients are abundant, is formulated as

All five fluxes are functions of the shoot environment: light (I), CO2 concentration (CCa) and air temperature (Ta), and of the state of the crop, via MCs and ΓCv.
Each of the carbon fluxes is written as a product of several factors. The first, indicating the potential flux, is a function of the environmental conditions, the second is a function of the size of the crop and the third is an attenuation factor, which is a function of some process inhibition, which in turn depends on the vacuolar composition, via ΓCv. The factor (1 + θ) in FCev is intended to recover material for both growth and growth respiration.
The first factor, namely the potential fluxes of gross photosynthesis, maintenance respiration and growth are formulated, respectively, as:

and

where ϵ, σ, k, c and ν are constant coefficients (parameters of the model) and T* is an arbitrary reference temperature.
The gross photosynthesis rate (corrected for photorespiration), eqn (23), is modelled as a simplified two‐substrate (light and CO2) Michaelis–Menten equation (Thornley and Johnson, 1990, p. 225). The exponential dependence of respiration on temperature in eqn (24) (Criddle et al., 1997), not valid for high temperatures (above the optimum), is assumed to be the same for maintenance and growth, since the distinction between the two types of respiration is not so clear (Cannell and Thornley, 2000).
The second factor, the dependence on crop size, is the same for all five fluxes [eqns (18)–(22)], and has the form:

It approaches 1 asymptotically, and is commonly used in photosynthesis calculations to describe light interception in canopies (van Keulen et al., 1982; Thornley and Johnson, 1990, chapter 10). However, its presence in the growth and maintenance terms requires some justification. Following Seginer et al. (1994), the main reasons for its inclusion in the growth (and growth respiration) terms are: (1) sink strength (number of growth points) approaches a limit as the canopy closes; and (2) buffers, here in the ‘vacuole’, are only useful if, on average, the flows in and out of them maintain a certain balance. If growth was to be made proportional to, say, MCs, carbohydrate sink strength would grow indefinitely, while the photosynthetic activity (carbohydrate source) remained limited by light interception, f{MCs}. Applying the same asymptotic approach to maintenance respiration follows the suggestion of Barnes and Hole (1978) to make maintenance respiration proportional to the plant protein content, which is concentrated in the sunlit portions of the canopy (Grindlay et al., 1995; Alt et al., 2000). Furthermore, McCree (1983) found experimentally that respiration rate is proportional to the protein content of plants, rather than to their total biomass, and that ‘the maintenance requirement [coefficient] decreases with decreasing [relative] growth rate of the plant’ (McCree, 1982).
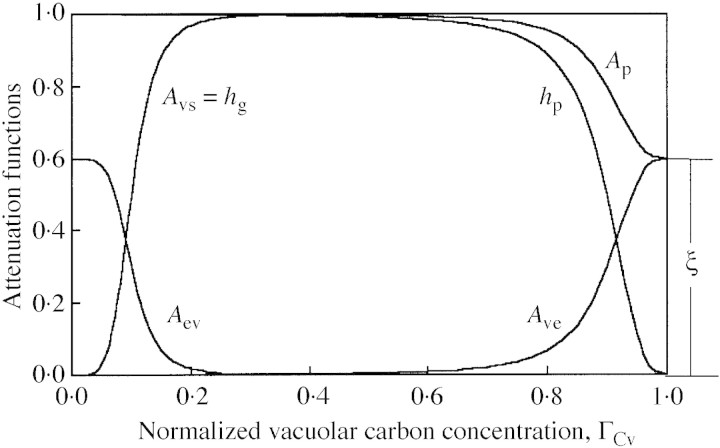
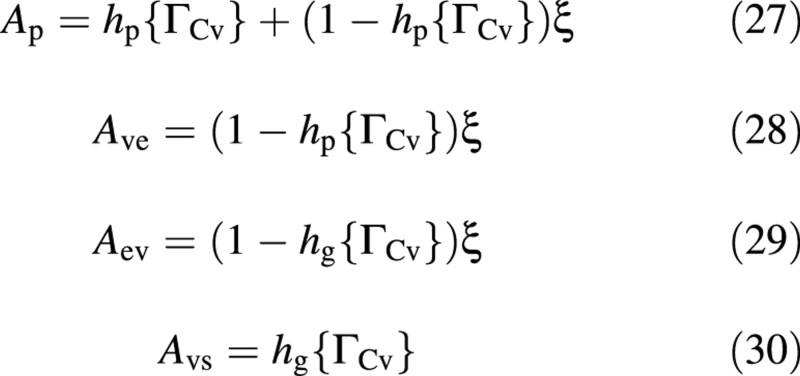
The third factor represents an attenuation, which is a function of carbon‐flow limitations, either into the vacuole, hp, or into the structure, hg. The attenuation functions are:
and the limitation functions hp and hg are:
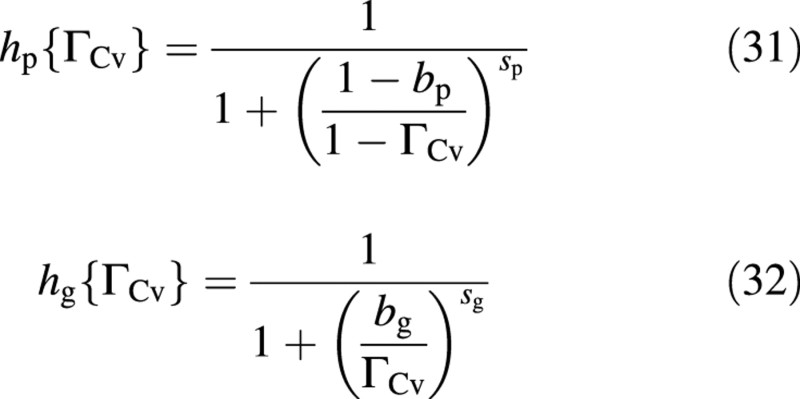
where 0 < ξ < 1, 0 < bp < 1, 0 < bg < 1, sp > 0 and sg > 0 (Fig. 5). The inflow limitation, hp, protects the vacuole from carbon over‐spilling and the outflow limitation, hg, protects it from carbon over‐draining. These flow limitations equal 0·5 where ΓCv = b, the slope at that point being determined by s. A very high value of s results in a step at ΓCv = b. The inflow limitation, hp, approaches zero as the ‘vacuole’ approaches saturation with carbon compounds (ΓCv → 1) and increases asymptotically to 1 (no limitation) when the vacuole becomes depleted of carbon (mathematically, when ΓCv → –∞). The behaviour of hg is qualitatively a mirror image of that of hp (Fig. 5).
Fig. 5. Typical forms of the attenuation functions. Parameter values for this illustration where chosen for clarity. Symbols are explained in the text.
A fraction ξ of the difference between the photosynthetic potential (= 1) and hp, namely Ave = ξ (1 – hp), is diverted to the excess‐C compartment [eqn (20)], and the rest is inhibited (not produced; Foyer, 1988; Thornley, 1997). This is illustrated in Fig. 5, where Ave = Ap – hp (namely 1 – Ap is not produced). Figure 5 also shows that flow in and out of the excess‐C compartment is restricted to extreme situations.
If ξ is zero, the fluxes associated with the excess‐C compartment (FCev and FCve) vanish, and the model reverts to its original form (Seginer et al., 1998; without excess‐C compartment). Hence the original model, which can only mimic lettuce under a mild nitrogen stress, is a special case of the new model.
Nitrogen uptake
The actual uptake of nitrogen, FNu, is formulated as the smaller of (1) the supply rate, controlled by the availability of N; and (2) the demand of the plant [eqns (14) and (13)]. The former is formulated, similarly to the carbon fluxes, as a product of a potential uptake rate and an effective crop size, namely

It is a function of the nitrate concentration and the temperature of the nutrient solution (CNn and Tn) as well as of the size of the crop (MCs). Note that making all fluxes proportional to the same function of crop size, f{MCs}, ensures a crop composition that is age‐ (size‐) invariant under constant environmental conditions. It also has the advantage of simplifying certain equation manipulations. However, this simplifying assumption is justified only for young (vegetative) crops.
The potential uptake rate is formulated as a single‐substrate (CNn) Michaelis–Menten process:

where ϕ and K are constant coefficients (Raman et al., 1995).
Parameters
The description of the model mechanics is now essentially complete. The model has 19 parameters in total, which may be grouped as follows: a is associated with the size of the crop; ϵ and σ are associated with photosynthesis; ϕ and K are associated with nitrogen uptake; θ, v, k and c are associated with respiration and growth; βC, βN, Π, λ and r are associated with the internal composition of the crop; and bp, sp, bg, sg and ξ are associated with the attenuation functions.
SIMULATIONS
Conversion between model states and experimental observations
Before illustrating the behaviour of the model with sample simulations, it is necessary to devise a conversion procedure between the states of the model and the experimental measurements. Experimental results are often reported (e.g. Figs 2 and 3) in terms of: (1) fresh mass per plant, WF; (2) dry mass per plant, WD; (3) molar nitrate content on a dry mass basis, Cnit‐N; and (4) molar total‐N content on a dry mass basis, Ctot‐N. The last two measurements can be used to calculate the molar reduced‐N content, via

These data can be used to estimate the state variables of the model as follows. The water content is first determined from

where P is the number of plants per unit ground area and ρ is the density of water. Combining this with eqn (7), the carbon content of the structure is obtained

From the definition of Cnit‐N,

and from the osmotica balance, eqn (10),

Assuming that all carbon compounds have a composition similar to carbohydrates, dry mass may be expressed as:

and hence

where ηJ is the conversion constant between Jand dry mass.
This completes the determination of the state vector [MCs, MCv, MCe] from the measured values, a procedure that does not require the measured total‐N. The reduced‐N content, Cred‐N, may be used to evaluate r from eqn (6), if so desired. The inverse conversion, from the simulated states to the measurable quantities, utilizes the same equations in reverse.
Sample simulations
Figure 6 shows the results of eight sample simulations with the model, utilizing the parameter set given in the Appendix (‘Parameter values’), which is based on fittings to experimental results. In particular, note that the attenuation parameters are not the same as in Fig. 5, where clarity required a lower value of bp. Utilizing eqns (35)–(41), the simulation results are expressed in terms of measurable quantities, for easy comparison with Figs 2 and 3 and other experimental results. Each column of frames in Fig. 6 represents one simulation (one case). In each column, the frames, from top to bottom, show values of WD, WF, WD/WF, Cnit‐N and Cred‐N; WD/WF being the dry matter content (DMC). All results are for a period of 60 d, from (virtual) transplanting, 20 d after (virtual) sowing (DAS), to (virtual) harvest at 80 DAS. A 12 h/12 h light/dark period is assumed. A summary of the environmental conditions for each of the eight cases is presented in Table .
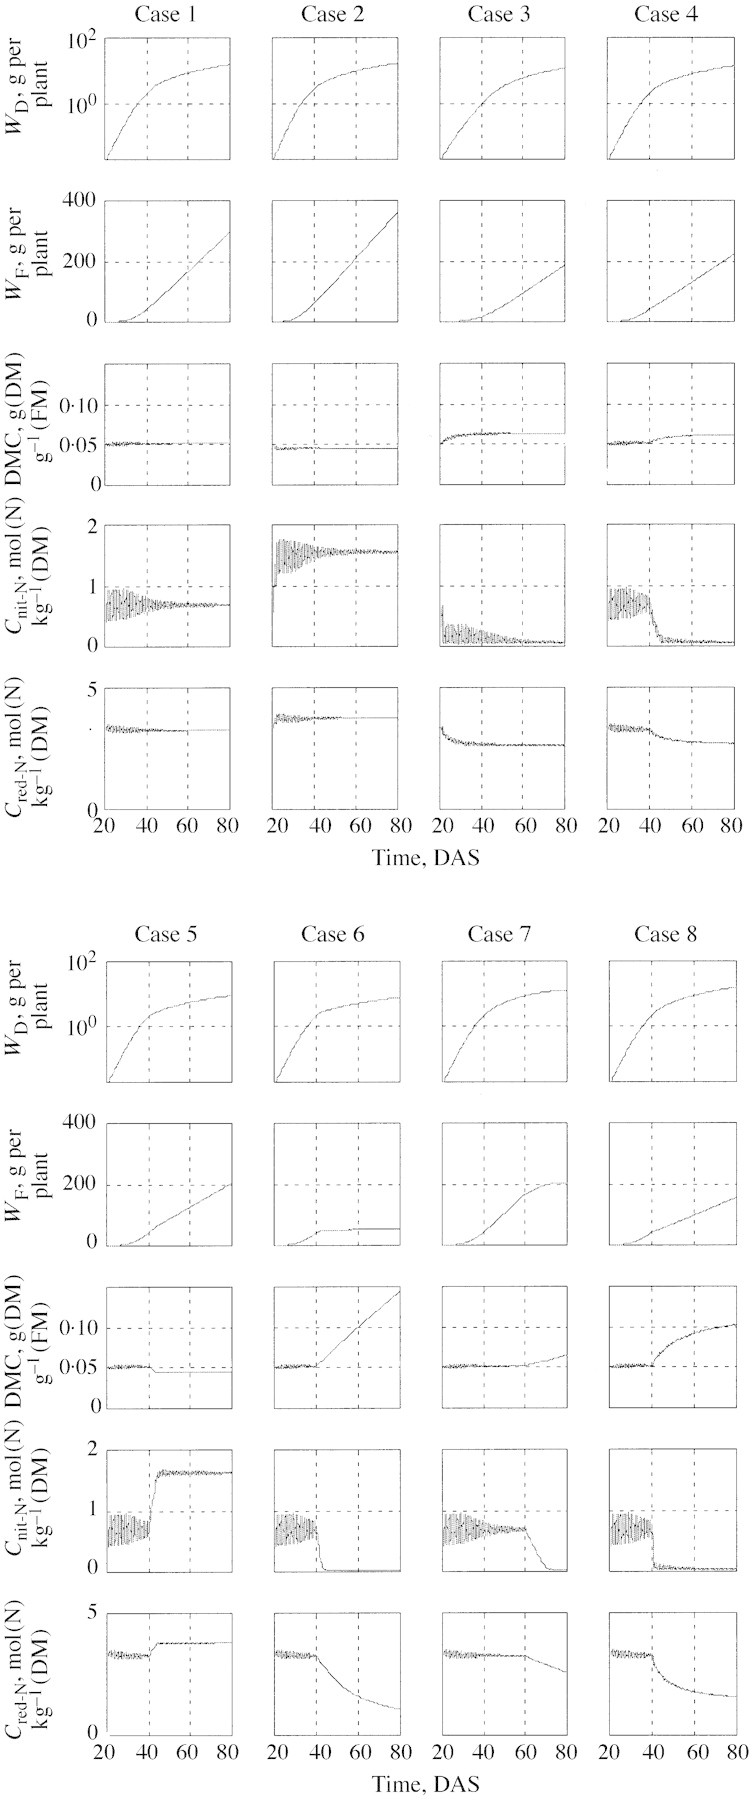
Fig. 6. Simulation results. Each column of frames represents one 60‐d simulation, from (virtual) transplanting to (virtual) harvest. The rows of frames, from top to bottom, show values of WD, WF, DMC, Cnit‐N and Cred‐N. The environment is either constant or a step function. Symbols are explained in the text and details of treatments are in Table 1.
Table 1.
Environmental conditions for the simulations reported in Fig. 6
| Case 1 (Reference) | Case 2 | Case 3 | Case 4 | Case 5 | Case 6 | Case 7 | Case 8 | |||||||||
| Period | I | II | I | II | I | II | I | II | I | II | I | II | I | II | I | II |
| Change time (DAS) | No change | No change | No change | 40 | 40 | 40 | 60 | 40 | ||||||||
| Light integral [mol (PAP) d–1] | 12 | 12 | 12 | 12 | 12 | 12 | 12 | 12 | 12 | 6 | 12 | 12 | 12 | 12 | 12 | 22 |
| Day temperature (°C) | 20 | 20 | 25 | 25 | 15 | 15 | 20 | 15 | 20 | 20 | 20 | 20 | 20 | 20 | 20 | 5 |
| Night temperature (°C) | 15 | 15 | 20 | 20 | 10 | 10 | 15 | 10 | 15 | 15 | 15 | 15 | 15 | 15 | 15 | 5 |
| Nitrate | A | A | A | A | A | A | A | A | A | A | A | 0 | A | 0 | A | A |
Periods I and II are before and after an environmental step change. Nitrate is either abundant (A) or absent (0) in the nutrient solution. Figures in bold indicate changes from case 1 (reference).
Case 1 is the reference for comparisons. It simulates a lettuce crop growing under constant environmental conditions with an abundant supply of nutrients. The environment is such that flux attenuation is minimal (within the plateau of Fig. 5), resulting in a mean nitrate concentration equivalent to ΓCv≌0·6 As seen from the traces of WD (logarithmic) and WF (linear), exponential growth continues for less than 20 d, while the growth over the last 40 d is essentially linear, indicating canopy closure at around 40 DAS. The composition of the crop (DMC, Cnit‐N and Cred‐N) is essentially constant on a daily time scale, with considerable intra‐day fluctuations only for Cnit‐N. The Cnit‐N fluctuation amplitude is a measure of the relative growth rate. Initially, while the crop grows exponentially, RGR is large (about 30 % d–1) and constant. As the canopy closes and the RGR decreases to a few per cent per day, the fluctuations become negligable.
Cases 2 and 3, still for constant environmental conditions, show the expected effect of raising or lowering the temperature, respectively, by 10 °C. Increasing the temperature increases the growth rate considerably (seen best in terms of fresh mass; case 2), mainly by reducing the residence time of carbohydrates in the vacuole. If carbohydrates are transferred quickly into the structure, they contribute to early leaf expansion and hence to added photosynthesis and further structural growth. The consequence of carbohydrate removal from the vacuole is a high nitrate concentration, as dictated by the osmotica balance [eqn (10)].
Case 3, for a reduced temperature, is essentially a mirror image of case 2. The effects are somewhat more pronounced (in the opposite direction) since the reference situation (case 1) is not symmetrical with respect to the range of ΓCv. The ranges of dry matter content and nitrate content between case 2 and case 3 match the range of ‘mild’ stress of Fig. 3, although the direct cause in the simulation is not a shortage of nitrogen. This should emphasize the point that structural growth reduction, for any reason, would result in a carbon‐saturated vacuole and a low nitrate concentration. The decrease of reduced‐N content in case 3 reflects the increase in DMC.
Case 4 shows the result of switching from the conditions of case 1 to those of case 3 at 40 DAS. There are no surprises here: the final yield is reduced less than in case 3 and the final composition is essentially the same as in case 3. Note, however, the longer transient period for nitrate adjustment: it was 1 d in case 3, and 5 d in case 4, demonstrating, once again, the effect of RGR on the dynamics of the system.
The effect of lowering the light level at 40 DAS is explored in case 5. The effect on production is similar to that of case 3, except that here the limiting factor is light rather than temperature. The effects on the composition are, however, in the opposite direction.
Case 6 is the first really drastic (virtual) treatment that drives the system deeply into the ‘severe’ stress region of Fig. 3. At 40 DAS the nitrate supply is abruptly terminated and structural growth, as reflected in fresh mass accumulation, ceases almost immediately. Dry matter continues to accumulate at a slower rate (in comparison with case 1), by storing carbohydrates in the ‘dry’ excess‐C compartment. This is reflected in the very considerable linear increase of DMC and in its inverse effect on the reduced‐nitrogen concentration, in agreement with Figs 2 and 3. Nitrate is depleted (from the vacuole) within 4 d. From the commercial point of view this crop is, of course, worthless.
What would happen if the instant of N‐interruption is delayed? Case 7 shows the result of interruption at 60 DAS. First note that the time required for nitrate depletion is now 12 rather than 4 d, again in accord with the change in RGR. This delays the severe stress, and hence the complete cessation of growth, by about 10 d. The accumulation of carbohydrates in the excess‐C compartment starts at the termination instance, as indicated by the DMC and reduced‐N traces. The lesser slopes of these two traces, compared with those in case 6, are due not to a smaller absolute flux into the excess‐C compartment, but to a four‐fold larger crop at 60 DAS compared with that at 40 DAS.
Finally, the model predicts that a considerable accumulation of material in the excess‐C compartment is possible even if N nutrition is not limiting, provided that the carbon source : sink ratio is very large (such as in Nederhoff et al., 1992). This has been produced in case 8 by high light and low temperature. While case 8 is similar in its general trends to case 6, there are considerable qualitative differences, resulting from the fact that in case 8 the crop continues to grow, albeit at a low rate, which is dictated by the low temperature.
DISCUSSION
General model characteristics
The model was designed to simulate the behaviour of a lettuce crop subjected to severe nitrogen stress. Its biological justification is rather sketchy, but the main processes are represented and simulation results seem to mimic qualitatively the experimental evidence (e.g. Figs 2 and 3). The model contains two uncommon elements: an osmotica balance (in the ‘vacuole’) and an excess‐carbon compartment. Loosely speaking, the former controls the balance between nitrate and soluble carbon compounds, and the latter controls the balance between reduced‐nitrogen and total carbon. The excess‐carbon compartment is only necessary under severe N‐stress conditions or under a high carbon source : sink ratio.
Two fluxes are driven by external substrate concentrations: photosynthesis, p, and nitrogen uptake, u [eqns (23) and (34)]. Unlike other models (Burns, 1994; Thornley, 1997), the internal fluxes are driven by availability of substance rather than by concentration gradients. Passive processes are more naturally associated with concentration gradients, while active processes are associated with ‘demand’ and ‘supply’. In this respect, the present model leans towards the active view.
The model does not treat carbon assimilation and nitrogen uptake symmetrically. Carbon may be assimilated ‘in excess’, while nitrogen is taken up ‘as needed’ for structural growth and osmotica balance. From this point of view there is no truly ‘luxury consumption’ of nitrogen.
The role of ξ
Physiologically, the parameter ξ (0 ≤ ξ ≤ 1) determines how much of the excess photosynthetic capacity (beyond the supply for leaf expansion) is prevented from being materialized, and how much is in fact produced, but diverted to the excess‐C storage compartment. It is likely—and fitting studies (R. Linker and I. Seginer, unpubl. res.) have shown—that the value of ξ is somewhere around 0·5 (simulations in this paper assumed ξ = 0·4). In a future refinement, ξ may be made a function of the thickness of the leaves, such that when the leaves are ‘sufficiently’ thick, the production of all excess carbon is stopped. A possible formulation is:

where ξ approaches zero as MCe/MCs approaches 1/ζ. Since, from Fig. 2, the highest value of (MCs + MCv + MCe)/(MCs + MCv), in the bottom‐left, is more than 4 (compared with the ‘normal’ points in the top‐right), ζ might be around 1/4.
‘Mild’ and ‘severe’ N‐stress
Figure 3 has been used to illustrate the ‘stages’ (in an interruption experiment) or ‘ranges’ (in constant environment experiments) where N‐stress is considered to be ‘mild’ or ‘severe’. ‘Severe’ stress starts when essentially all the removable nitrate has been depleted. In view of the photosynthesis limitation function hp (Fig. 5), depletion to below ΓNv≡1−ΓCv=1−bp is very difficult. Hence, the data of Fig. 3 suggest a value of bp that is very close to 1 (unlike in Fig. 5). In the simulations, therefore, bp = 0·97.
Characteristic times
The simulations demonstrate the effect of the size of the crop on its transient behaviour. While the crop is small and grows exponentially at a high RGR, its compositional response is fast. This is reflected in the high daily amplitude of Cnit‐N (and of the complementing soluble carbon compounds) and in the fast transition at 40 DAS. As the canopy closes, RGR declines, accompanied by smaller amplitudes and slower transitions.
To test these qualitative predictions, frequent measurements are required, but these are rare. However, on the assumption that the predictions are correct, the practical conclusions might be as follows: (1) there is no preferred harvest hour (e.g. afternoon) for mature lettuce, since the fluctuations in nitrate concentration at the time of harvest are small; and (2) if a corrective measure (supplementary light, N interruption) is to be taken to reduce nitrate concentration just before harvest, it should be started approx. 1 week prior to the expected harvest time.
Nutrient‐limitation experiments
Two nutrient limitation treatments are often reported: (1) a ‘steady‐state’ treatment, where only a (constant) fraction of the crop’s demand (namely of FCvs,A) is provided (e.g. Ingestad and Lund, 1979); and (2) an ‘interruption’ treatment (e.g. Burns, 1992) where, at a certain time, the nutrient supply is terminated. Since the steady‐state treatment normally starts only after a period of abundant nutrient supply, the interruption treatment is, in fact, a special case of the steady‐state treatment. Ingestad‐type experiments exhibit a ‘lag phase’ (namely a transient) before growth becomes ‘steady state’ (constant composition) again. This ‘lag phase’ is longer the larger the step between the pre‐treatment nutrient level and the level imposed by the treatment. This also applies to non‐nutrient treatments. In the simulations, case 4 represents a ‘mild’ treatment, where the transient is less than 10 d, while case 8 represents a more ‘extreme’ treatment, where the transient is longer than 20 d. The drastic treatment of complete nutrient withdrawal (‘interruption’; case 6) results in an infinite transient.
CONCLUSIONS
The modified model, with the excess‐carbon compartment added, is capable of predicting, at least qualitatively, the nitrate and nitrogen content of lettuce, not only under mild N‐stress conditions (leading to low nitrate content), but also under severe N‐stress. It has been formulated to agree with the observed (for lettuce) compositional relationships of Figs 1 and 2, and it can predict common observations for young (vegetative) plants. Since good short‐term data are not available, the fast (diurnal) response of the model could not be tested. It was also not possible to find lettuce data for high‐light and low‐temperature conditions, such as simulated in case 8. Otherwise, however, simulation results agree with the experimental evidence, mainly of N interruption experiments, and in particular with Figs 2 and 3. The model has been fitted successfully to several sets of experimental data (not shown here). However, each fitting resulted in a somewhat different parameter set. At least some of this lack of robustness may be attributed to cultivar differences and to different measurement techniques.
ACKNOWLEDGEMENTS
This research has been funded by EU project FAIR6‐CT98‐4362 (Nicolet). Dr F. Buwalda (PPO, Aalsmeer, The Netherlands), coordinator of the project, suggested the use of the osmotica balance [eqn (10)] as a pivotal element of the model and also supplied some of the data used in this paper. Dr S. Adamowicz (INRA, Avignon, France) and Drs I. Burns and A. Escobar (Horticulture Research Inter national, Wellsbourne, UK) made valuable comments on an early version of the manuscript, which was written during a sabbatical leave from Technion at Wageningen University and Research (WUR), MRS group, Wageningen, The Netherlands. I am indebted to Professor G. van Straten, Dr I. Ioslovich and Dr R. Linker, with whom the various versions of the Nicolet model have been developed.
APPENDIX
Negative nitrate–sugar correlation from Behr and Wiebe (1988)
Table 2 of Behr and Wiebe (1988) shows the contribution of soluble organic compounds, and of inorganic cations and anions, to the total osmotic potential in the cell sap of lettuce. K+ and H2PO4– were found to be positively correlated with nitrate NO3–, while Cl–, Ca2+, Mg2+, malate C4H6O5, fructose (CH2O)6 and glucose (CH2O)6 were negatively correlated. The concentration in the sap of NO3– was 76·1 mol (N) m–3 and that of the sugars was 13·4 mol (C) m–3. The osmotic contributions of all the compounds were calculated from the measured concentrations, and those positively and negatively correlated with NO3– separately added up to 387 kPa and 132 kPa, respectively. The concentrations of nitrate and sugar required to produce the total osmotic potential, 519 kPa, assuming linear contributions, are 102 mol (N) m–3 (= 76·1 × 519/387) and 53 mol (C) m–3 (= 13·4 × 519/387). These two numbers are the intercepts of the dashed line on the axes of Fig. 1.
Table 1A.
Parameter values
| Value | Units | |
| Core model parameters | ||
| Crop size | ||
| a | 1·7 | m2 (ground) mol–1 (C) |
| Photosynthesis | ||
| ϵ | 0·03 | mol (C) mol–1 (PAP) |
| σ | 6·0 ×10–3 | m s–1 |
| Nitrogen uptake* | ||
| ϕ | 12 | mol (N) mol–1 (C) |
| K | 0·1 | mol (N) m–3 (H2O) |
| Respiration | ||
| θ | 0·3 | – |
| v | 9·5 | – |
| k | 0·25×10–6 | mol (C) m–2 (ground) s–1 |
| c | = 0·0693† | K–1 |
| T* | = 20 | °C |
| Crop composition | ||
| βC | 0·6 | m3 (H2O) kPa mol–1 (C) |
| βN | 6·0 | m3 (H2O) kPa mol–1 (N) |
| Π | 580 | kPa |
| λ | 0·0009 | m3 (H2O) mol–1 (C) |
| r | 0·16 | mol (N) mol–1 (C) |
| Attenuation | ||
| sp | 10 | – |
| sg | 10 | – |
| bp | 0·97 | – |
| bg | 0·2 | – |
| ξ | 0·4 | – |
| Conversion parameters | ||
| ηC | 0·03 | kg (DM) mol–1 (C) |
| ηN | 0·10 | kg (DM) mol–1 (N) |
| ρ | 1000 | kg (H2O) m–3 (H2O) |
| P | 25 | plant m–2 |
* The parameters ϕ and K were not actually used in the simulations in this paper, since N supply was either abundant or zero.
†c = 0·0693 K–1 is equivalent to the common value Q10 = 2, meaning a doubling of respiration for every 10 K temperature increase.
Table 1B.
Notation
| Symbol | Definition | Unit |
| Main symbols | ||
| a | Light extinction coefficient | m2 (ground) mol–1 (C) |
| bg | Growth limitation border | – |
| bp | Photosynthesis limitation border | – |
| CJj | Concentration of substance J in compartment j | mol (J) m–3 |
| CJ | Content of substance J | mol (J) kg–1 (DM) |
| C | Exponent in respiration equation | K–1 |
| E{Tj} | Maintenance respiration rate of a closed‐canopy crop | mol (C) m–2 (ground) s–1 |
| FCg | Growth respiration rate | mol (C) m–2 (ground) s–1 |
| FCm | Maintenance respiration rate | mol (C) m–2 (ground) s–1 |
| F Cp | Gross photosynthesis rate | mol (C) m–2 (ground) s–1 |
| F Jij | Flux of substance J from compartment i to compartment j | mol (J) m–2 (ground) s–1 |
| f{MCs} | Fraction of light intercepted by canopy | – |
| g | A collection of parameters | m3 (H2O) Pa mol–1 (C) |
| G{Tj} | Unattenuated growth rate of a closed canopy | mol (C) m–2 (ground) s–1 |
| hg{ΓCv} | Growth limitation function (hg = 1 when no limitation) | – |
| hp{ΓCv} | Photosynthesis limitation function (hp = 1 when no limitation) | – |
| I | Light intensity | mol (PAP) m–2 (ground) s–1 |
| K | Maintenance respiration rate at T = T* | mol (C) m–2 (ground) s–1 |
| K | Michaelis–Menten coefficient for N uptake | mol (N) m–3 (H2O) |
| M Jj | Molar mass of substance J in compartment j | mol (J) m–2 (ground) |
| p | Plants per unit ground area | plant m–2 |
| P{I,CCa} | Unattenuated gross photosynthesis of a closed canopy | mol (C) m–2 (ground) s–1 |
| r | N : C ratio in structure | mol (N) mol–1 (C) |
| s g | Growth limitation slope | – |
| s p | Photosynthesis limitation slope | – |
| T j | Temperature of compartment j | K |
| T * | Reference temperature | K |
| t | Time | s |
| U{CNn,Tn} | Uptake rate of nitrogen by a closed canopy | mol (N) m–2 (ground) s–1 |
| V | Volume of water | m3 (H2O) m–2 (ground) |
| W | Weight of plant | kg per plant |
| θ | Osmotic potential associated with one unit of vacuolar J | m3 (H2O) Pa mol–1 (J) |
| ΓJv | Normalised J‐concentration in vacuole | – |
| ϵ | Photosynthetic efficiency | mol (C) mol–1 (PAP) |
| ζ | An alternative to ξ | – |
| ηJ | Conversion factor; dry matter to substance J | kg (DM) mol–1 (J) |
| θ | Growth respiration as fraction of growth | – |
| λ | Volume of water associated with one unit of structural C | m3 (H2O) mol–1 (C) |
| ν | Ratio g{t}/e{t} | – |
| ξ | Partitioning parameter | – |
| Π | Osmotic potential in vacuole | Pa |
| ρ | Density of water | kg (H2O) m–3 (H2O) |
| σ | Leaf conductance to CO2 | m s–1 |
| ϕ | Nitrogen uptake efficiency | mol (N) mol–1 (C) |
| Subscripts | ||
| Compartments | ||
| a | Ambient air | |
| e | Excess carbon | |
| i,j | General compartment indices | |
| n | Nutrient solution | |
| s | Structure | |
| v | Vacuole | |
| Substances | ||
| C | Carbon | |
| D | Dry matter | |
| F | Fresh matter | |
| I,J | General substance indices | |
| N | Nitrogen | |
| nit‐N | nitrate N | |
| red‐N | reduced N | |
| tot‐N | total N | |
| Nutritional situations | ||
| A | Abundant N | |
| L | Limiting N | |
| Acronyms | ||
| DMC | Dry matter content | |
| FM | Fresh matter | |
| PAP | Photosynthetically active photons | |
| RGR | Relative growth rate | |
| RNR | Relative nutrient addition rate |
–, Indicates dimensionless quantities.
{}, Used exclusively to contain the arguments of functions.
Supplementary Material
Received: 11 September 2002; Returned for revision: 6 December 2002; Accepted: 20 January 2003
References
- AlberdaT.1965. The influence of temperature, light intensity and nitrate concentration on dry‐matter production and chemical composition of Lolium perenne L. Netherlands Journal of Agricultural Sciences 13: 335–360. [Google Scholar]
- AltC, Kage H, Stützel H.2000. Modelling nitrogen content and distribution in cauliflower (Brassica oleracea L. botrytis). Annals of Botany 86: 963–973. [Google Scholar]
- BarnesA, Hole CC.1978. A theoretical basis of growth and maintenance respiration. Annals of Botany 42: 1217–1221. [Google Scholar]
- BehrU, Wiebe HJ.1988. Relations between nitrate content and other osmotica in the cell sap of lettuce cultivars (Lactuca sativa L.). Gartenbauwissenschaft 53: 206–210. [Google Scholar]
- Blom‐ZandstraM, Lampe JEM.1985. The role of nitrate in the osmoregulation of lettuce (Lactuca sativa L.) grown at different light intensities. Journal of Experimental Botany 36: 1043–1052. [Google Scholar]
- Blom‐ZandstraM, Lampe JEM, Ammerlaan FHM.1988. C and N utilization of two lettuce genotypes during growth under non‐varying light conditions and after changing the light intensity. Physiologia Plantarum 74: 147–153. [Google Scholar]
- BooteKJ, Jones JW, Hoogenboom G, Pickering NB.1998. The CROPGRO model for grain legumes. In: Tsuji GY, Hoogenboom G, Thornton PK, eds. Understanding options for agricultural production Dordrecht: Kluwer, 99–128. [Google Scholar]
- BroadleyMR, Escobar‐Gutierrez AJ, Burns A, Burns IG.2000. What are the effects of nitrogen deficiency on growth components of lettuce? New Phytologist 147: 519–526. [DOI] [PubMed] [Google Scholar]
- BurnsIG.1992. Influence of plant nutrient concentration on growth rate: use of a nutrient interruption technique to determine critical concentrations of N, P and K in young plants. Plant and Soil 142: 221–233. [Google Scholar]
- BurnsIG.1994. Studies of the relationship between the growth rate of young plants and their total‐N concentration using nutrient interruption techniques: theory and experiments. Annals of Botany 74: 143–157. [Google Scholar]
- BuwaldaF, Warmenhoven M.1999. Growth limiting phosphate nutrition suppresses nitrate accumulation in greenhouse lettuce. Journal of Experimental Botany 50: 813–821. [Google Scholar]
- CannellMGR, Thornley JHM.2000. Modelling the components of plant respiration: some guiding principles. Annals of Botany 85: 45–54. [Google Scholar]
- Cárdenas‐NavarroR, Adamowicz S, Robin P.1999. Nitrate accumulation in plants: a role for water. Journal of Experimental Botany 50: 613–624. [Google Scholar]
- ClementCT, Jones LHP, Hopper MJ.1979. Uptake of nitrogen from flowing nutrient solution: effect of terminated and intermittent nitrate supplies. In: Hewitt ET, Cutting CV, eds. Nitrogen assimilation of plants London: Academic Press, 123–133. [Google Scholar]
- CriddleRS, Smith BN, Hansen LD.1997. A respiration based description of plant growth rate responses to temperature. Planta 201: 441–445. [Google Scholar]
- de GrootCC, Marcelis LFM, van den Boogaard R, Lambers H.2001. Growth and dry‐mass partitioning in tomato as affected by phosphorus nutrition and light. Plant, Cell and Environment 24: 1309–1317. [Google Scholar]
- de Pinheiro HenriquesAR, Marcelis LFM.2000. Regulation of growth at steady‐state nitrogen nutrition in lettuce (Lactuca sativa L.): interactive effects of nitrogen and irradiance. Annals of Botany 86: 1073–1080. [Google Scholar]
- DrewsM, Schonhof I, Krumbein A.1995. Influence of growth season on the content of nitrate, vitamin C, β‐carotin and sugar of head lettuce under greenhouse conditions. Gartenbauwissenschaft 60: 180–187. [Google Scholar]
- European Commission.1999. Amending regulation (EC) no. 194/97 setting maximum levels for nitrate in lettuce and spinach. EC Regulation no. 864/99. [Google Scholar]
- FoyerCH.1988. Feedback inhibition of photosynthesis through source‐sink regulation in leaves. Plant Physiology and Biochemistry 26: 483–492. [Google Scholar]
- GaryC.1988. A simple carbon balance model simulating the short‐term responses of young vegetative tomato plants to light, CO2 and temperature. Acta Horticulturae 229: 245–250. [Google Scholar]
- GentMPN, Enoch HZ.1983. Temperature dependence of vegetative growth and dark respiration: a mathematical model. Plant Physiology 71: 562–567. [DOI] [PMC free article] [PubMed] [Google Scholar]
- GrindlayDJC.1997. Towards an explanation of crop nitrogen demand based on the optimization of leaf nitrogen per unit leaf area. Journal of Agricultural Science 128: 377–396. [Google Scholar]
- GrindlayDJC, Sylvester‐Bradley R, Scott RK.1995. The relationship between canopy green area and nitrogen in the shoot. INRA, Les Colloques 82: 53–60. [Google Scholar]
- IngestadT, Ågren GI.1992. Theories and methods on plant nutrition and growth. Physiologica Plantarum 84: 177–184. [Google Scholar]
- IngestadT, Lund AB.1979. Nitrogen stress in birch seedlings. Physiologia Plantarum 45: 137–148. [Google Scholar]
- JonesJW, Luyten JC.1998. Simulation of biological processes. In: Peart RM, Curry RB, eds. Agricultural systems modeling and simulation New York: Marcel Dekker, 19–50. [Google Scholar]
- JustesE, Mary B, Meynard JM, Machet JM, Thelier‐Huche L.1994. Determination of a critical nitrogen dilution curve for winter wheat crop. Annals of Botany 74: 397–407. [Google Scholar]
- LeighRA, Johnston AE.1985. Nitrogen concentrations in field grown spring barley: an examination of the usefulness of expressing concentrations on the basis of tissue water. Journal of Agricultural Science 105: 397–406. [Google Scholar]
- LeighRA, Johnston AE.1987. The usefulness of expressing nitrogen concentrations in crops on the basis of tissue water. Journal of the Science of Food Agriculture 38: 317–318. [Google Scholar]
- MacRobbieEAC.1976. Accumulation of ions in plant cell vacuoles. In: Davies PS, Sunderland N, eds. Perspectives of experimental biology, Vol. 2. Botany Oxford: Pergamon Press, 369–380. [Google Scholar]
- McCreeKJ.1982. Maintenance requirements of white clover at high and low growth rates. Crop Science 22: 345–351. [Google Scholar]
- McCreeKJ.1983. Carbon balance as a function of plant size in sorghum plants.Crop Science 23: 1173–1177. [Google Scholar]
- MaynardDN, Barker AV, Minotti PL, Peck NH.1976. Nitrate accumulation in vegetables. Advances in Agronomy 28: 71–118. [Google Scholar]
- MottRL, Steward FC.1972. Solute accumulation in plant cells. I. Reciprocal relations between electrolytes and non‐electrolytes. Annals of Botany 36: 621–639. [Google Scholar]
- NederhoffEM, de Koning ANM, Rijsdijk AA.1992. Leaf deformation and fruit production of glasshouse grown tomato (Lycopersicon esculentum) as affected by CO2, plant density and pruning. Journal of Horticultural Science 67: 411–420. [Google Scholar]
- OscarsonP, Ingemarsson B, Larsson CM.1989. Growth and nitrate uptake properties of plants grown at different relative rates of nitrogen supply. I. Growth of Pisum and Lemna in relation to nitrogen. Plant, Cell and Environment 12: 779–785. [Google Scholar]
- RamanDR, Spanswick RM, Walker LP.1995. The kinetics of nitrate uptake from flowing solutions by rice: influence of pretreatment and light. Bioresource Technology 53: 125–132. [Google Scholar]
- SeginerI, Buwalda F, van Straten G.1998. Nitrate concentration in greenhouse lettuce: a modelling study. Acta Horticulturae 456: 189–197. [Google Scholar]
- SeginerI, Gary C, Tchamitchian M.1994. Optimal temperature regimes for a greenhouse crop with a carbohydrate pool. A modeling study. Scientia Horticulturae 60: 55–80. [Google Scholar]
- SeginerI, van Straten G, Buwalda F.1999. Lettuce growth limited by nitrate supply. Acta Horticulturae 507: 141–148. [Google Scholar]
- SeginerI, Shina G, Albright LD, Marsh LS.1991. Optimal temperature setpoints for greenhouse lettuce. Journal of Agricultural Engineering Research 49: 209–226. [Google Scholar]
- SweeneyDG, Hand DW, Slack G, Thornley JHM.1981. Modelling the growth of winter lettuce. In: Rose DA, Charles‐Edwards DA, eds. Mathematics in plant physiology London: Academic Press, 217–229. [Google Scholar]
- ThornleyJHM.1997. Modelling allocation with transport/conversion processes. Silva Fennica 31: 341–355. [Google Scholar]
- ThornleyJHM, Johnson IR.1990. Plant and crop modelling: a mathematical approach to plant and crop physiology. Oxford: Oxford University Press. [Google Scholar]
- ThorntonB, Lemaire G, Millard P, Duff EI.1990. Relationships between nitrogen and water concentration in shoot tissue of Molinia caerulea during shoot development. Annals of Botany 83: 631–636. [Google Scholar]
- van HentenEJ.1994. Validation of a dynamic lettuce growth model for greenhouse climate control. Agricultural Systems 45: 55–72. [Google Scholar]
- van KeulenH, Penning de Vries FWT, Drees EM.1982. A summary model for crop growth. In: Penning de Vries FWT, van Laar HH, eds. Simulation of plant growth and crop production. Wageningen: Pudoc. [Google Scholar]
- VeenBW, Kleinendorst A.1985. Nitrate accumulation and osmotic regulation in Italian Ryegrass (Lolium multiflorum Lam.). Journal of Experimental Botany 36: 211–218. [Google Scholar]
- WaltersCL, Walker R.1979. Consequences of accumulation of nitrate in plants. In: Hewitt EJ, Cuttings CV, eds. Nitrogen assimilation of plants London: Academic Press, 637–677. [Google Scholar]
Associated Data
This section collects any data citations, data availability statements, or supplementary materials included in this article.


