

Abstract
Lignin is derived mainly from three alcohol monomers: p‐coumaryl alcohol, coniferyl alcohol and sinapyl alcohol. Biochemical reactions probably responsible for synthesizing these three monomers from sucrose, and then polymerizing the monomers into lignin, were analysed to estimate the amount of sucrose required to produce a unit of lignin. Included in the calculations were amounts of respiration required to provide NADPH (from NADP+) and ATP (from ADP) for lignin biosynthesis. Two pathways in the middle stage of monomer biosynthesis were considered: one via tyrosine (found in monocots) and the other via phenylalanine (found in all plants). If lignin biosynthesis proceeds with high efficiency via tyrosine, 76·9, 70·4 and 64·3 % of the carbon in sucrose can be retained in the fraction of lignin derived from p‐coumaryl alcohol, coniferyl alcohol and sinapyl alcohol, respectively. The corresponding carbon retention values for lignin biosynthesis via phenylalanine are less, at 73·2, 65·7 and 60·7 %, respectively. Energy (i.e. heat of combustion) retention during lignin biosynthesis via tyrosine could be as high as 81·6, 74·5 and 67·8 % for lignin derived from p‐coumaryl alcohol, coniferyl alcohol and sinapyl alcohol, respectively, with the corresponding potential energy retention values for lignin biosynthesis via phenylalanine being less, at 77·7, 69·5 and 63·9 %, respectively. Whether maximum efficiency occurs in situ is unclear, but these values are targets that can be considered in: (1) plant breeding programmes aimed at maximizing carbon or energy retention from photosynthate; (2) analyses of (minimum) metabolic costs of responding to environmental change or pest attack involving increased lignin biosynthesis; (3) understanding costs of lignification in older tissues; and (4) interpreting carbon balance measurements of organs and plants with large lignin concentrations.
Key words: Biosynthesis, alcohol, p‐coumaryl alcohol, lignin, metabolic efficiency, respiration, sinapyl alcohol
INTRODUCTION
Lignins are large, complex, perhaps ‘random’ (see Sederoff et al., 1999), polymers derived mainly from the dehydrogenative polymerization of cinnamyl alcohols. The three principal alcohols (or lignin monomer precursors, called monolignols) are p‐coumaryl alcohol, coniferyl alcohol and sinapyl alcohol, although other monomers can also be used in lignin biosynthesis (Whetten et al., 1998). Within a lignin polymer, the monolignol residues are interconnected by a variety of bonds, and can also bond to polysaccharides and proteins. This results in multifarious and sturdy three‐dimensional structures. These structures provide mechanical strength to secondary cell walls (particularly in wood), which is especially important in tracheids under mechanical stress from the transpiration process. Lignin is also important in plant responses to (and defences against) pathogens, mechanical perturbation and other stresses (e.g. Cipollini, 1997). A high lignin concentration (mass of lignin per unit dry phytomass) may slow microbial decomposition of dead phytomass, so lignin might contribute to regulation of biogeochemical cycles. Lignin is also significant to global pools and fluxes of carbon; Graham (1993, p. 219) asserted (without presenting supporting data or calculations) that lignins constitute 25 % of global net primary production (NPP) with only cellulose representing a greater fraction of NPP.
The complex nature of lignin and lignin–polysaccharide–protein structures makes it difficult to determine the precise chemical composition of lignins. Nonetheless, it is known that gymnosperm lignins are based mainly on coniferyl alcohol, dicot lignins are usually a mixture of coniferyl and sinapyl alcohols, and monocot lignins are a mixture of all three alcohols (e.g. Goodwin and Mercer, 1983; Boudet et al., 1995; Higuchi, 1997; Whetten et al., 1998). It is likely that the relative mixture of monolignol residues in lignins varies among cells and organs of individual plants—and perhaps even spatially within individual cell wall segments—and that this mixture changes over time with developmental stage and environmental conditions. For example, the contribution of sinapyl alcohol increases during maturation in some grasses (Carpita, 1996).
Measurement of lignin concentration is hampered by lack of a lignin standard sample (there is no single structure of lignins), though it is clear that lignin concentration can vary with location in the secondary wall of individual cells and between walls of different cells in the same tissue (Agarwal and Atalla, 1986). Lignin concentration also varies between taxonomic groups and between organs of the same plant. Leaves and roots of herbaceous plants may average about 3–5 % lignins, and their stems may average about 4–5 % lignins (Poorter and Villar, 1997). Woody plant leaves and twigs can contain 2–27 % lignins and woody stems may average 15–36 % lignins (Higuchi, 1985; Hughes and Fahey, 1991; Poorter and Villar, 1997; Raiesi Gahrooee, 1998). Within crops, tubers (e.g. potato) may be only 3 % lignins, cereal inflorescences with seeds may be 3–14 % lignins, and sugar cane (Saccharum sp.) shoots and coconut palm (Cocos nucifera) fruits may be about 25 % lignins (Penning de Vries et al., 1983). In terms of carbon (compared with dry mass), lignins account for a larger fraction of plant tissue than indicated by percentage dry mass values cited above because the carbon concentration of lignins is higher than that of most other components of phytomass. That is, while lignins are typically about 65–67 % carbon, the dry mass of many plant tissues is only 44–50 % carbon.
When lignins constitute a large fraction of a plant’s (or organ’s) dry mass, efficiency of its biosynthesis is important to that plant’s (or organ’s) carbon and metabolic energy budgets. In spite of this importance, none of the recent major reviews of lignin biosynthesis (e.g. Boudet et al., 1995; Whetten and Sederoff, 1995; Campbell and Sederoff, 1996; Higuchi, 1997; Whetten et al., 1998) has addressed the basic questions of how much photosynthate is needed to produce a unit of lignin and how this varies with lignin composition (relative fraction of different monolignols). The goal of this paper is to outline answers to these questions, based on present knowledge of biochemical pathways of lignin biosynthesis and respiration. Emphasis is placed on the range of values that arise from different biosynthetic pathways.
APPROACH
The amount of biomass (or biomass component) that is produced from a unit of substrate (i.e. photosynthate) during growth is determined by the biochemical pathways used in biosynthesis and respiration, and the stoichiometries of individual biosynthetic and respiratory reactions making up those pathways. This fundamental fact was used by Penning de Vries et al. (1974) to calculate potential efficiencies of biosynthesis of biomass components from a glucose substrate based on presumed catabolic and anabolic pathways and stoichiometries (see also de Wit et al., 1970, 1978; Penning de Vries et al., 1983, 1989). Unfortunately, the calculations of lignin biosynthesis made by Penning de Vries et al. (1974) were limited by lack of knowledge of the biochemical pathways involved, though later analyses (e.g. Williams et al., 1987; Thornley and Johnson, 1990) used more up‐to‐date knowledge. An even clearer picture of reactions of lignin biosynthesis (and respiration) is now available, so calculations of potential efficiency of lignin biosynthesis can be improved.
Calculations of biosynthetic efficiency based on biochemical pathways and reaction stoichiometries must begin with a specific substrate, and must account for any cosubstrates. Specific reaction sets (pathways) must transform the substrate(s) into a specific end product(s) and must account for any by‐products(s) formed. Any net ATP or NAD(P)H requirements are supplied by additional substrate consumption in respiration. The efficiency of biosynthesis is then given by the ratio end product formed per unit substrate consumed.
More than 100 biochemical reactions were included in this analysis. They are shown explicitly so that assumptions made in deriving quantitative estimates of potential efficiency of converting substrate to lignins are clear. Because most lignification occurs after much of the cell wall and protoplast growth has occurred, it was presumed that lignin biosynthesis occurs mostly in and around more or less fully functioning cells.
SUBSTRATES OF LIGNIN BIOSYNTHESIS AND OF RESPIRATION
Simple carbohydrates, or closely related compounds, are the main substrates of lignin biosynthesis and respiration in most plant cells. In photosynthetically active cells, these substrates may come directly from photosynthesis; otherwise, they arise from breakdown of previously stored compounds, such as starch, or arrive from intercellular transport. Most lignin is probably synthesized from transported sugars. Methanol might serve as a cosubstrate of lignin biosynthesis, as described below.
Sucrose is the major form of translocated carbon in many plants—although other compounds (carbohydrates, amides and others) can make up a significant fraction of the carbon translocated from ‘sources’ to growing ‘sinks’ in some species (Ziegler, 1975; Zimmermann and Ziegler, 1975)—and it was chosen as the substrate of both lignin biosynthesis and respiration in this analysis. Most other likely substrates give similar (or identical) results in terms of efficiency of lignin biosynthesis. Molecular oxygen (O2) is a cosubstrate of both lignin biosynthesis and respiration. This analysis expressed net metabolic activity associated with lignin biosynthesis in terms of consumption of sucrose (and sometimes methanol, see below) and O2.
All previous theoretical analyses of metabolic costs of lignin biosynthesis used glucose as substrate (e.g. Penning de Vries et al., 1974; Williams et al., 1987).
END PRODUCTS AND BY‐PRODUCTS OF LIGNIN BIOSYNTHESIS AND RESPIRATION
Because lignins are complex polymers, and no standard composition can be defined, calculations were based on end products being the dehydrogenated residues of the three main monolignols. Production of the by‐product CO2 was quantified. Net interconversion of Pi and inorganic pyrophosphate (PPi) was also tracked.
Characteristics of sucrose, methanol, monolignols and the end product monolignol residues used in this analysis are summarized in Table .
Table 1.
Characteristics of sucrose, methanol, the three main monolignols, assumed average monomer (monolignol) residues in lignin polymers, and some extracted lignins
| Heat of combustion (ΔHc)† | Reference | |||||||
| Compound | Composition | Molecular mass* (g mol–1) | C content (g mol–1) | C fraction (g g–1) | (MJ mol–1) | (kJ g–1) | (kJ [g C]–1) | (for heat of combustion) |
| Sucrose | C12H22O11 | 342·3 | 144·1 | 0·421 | 5·641 | 16·48 | 39·14 | Domalski (1972) |
| Methanol (gas) | CH4O | 32·04 | 12·01 | 0·375 | 0·7645 | 23·86 | 63·65 | Domalski (1972) |
| Monolignols (alcohols) | ||||||||
| p‐Coumaryl | C9H10O2 | 150·2 | 108·1 | 0·720 | 4·62‡ | 30·8‡ | 42·8‡ | |
| Coniferyl | C10H12O3 | 180·2 | 120·1 | 0·667 | 5·10‡ | 28·3‡ | 42·5‡ | |
| Sinapyl | C11H14O4 | 210·2 | 132·1 | 0·628 | 5·59‡ | 26·6‡ | 42·3‡ | |
| Monomer (monolignol) residues | ||||||||
| Hydroxyphenyl | C9H9O2 | 149·2 | 108·1 | 0·725 | 4·49‡ | 30·1‡ | 41·6‡ | |
| Guaiacyl | C10H11O3 | 179·2 | 120·1 | 0·670 | 4·97‡ | 27·7‡ | 41·4‡ | |
| Syringyl | C11H13O4 | 209·2 | 132·1 | 0·631 | 5·45‡ | 26·1‡ | 41·3‡ | |
| Extracted lignins (from wood)§ | ||||||||
| General value | 26·7 | B.M. Jenkins, pers. comm. (1998) | ||||||
| Spruce | 26·26 | Brauns (1952, p. 185) | ||||||
| 26·4 | Rydholm (1967) | |||||||
| Douglas fir | 26·65 | Shafizadeh and DeGroot (1976) | ||||||
| Quercus rubra L. | 21·18 | Murphey and Masters (1978) | ||||||
* Based on atomic masses of 1·0079, 12·011 and 15·9994 g mol–1 for H, C and O, respectively.
† Heats of combustion are given as positive values throughout. They generally correspond to dry substances in thermodynamic standard states (i.e. stable forms of the compounds at 25 °C and 1 atmosphere pressure). Conversions from published units were based on 4·184 J calorie–1.
‡ Calculated from formulas in Domalski et al. (1987, p. 339) relating elemental composition to heat of combustion.
§ Chemical extraction of lignins from wood is likely to change their chemical properties, including their state of reduction and therefore heat of combustion. Extraction probably reduces the heat of combustion by partially oxidizing lignins.
SUCROSE BREAKDOWN TO HEXOSE PHOSPHATES AND PRODUCTION OF PREPHENATE
In this analysis, both lignin biosynthesis and respiration begin with breakdown of sucrose to the hexose phosphates (hexose‐P) glucose 6‐P and fructose 6‐P. Sucrose breakdown is assumed to occur in the cytosol, though it can also occur in the apoplast. Sucrose can be cleaved by invertase or sucrose synthase (Fig. 1).

Fig. 1. Pathways from sucrose to prephenate. Substrate and end product of the reaction set are enclosed in boxes. Enzyme Commission (EC) numbers are given with each reaction. Many reactions are reversible; arrows indicate direction for lignin biosynthesis and for respiration. Sucrose is split by either invertase (β‐fructofuranosidase; EC 3.2.1.26) or sucrose synthase (EC 2.4.1.13). Dashed arrows at the top differentiate alternative ‘starting points’ for sucrose catabolism. Products of sucrose breakdown contribute to a pool of cytosolic glucose 6‐P and fructose 6‐P (ap Rees, 1988), which are freely interconvertible in what is labelled ‘hexose‐P pool’. In the cytosol, fructose 6‐P can be converted to fructose 1,6‐P2 by two different reactions, one catalysed by 6‐phosphofructokinase (EC 2.7.1.11) and the other by PPi–fructose‐6‐P 1‐phosphotransferase (EC 2.7.1.90). Dashed arrows indicate alternative sources of fructose 1,6‐P2. [PPi–fructose‐6‐P 1‐phosphotransferase is confined to cytosol (Plaxton, 1996), so if fructose 6‐P is phosphorylated in plastids, only one reaction is available.] Fructose 1,6‐P2 is converted to 2 phosphoenolpyruvate (PEP) in glycolysis. As drawn, glycerone‐P moves from cytosol to plastid, although other glycolytic intermediates (e.g. glucose 1‐P, 3‐P‐glycerate and PEP) can also move from cytosol to plastids (Plaxton, 1996). The Pi exchanged for glycerone‐P during cytosolic‐plastidic countertransport is balanced by net Pi releases in the plastid. As drawn, the hexose‐P pool supplies glucose 6‐P to plastids, where erythrose 4‐P (E4P) is produced by cyclic operation of the oxidative pentose phosphate pathway (OPPP) (ap Rees, 1985; Copeland and Turner, 1987; Debnam and Emes, 1999). The PEP and E4P formed by glycolysis and the OPPP, respectively, are combined in the shikimate pathway to produce prephenate. Naming of shikimate pathway intermediates follows Herrmann and Weaver (1999). NAD is required by 3‐dehydroquinate synthase (EC 4.6.1.3). Shikimate 5‐dehydrogenase (EC 1.1.1.25) and 3‐dehydroquinate dehydratase (EC 4.2.1.10) are bifunctional forms of a single polypeptide (Herrmann and Weaver, 1999). [Oxidation of NADPH by shikimate 5‐dehydrogenase is not explicitly shown in Herrmann and Weaver (1999, their Fig. 4).] Chorismate synthase (EC 4.6.1.4) requires NADPH and reduced flavin (FMN) (Higuchi, 1997). Shikimate pathway reactions through to at least chorismate production are presumably confined to plastids (Herrmann and Weaver, 1999). Chorismate and chorismate mutase (EC 5.4.99.5) may exist in plastids and cytosol (Eberhard et al., 1996a, b; Sommer and Heide, 1998; Mobley et al., 1999). It is assumed that NAD+/NADH, NADP+/NADPH and ADP/ATP shuttles maintain cytosolic/plastidic metabolite balances without additional inputs.
The products of invertase action are glucose plus fructose, which can be directly phosphorylated to form glucose 6‐P and fructose 6‐P, respectively.
Sucrose breakdown by sucrose synthase yields fructose plus UDP‐glucose. This fructose can be phosphorylated directly, giving fructose 6‐P, and the UDP‐glucose can be converted to glucose 6‐P in two steps (Fig. 1).
Glucose 6‐P and fructose 6‐P are interconvertible by the action of glucose 6‐P isomerase (EC 5.3.1.9; Fig. 1).
Monolignols are derived from prephenate. Each prephenate molecule is formed following the combination of two phosphoenolpyruvate (PEP) molecules with one erythrose 4‐P molecule in the shikimate pathway (Fig. 1). In plants, the shikimate pathway may be confined to plastids (Herrmann and Weaver, 1999).
Substrates of the shikimate pathway (i.e. PEP and erythrose 4‐P) can be produced from glucose 6‐P and/or fructose 6‐P in glycolysis and the oxidative pentose phosphate pathway (OPPP), which is how their production is viewed in this analysis (Fig. 1).
The most efficient production of prephenate from sucrose by reactions included in Fig. 1 is summarized in eqn (S.1), whereas the least efficient is summarized in eqn (S.4) (Table ). The difference between these two summary equations is 3 ATP per sucrose, assuming cytosolic PPi is freely available. But is PPi likely to be available? Most major biosynthetic pathways, including those producing lignin, release PPi as a by‐product (see below). It has often been stated (e.g. in textbooks) that any PPi produced is quickly hydrolysed to Pi by inorganic pyrophosphatase (EC 3.6.1.1) in order to facilitate further activity of reactions releasing PPi. On the contrary, biosynthetic reactions generally remain thermodynamically favourable at all physiological PPi levels (references in Plaxton, 1996), so a PPi pool probably would not slow lignin biosynthesis. Moreover, a stable and significant pool (0·2–0·3 mm) of PPi might exist in leaf cytosol (Weiner et al., 1987; and see Dancer and ap Rees, 1989). Thus, although data are limited—or non‐existent for woody cells in situ—PPi may be freely available (from a relatively stable pool) to support conversion of UDP‐glucose to glucose 1‐P and conversion of fructose 6‐P to fructose 1,6‐P2 (Fig. 1).
Table 2.
Summary equations describing conversion of sucrose to prephenate
| No.* | Summary equation | ||
| S.1 | Sucrose + ADP + 2 NAD+ + 3 NADP+ + 2 PPi | → | prephenate + ATP + 2 NADH + 3 NADPH + 3 Pi + H2O + 2 CO2 |
| S.2 | Sucrose + 2 NAD+ + 3 NADP+ + PPi | → | prephenate + 2 NADH + 3 NADPH + 2 Pi + H2O + 2 CO2 |
| S.3 | Sucrose + ATP + 2 NAD+ + 3 NADP+ + PPi | → | prephenate + ADP + 2 NADH + 3 NADPH + 3 Pi + 2 CO2 |
| S.4 | Sucrose + 2 ATP + 2 NAD+ + 3 NADP+ | → | prephenate + 2 ADP + 2 NADH + 3 NADPH + 2 Pi + 2 CO2 |
Figure 1 shows complete reaction sequences. Summary equations are listed in order from most (S.1) to least (S.4) efficient. Equation (S.1) represents the reaction set including sucrose cleavage by sucrose synthase (EC 2.4.1.13), and fructose 6‐P phosphorylation by PPi‐fructose‐6‐P 1‐phosphotransferase (EC 2.7.1.90). Equation (S.2) represents the reaction set including sucrose cleavage by sucrose synthase, and fructose 6‐P phosphorylation by 6‐phosphofructokinase (EC 2.7.1.11). Equation (S.3) represents the reaction set including sucrose cleavage by invertase (β‐fructofuranosidase; EC 3.2.1.26), and fructose 6‐P phosphorylation by PPi‐fructose‐6‐P 1‐phosphotransferase. Equation (S.4) represents the reaction set including sucrose cleavage by invertase, and fructose 6‐P phosphorylation by 6‐phosphofructokinase.
* Summary equation numbers (No.) are used elsewhere in analysis.
MONOLIGNOL BIOSYNTHESIS FROM PREPHENATE
Monolignols are derived from 4‐coumarate, which is synthesized by pathways originating with prephenate (Fig. 2). It is noted that combined activity of glutamate synthase (NADH) (EC 1.4.1.14) and glutamate‐ammonia ligase (EC 6.3.1.2) (often abbreviated GS/GOGAT) regenerates glutamate from 2‐oxoglutarate and NH3, which is required for continued conversion of prephenate to arogenate (Fig. 2). This regeneration uses one NADH and one ATP per 2‐oxoglutarate recycled and NH3 assimilated (the NH3 assimilation is required to balance the NH3 released during phenylalanine or tyrosine deamination; Fig. 2). Glutamate dehydrogenase (EC 1.4.1.2; GDH) is also found in plants, often at high levels, and it can regenerate glutamate from 2‐oxoglutarate and NH3, oxidizing NADH but without an ATP requirement. Thus, GDH would be the preferred route of 2‐oxoglutarate regeneration and NH3 recovery from an energetic standpoint. Nonetheless, GDH appears not to be involved in normal 2‐oxoglutarate regeneration or NH3 assimilation (Goodwin and Mercer, 1983; Lea et al., 1990; Lam et al., 1996; Miflin and Habash, 2002). Instead, GDH may function primarily in catabolism of amino acids during germination and senescence. Earlier calculations of biosynthetic stoichiometries (e.g. Penning de Vries et al., 1974; Williams et al., 1987; Thornley and Johnson, 1990) used GDH to regenerate glutamate from 2‐oxoglutarate and NH3. Those earlier calculations were therefore probably more efficient (one less ATP required per 2‐oxoglutarate recycled) than actual plant metabolism, and represented a potential efficiency of glutamate regeneration.

Fig. 2. Pathways from prephenate to 4‐coumaryl alcohol, coniferyl alcohol and sinapyl alcohol. Substrate and end products of the reaction set are enclosed in boxes. EC numbers are given for most reactions; conversion of arogenate to tyrosine with NADP+ as cosubstrate follows Rösler et al. (1997), though no EC number for the catalysing enzyme has been assigned, and enzymes labelled C3H (4‐hydroxycinnamate 3‐hydroxylase) (e.g. Higuchi, 1997), F5H (ferulate 5‐hydroxylase) (e.g. Higuchi, 1997), CCoA3H (caffeoyl‐CoA 3‐hydroxylase) (e.g. Eckardt, 2002) and SAD (sinapyl alcohol dehydrogenase) (e.g. Li et al., 2001) have apparently not been assigned EC numbers. Two routes from arogenate to 4‐coumarate are shown (indicated by dashed arrows at branch points). The tyrosine route is found in monocots and the phenylalanine route in all plants. Activity of phenylalanine ammonia‐lyase (EC 4.3.1.5) with both phenylalanine and tyrosine as substrate resides in a single polypeptide (Rösler et al., 1997). The NH3 released in both routes is assumed to be re‐assimilated in a reaction coupled to regeneration of glutamate from 2‐oxoglutarate, which is consistent with measurements by Razal et al. (1996). Predominant pathways converting 4‐coumarate to 4‐coumaryl alcohol, coniferyl alcohol and sinapyl alcohol are shown with solid lines (e.g. Guo et al., 2001; Li et al., 2001; Eckardt, 2002). Dashed lines in the lower part of the figure indicate possible alternative routes of coniferyl alcohol and sinapyl alcohol biosyntheses (e.g. Whetten et al., 1998; Zhong et al., 1998; Chen et al., 1999; Guo et al., 2001; Eckardt, 2002). It is assumed here that reactions shown with dashed lines in the lower part of the figure involve the same cosubstrates and by‐products shown for reactions to their left or right (for vertical arrows), or above or below (for horizontal arrows). Thus, input–output balances are equal for any pathway from 4‐coumarate to a given monolignol. Glutamate‐ammonia ligase (EC 6.3.1.2) is active in the cytosol (Lea et al., 1990) and plastids. Pathways from prephenate to tyrosine and phenylalanine might occur in plastids or the cytosol. The P450‐mono‐oxygenase (EC 1.14.13.11) catalysing conversion of trans‐cinnamate to 4‐coumarate is bound to an endoplasmic reticulum.
Two pathways from arogenate to 4‐coumarate are considered (Fig. 2): one via phenylalanine and the other via tyrosine. The tyrosine pathway is energetically more efficient because it reduces NADP+ rather than oxidizing NADPH. The net difference in producing 4‐coumarate from prephenate via tyrosine compared with production via phenylalanine is a gain (or saving) of 2 NADPH per 4‐coumarate produced. The more efficient pathway (i.e. via tyrosine) appears to exist only in monocots (Goodwin and Mercer, 1983).
The CO2 released (and O2 taken up in the phenylalanine pathway) during conversion of prephenate to 4‐coumarate (Fig. 2) contributes to measurements of ‘respiration’ when respiration is equated with CO2 release (or O2 uptake), but does not arise from a respiratory reaction per se. Nonetheless, it is part of ‘growth respiration’, defined as CO2 release (or O2 uptake) associated with growth (Penning de Vries et al., 1989, p. 59).
A single pathway is likely for the production of 4‐coumaryl alcohol from 4‐coumarate, but there is apparent flexibility in pathways from 4‐coumarate to coniferyl and sinapyl alcohols (bottom of Fig. 2). This may be important to regulation of the composition of lignins (i.e. relative contribution of different monolignols to lignins), but from the perspective of biosynthetic efficiency, alternative pathways for biosynthesis of a specific monolignol from 4‐coumarate are equivalent (according to Fig. 2).
Although p‐coumaryl alcohol biosynthesis occurs without a methoxylation reaction, the biosynthesis of coniferyl and sinapyl alcohols involves one and two methoxylation reactions, respectively (Fig. 2). The methyl donor in all cases is thought to be S‐adenosylmethionine (SAM). During each methoxylation, SAM is converted to S‐adenosylhomocysteine (SAH). For continued biosynthesis of coniferyl or sinapyl alcohols, SAM must be regenerated from SAH. That regeneration is considered below.
Production of each monolignol from prephenate requires inputs of 3 ATP and 1 NADH per monolignol, and 1 CO2, 1 PPi and 1 Pi are released per monolignol formed (Table ). In addition, conversion of prephenate to 4‐coumaryl alcohol requires either 1 NADPH [eqn (S.5)] or 3 NADPH and 1 O2 [eqn (S.6)] depending on whether tyrosine or phenylalanine is an intermediate (Table ). Conversion of prephenate to coniferyl alcohol requires 1 SAM and either 2 NADPH and 1 O2 [eqn (S.7)], or 4 NADPH and 2 O2 [eqn (S.8)], depending on whether tyrosine or phenylalanine is an intermediate (Table ). Conversion of prephenate to sinapyl alcohol requires 2 SAM and either 3 NADPH and 2 O2 [eqn (S.9)], or 5 NADPH and 3 O2 [eqn (S.10)] depending on whether tyrosine or phenylalanine is an intermediate (Table ).
Table 3.
Summary equations describing monolignol biosynthesis from prephenate
| No.* | Summary equation | ||
| 4‐Coumaryl alcohol | |||
| S.5 | Prephenate + 3 ATP + NADH + NADPH | → | 4‐coumaryl alcohol + 3 ADP + NAD+ + NADP+ + PPi + Pi + CO2 |
| S.6 | Prephenate + 3 ATP + NADH + 3 NADPH + O2 | → | 4‐coumaryl alcohol + 3 ADP + NAD+ + 3 NADP+ + PPi + Pi + CO2 + 2 H2O |
| Coniferyl alcohol | |||
| S.7 | Prephenate + 3 ATP + NADH + 2 NADPH + O2 + SAM | → | coniferyl alcohol + 3 ADP + NAD+ + 2 NADP+ + PPi + Pi + CO2 + H2O + SAH |
| S.8 | Prephenate + 3 ATP + NADH + 4 NADPH + 2 O2 + SAM | → | coniferyl alcohol + 3 ADP + NAD+ + 4 NADP+ + PPi + Pi + CO2 + 3 H2O + SAH |
| Sinapyl alcohol | |||
| S.9 | Prephenate + 3 ATP + NADH + 3 NADPH + 2 O2 + 2 SAM | → | sinapyl alcohol + 3 ADP + NAD+ + 3 NADP+ + PPi + Pi + 2 H2O + CO2 + 2 SAH |
| S.10 | Prephenate + 3 ATP + NADH + 5 NADPH + 3 O2 + 2 SAM | → | sinapyl alcohol + 3 ADP + NAD+ + 5 NADP+ + PPi + Pi + 4 H2O + CO2 + 2 SAH |
Figure 2 shows complete reaction sequences. Equations (S.5), (S.7) and (S.9) include the tyrosine pathway (found only or mainly in monocots), whereas eqns (S.6), (S.8) and (S.10) include the phenylalanine pathway (found in all plants). SAH, S‐Adenosylhomocysteine; SAM, S‐adenosylmethionine.
* Summary equation numbers (No.) are used elsewhere in analysis.
Compounds other than the three main monolignols may serve as lignin precursors, resulting particularly from mutations affecting ‘normal’ enzymes of lignin biosynthesis (Sederoff et al., 1999). Reaction details are unclear, but in most cases the biosynthetic efficiencies of these alternative precursors probably fall within the range calculated herein for 4‐coumaryl alcohol and sinapyl alcohol. For example, 5‐hydroxyconiferyl alcohol may be used in lignin biosynthesis, which would place the efficiency of that fraction of lignin biosynthesis between that arising from the use of coniferyl alcohol and sinapyl alcohol (as drawn in Fig. 2). Also, a few per cent of lignin may be derived from the aldehydes rather than alcohols shown in Fig. 2 (Whetten et al., 1998), which would reduce the NADPH requirement by one per monomer and reduce slightly the reduction state of the lignins formed.
MONOLIGNOL GLYCOSYLATION, STORAGE, TRANSPORT TO APOPLAST AND POLYMERIZATION
The monolignols p‐coumaryl alcohol, coniferyl alcohol and sinapyl alcohol are formed in the cytosol, but lignin biosynthesis occurs in the apoplast. Moreover, monolignols are unstable and toxic. In angiosperms, monolignols may be transferred to the apoplast immediately after being formed, where they participate in lignin formation. In gymnosperms, however, monolignols may be stored in stable forms, perhaps in vacuoles, before being transported to the apoplast (Whetten and Sederoff, 1995). In this analysis, it was assumed that any transport of stable forms of monolignols into a vacuole required energy.
Glycosylation is apparently used to stabilize monolignols and reduce their toxicity in (some) plants. The glucoside of coniferyl alcohol (coniferin) can be formed by the action of coniferyl‐alcohol glucosyltransferase (EC 2.4.1.111) as follows (Fig. 3):

Fig. 3. Monolignol transport from cytosol to apoplast, followed by polymerization. Monolignol starting points and lignin polymer end points are shown in boxes. Enzyme Commission (EC) numbers are given with each reaction. Three alternatives are shown for monolignol transport to apoplast (one including an intermediate stage of glycosylation and vacuolar storage) and two alternatives are shown for polymerization. ATP hydrolysis is probably not directly coupled to monolignol transport from cytosol to apoplast as shown, but may involve H+ pumping to apoplast followed by H+ re‐entry into cytosol coupled to countertransport of monolignols. Alternatively, monolignols (or monolignol glucosides) might move from cytosol to apoplast freely. ‘Ligninn’ indicates a lignin polymer composed of n monolignol residues. The reaction sequence for H2O2 production, required for peroxidase (EC 1.11.1.x) activity, is based on Elstner (1987) and Higuchi (1997) among others. Regeneration of malate from oxaloacetate is required for continued operation of the H2O2‐producing reaction set, and this is assumed to occur in cytosol. Laccase (EC 1.10.3.2) uses only dissolved molecular oxygen as cosubstrate (Yaropolov et al., 1994). (Laccase does not use 0·5 O2 in a reaction, nor is 0·5 H2O2 used in combination with cycling of 0·5 OAA and 0·5 malate for peroxidase activity; the stoichiometries relative to 1 monolignol are shown, and assume a limited chain reaction of radical propagation.) Only net O2 uptake and H2O production (or consumption) accompany polymerization in the apoplast, though this is linked to cytosolic NADH oxidation when peroxidase is active. Önnerud et al. (2002) proposed that peroxidase is never in direct contact with a monolignol during polymerization, but rather that a diffusible redox shuttle (they used Mn‐based systems in their experiments) could facilitate the radical polymerization process. The net stoichiometry of lignin polymerization might be unaffected by such a diffusible redox shuttle.
coniferyl alcohol + UDP‐glucose → coniferin + UDP
A similar reaction, perhaps catalysed by the same enzyme, might form glucosides of p‐coumaryl alcohol and sinapyl alcohol, i.e. p‐glucocoumaryl alcohol and syringin, respectively (Luckner, 1990). Coniferin can accumulate to significant amounts in gymnosperms (e.g. Savidge, 1989; Leinhos and Savidge, 1993).
The transport of monolignol glucosides from vacuoles to the apoplast (as in gymnosperms) may be an active process and, without knowledge to the contrary, the cost of such transport was set by conjecture in this analysis to 1 ATP (forming 1 ADP and 1 Pi at the plasmalemma) per glucoside transported. For the direct transfer of monolignols to the apoplast following their biosynthesis (i.e. without glycosylation or transport into a vacuole, as in angiosperms?), the same active‐transport cost of 1 ATP per monolignol might occur. It is also possible, however, that both free monolignols and glucosides diffuse freely (i.e. without cost) down a concentration gradient from the cytosol through channels in the plasmalemma to the site of lignin polymerization within cell walls (Fig. 3).
Because lignin is synthesized from monolignols rather than glucosides, alcohols must be regenerated from any monolignol glucosides formed. If required, that regeneration was assumed to occur in the apoplast by action of coniferin β‐glucosidase (EC 3.2.1.126) (e.g. Dharmawardhana et al., 1995), releasing glucose (Fig. 3). The same, or a similar, enzyme may regenerate both p‐coumaryl alcohol and sinapyl alcohol from their respective glucosides (if any). Transport of glucose (or one of its products) from apoplast to cytosol was assumed to occur without metabolic cost in this analysis. For example, it might be coupled to monolignol or glucoside transport to the apoplast in an antiporter. Alternatively, the hydrolysis reaction might occur in the cytosol rather than the apoplast, which would eliminate the need for glucose transport back into cytosol. If, however, glucose transport from apoplast to cytosol associated with the Fig. 3 reaction set occurs, and is an energy‐requiring process, additional ATP (or PPi) would be required for lignin biosynthesis.
From the perspective of a biochemical balance sheet, the glucose produced during deglycosylation must be used to regenerate UDP‐glucose, although the glycosylation and deglycosylation reactions may be separated in time. In any case, UDP‐glucose regeneration can be accomplished by the reaction set in Fig. 3. Note that the reaction catalysed by UTP–glucose‐1‐P uridylyltransferase (EC 2.7.7.9) in Fig. 3 operates in the opposite direction compared with the pathway downstream of UDP‐glucose in Fig. 1. The UTP‐glucose‐1‐P uridylyltransferase‐catalysed reaction may be close to equilibrium and freely reversible in vivo (Weiner et al., 1987), so two‐way interconversion of UDP‐glucose and glucose 1‐P is possible, as would be needed for lignin biosynthesis if monolignols are glycosylated at the same time and place that sucrose is cleaved by sucrose synthase.
The precise mechanism(s) of monolignol polymerization is unclear. A general notion is that monolignols are converted into free radicals that then polymerize spontaneously. During polymerization, the three monolignols may be converted to (approximately) hydroxyphenyl residues, guaiacyl residues and syringyl residues, respectively (see Table for residue characteristics). Though most evidence is circumstantial rather than direct and unequivocal, the two enzymes most often considered as catalysing the formation of the monolignol radicals are laccase(s) (EC 1.10.3.2) and peroxidase(s) (EC 1.11.1.‐) (e.g. Sterjiades et al., 1993; Boudet et al., 1995; Nose et al., 1995; Higuchi, 1997; Whetten et al., 1998; Ranocha et al., 1999; Richardson et al., 2000; Gavnholt and Larsen, 2002). During polymerization, the radical structure of monolignols may be retained after the linkage of an alcohol residue to a lignin polymer, causing a chain reaction or propagation of radicals (Luckner, 1990; Boudet et al., 1995). In this analysis, it was assumed that 1 H atom is removed from each monolignol during polymerization, which defines the stoichiometries associated with laccase and peroxidase activities, both of which produce H2O (Fig. 3). Laccase activity is more efficient than peroxidase activity because peroxidase activity requires NADH (Fig. 3).
By considering three ‘pathways’ of monolignol transfer from cytosol to apoplast, and two alternative sources of radicals, six ‘pathways’ from cytosolic monolignol to cell wall lignin are possible (Fig. 3). The metabolic cost of monolignol transfer from cytosol to apoplast (with or without glycosylation), followed by polymerization, ranges from 0 ATP or NADH to 4 ATP plus 0·5 NADH per monolignol (Table ). Summary equations with the highest cost [i.e. eqns (S.15) and (S.16)] presumably apply mainly to gymnosperms. In this analysis, O2 requirements for monolignol polymerization ranged from 0·25 to 0·50 O2 per monolignol, depending on the relative contribution of laccases and peroxidases to polymerization (Table ). That O2 consumption would count toward ‘growth respiration’ measured as O2 uptake.
Table 4.
Summary equations describing transfer of cytosolic monolignols to apoplast, followed by their polymerization
| No.* | Summary equation | ||
| S.11 | Ligninn + monolignol + 0·25 O2 | → | ligninn+1 + 0·5 H2O |
| S.12 | Ligninn + monolignol + 0·5 NADH + 0·5 O2 | → | ligninn+1 + 0·5 NAD+ + H2O |
| S.13 | Ligninn + monolignol + ATP + 0·25 O2 | → | ligninn+1 + ADP + Pi + 0·5 H2O |
| S.14 | Ligninn + monolignol + ATP + 0·5 NADH + 0·5 O2 | → | ligninn+1 + ADP + 0·5 NAD+ + Pi + H2O |
| S.15 | Ligninn + monolignol + 4 ATP + 0·25 O2 + 0·5 H2O | → | ligninn+1 + 4 ADP + PPi + 2 Pi |
| S.16 | Ligninn + monolignol + 4 ATP + 0·5 NADH + 0·5 O2 | → | ligninn+1 + 4 ADP + 0·5 NAD+ + PPi + 2 Pi |
Summary equations account for all six combinations of monolignol transfer from cytosol to apoplast [including possible temporary vacuolar storage, included in eqns (S.15) and (S.16)] and polymerization of apoplastic monolignols shown in Fig. 3. ‘Ligninn’ indicates a lignin polymer composed of n monolignol residues. Equations are arranged from most (top) to least (bottom) efficient. Equations (S.11), (S.13) and (S.15) represent reaction sets including laccase activity, whereas the other equations represent reaction sets including peroxidase activity. If PPi instead of ATP is used to drive monolignol transport from cytosol to apoplast via a proton pump (but see Davies et al., 1997; Ratajczak et al., 1999), eqns (S.13) and (S.14) would require 1 PPi for input, but no ATP. Similarly, if PPi instead of ATP is used to drive monolignol transport into vacuoles via a proton pump (see Davies, 1997), eqns (S.15) and (S.16) would require only 3 ATP as input, but would produce no net PPi.
* Summary equation numbers (No.) are used elsewhere in analysis.
REGENERATION OF S‐ADENOSYLMETHIONINE FROM S‐ADENOSYLHOMOCYSTEINE
There are several possible reaction sets for SAM regeneration in higher plants. It presumably involves one‐carbon metabolism associated with 5,6,7,8‐tetrahydrofolate (THF), and might rely on formate as a one‐carbon donor or on serine and/or glycine (Cossins, 1987; Heldt, 1997, p. 298–299) (Fig. 4). If formate is consumed in SAM regeneration, production of formate must be included in costs of lignin biosynthesis (for coniferyl and sinapyl alcohol‐based fractions of lignin). Similarly, if serine is used for SAM regeneration, serine production must be included in costs of lignin biosynthesis.

Fig. 4. Pathways regenerating S‐adenosylmethionine (SAM) from S‐adenosylhomocysteine (SAH). Substrates and end product of the reaction set are enclosed in boxes. EC numbers are given with each reaction. Many reactions are reversible; arrows indicate direction required for SAM regeneration. The first reaction (on the left) releases adenosine. Two reaction sets converting that adenosine to ADP are shown (differentiated by dashed arrows). The first begins with adenosine kinase (EC 2.7.1.20) activity, and the second begins with adenosine nucleosidase (EC 3.2.2.7) activity. The second includes α‐5‐phosphoribosylpyrophosphate (PRPP) as an intermediate. The preferred reaction set in plants is unknown; in yeasts with impaired adenosine kinase, SAH can accumulate, indicating that the adenosine kinase‐based reaction set is most important in these organisms (Ravanel et al., 1998). Two reaction subsets (differentiated by dashed arrows) are shown for conversion of 2 5,6,7,8‐tetrahydrofolate (THF) to 2 5,10‐methylene‐THF. The first (top, centre) consumes serine (and produces CO2) and the second (top, right) consumes formate (e.g. Chen et al., 1997). In plants, serine hydroxymethyltransferase (EC 2.1.2.1) was found in mitochondria, plastids and cytosol (Ravanel et al., 1998), and formate‐tetrahydrofolate ligase (EC 6.3.4.3) was found mainly in cytosol (Cossins and Chen, 1997). These reaction sets regenerate two SAM from two SAH so that when serine is used as substrate the glycine produced is also consumed in 5,10‐methylene‐THF production, giving only H2O, CO2 and NH3 as by‐products (the NH3 is assumed to be re‐assimilated during serine biosynthesis; Fig. 6). The 5,10‐methylene‐THF reductase (EC 1.5.1.20) reaction is known to occur in mammals. The enzyme in bacteria (EC 1.7.99.5) uses FADH2 rather than NADPH. It is unknown whether FADH2 or NADPH serve as the reductant in plants (Ravanel et al., 1998), or indeed, whether NADH might be used (Cossins and Chen, 1997); the NADPH‐requiring form was chosen here for convenience. THF might exist in mono‐ or polyglutamate forms (Cossins and Chen, 1997). Additional energy might be required to reattach any glutamate residues cleaved during operation of these reaction sets. In this analysis it was assumed that THF‐bound glutamate residues were not cleaved during SAM regeneration.
Adenosine recovery as ADP
Adenosine is released from SAH in the first reaction of SAM regeneration (Fig. 4). This adenosine is probably recycled to ADP. In this analysis, adenosine is converted to ADP by one of two reaction sets (Fig. 4). The salvage of adenosine in the first reaction set occurs by the action of adenosine kinase (EC 2.7.1.20). In the second reaction set, adenosine salvage occurs via adenosine nucleosidase (EC 3.2.2.7), which Le Floc’h and Faye (1995) suggested as a preferential route for metabolism of exogenous adenosine in Prunus persica. The second reaction set includes cycling of α‐5‐phosphoribosylpyrophosphate (Fig. 4).
Formate biosynthesis
Formate might be used in SAM regeneration, but knowledge of formate production in plants is incomplete, particularly in non‐photosynthetic cells. Several possible sources of formate are outlined in Hourton‐Cabassa et al. (1998) and Igamberdiev et al. (1999). In the simplest case, formate would be formed directly from CO2 and NAD(P)H by action of formate dehydrogenase (EC 1.2.1.2) or formate dehydrogenase (NADP+) (EC 1.2.1.43) as follows:
CO2 + NAD(P)H ↔ formate + NAD(P)+
Formate dehydrogenase is found in plants; however, thermodynamic considerations strongly favour CO2 production, and formate production from CO2 in plants has yet to be demonstrated (Colas des Francs‐Small et al., 1993).
Formate can be produced from methanol (Fig. 5), and methanol is a by‐product of pectin biosynthesis through activity of pectinesterase (EC 3.1.1.11) (Obendorf et al., 1990; Fall and Benson, 1996; Micheli, 2001). A complication with respect to this source of formate to support lignin biosynthesis is that for a given cell, pectins are produced mainly during primary cell wall production, whereas lignins are produced later during secondary cell wall synthesis (for cells that produce a secondary cell wall). Nonetheless, methanol produced during pectin biosynthesis could be important to lignin biosynthesis if monolignols are produced (and then stored) while the primary cell wall is being constructed or, perhaps more importantly, methanol moves from sites of primary cell wall production to nearby sites of concomitant secondary cell wall construction. Because of these possibilities, calculations were included in this analysis that accounted for methanol as a cosubstrate (as a source of formate) for lignin biosynthesis in order to quantify the potential effect of methanol use for the efficiency of lignin biosynthesis. It was assumed that methanol is ‘freely’ available for formate production, but any methanol produced during pectin biosynthesis must be considered a loss of carbon from the perspective of pectin and would be counted as such during calculations of efficiency of pectin biosynthesis (such calculations are beyond the scope of this study). Thus, any use of methanol for SAM regeneration (via formate) would represent a ‘recovery’ of a pectin by‐product, whereas methanol diffusing to the atmosphere in gas phase would be a loss of carbon during pectin biosynthesis.

Fig. 5. Potential pathways of formate production from methanol (e.g. Igamberdiev et al., 1999). EC numbers are given with each reaction. The two pathways shown are equivalent in terms of net inputs and net outputs.
Serine biosynthesis
A simple pathway of serine biosynthesis from PEP was chosen for this analysis (Fig. 6). The PEP required for serine production was assumed to be produced from sucrose breakdown, with two summary equations considered (Table ).
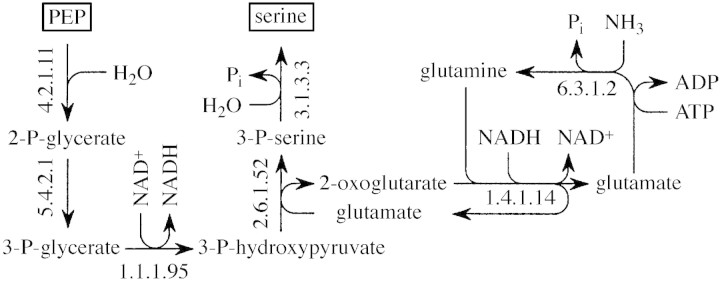
Fig. 6. Potential pathway of serine production from PEP (after Fig. 4·4–1 in Michal, 1999). EC numbers are given with each reaction. Some reactions are reversible; arrows indicate the direction for serine biosynthesis. In photosynthetically active cells, serine (and glycine) metabolism may be associated directly with photosynthesis, but such an association was ignored in the present analysis of lignin biosynthesis.
Table 5.
Summary equations describing regeneration of S‐adenosylmethionine (SAM) from S‐adenosylhomocysteine (SAH), recycling of adenosine released during SAH hydrolysis, formate production from methanol, serine production from phosphoenolpyruvate (PEP), and PEP production from sucrose
| No.* | Summary equation | ||
| SAM regeneration (per two SAM) | |||
| S.17 | 2 SAH + serine + 2 ATP + NAD+ + 2 NADPH + 3 H2O | → | 2 SAM + 2 adenosine + NADH + 2 NADP+ + 2 PPi + 2 Pi + CO2 + NH3 |
| S.18 | 2 SAH + 2 formate + 4 ATP + 4 NADPH + 2 H2O | → | 2 SAM + 2 adenosine + 2 ADP + 4 NADP+ + 2 PPi + 4 Pi |
| Adenosine recycling | |||
| S.19 | 2 Adenosine + 4 ATP | → | 6 ADP |
| S.20 | 2 Adenosine + 8 ATP + 2 H2O | → | 10 ADP + 2 PPi |
| Formate production from methanol (per two formate) | |||
| S.21 | 2 Methanol + 2 NAD+ + O2 | → | 2 formate + 2 NADH |
| Serine production from PEP | |||
| S.22 | PEP + ATP + 2 H2O + NH3 | → | serine + ADP + 2 Pi |
| PEP production from sucrose (per PEP) | |||
| S.23 | 0·25 Sucrose + ADP + NAD+ + 0·75 PPi + 0·5 Pi | → | PEP + ATP + NADH + H2O |
| S.24 | 0·25 Sucrose + NAD+ + Pi | → | PEP + NADH + 0·75 H2O |
| Complete requirement for SAM regeneration (per two SAM) | |||
| S.25 | 2 Methanol + 2 SAH + 8 ATP + 2 NAD+ + 4 NADPH + O2 + 2 H2O | → | 2 SAM + 8 ADP + 2 NADH + 4 NADP+ + 2 PPi + 4 Pi |
| S.26 | 2 Methanol + 2 SAH + 12 ATP + 2 NAD+ + 4 NADPH + O2 + 4 H2O | → | 2 SAM + 12 ADP + 2 NADH + 4 NADP+ + 4 PPi + 4 Pi |
| S.27 | 0·25 Sucrose + 2 SAH + 6 ATP + 2 NAD+ + 2 NADPH + 4 H2O | → | 2 SAM + 6 ADP + 2 NADH + 2 NADP+ + 1·25 PPi + 3·5 Pi + CO2 |
| S.28 | 0·25 Sucrose + 2 SAH + 11 ATP + 2 NAD+ + 2 NADPH + 6·25 H2O | → | 2 SAM + 11 ADP + 2 NADH + 2 NADP+ + 4 PPi + 3 Pi + CO2 |
Figures 4–6 show complete reaction sets. Equation (S.17) represents SAM regeneration consuming serine, whereas eqn (S.18) represents SAM regeneration consuming formate (Fig. 4). Equations (S.17) and (S.18) are based on regeneration of two SAM to correspond to Fig. 4. Equation (S.19) summarizes adenosine recycling according to the scheme on the left‐hand side in Fig. 4, whereas eqn (S.20) is according to that on the right‐hand side. Equation (S.21) summarizes Fig. 5 and eqn (S.22) summarizes Fig. 6. Equation (S.23) represents the reaction set in Fig. 1 beginning with sucrose breakdown by sucrose synthase and fructose 6‐P phosphorylation by PPI‐fructose‐6‐P 1‐phosphotransferase, whereas eqn (S.24) represents the reaction set in Fig. 1 beginning with sucrose breakdown by invertase and fructose 6‐P phosphorylation by 6‐phosphofructokinase. The other pathways from sucrose to PEP in Fig. 1 fall ‘between’ eqns (S.23) and (S.24) in terms of efficiency. Equation (S.25) represents the most efficient regeneration of SAM according to Figs 4 and 5 using formate [sum of (S.18), (S.19), (S.21)], whereas eqn (S.26) represents the least efficient regeneration of SAM using formate [sum of (S.18), (S.20) and (S.21)]. Equation (S.27) represents the most efficient regeneration of SAM according to Figs 4 and 6 using serine [sum of (S.17), (S.18), (S.22), (S.23)], whereas eqn (S.28) represents the least efficient regeneration of SAM using serine [sum of (S.18), (S.20), (S.22), (S.24)].
* Summary equation numbers (No.) are used elsewhere in analysis.
Serine may also be produced photosynthetically at no ‘cost’ if excess photosynthetic energy is available. Photosynthetically generated serine might be available directly in the cells producing it (when it is produced), or possibly in other cells at other times following intercellular transport (e.g. in phloem). Possible use of serine derived directly from photosynthesis was ignored in this analysis.
Reaction sets for S‐adenosylmethionine regeneration
If SAM is regenerated using formate, and formate is produced from methanol, a range of potential SAM regeneration requirements is given by eqns (S.25) and (S.26) (Table ). However, if SAM is regenerated using serine, and that serine is produced from sucrose, a different range of SAM regeneration requirements arises [eqns (S.27) and (S.28), Table ].
MAINTENANCE
Once formed, lignin does not turnover, so maintenance of previously formed lignin (i.e. ‘structure’ maintenance, sensu Penning de Vries et al., 1974) is negligible. Proteins catalysing reactions producing lignin, however, do presumably require maintenance (i.e. ‘tool’ maintenance, sensu Penning de Vries et al., 1974).
The tool maintenance rate depends on tool amounts and turnover rates. It was assumed that the turnover rate of proteins supporting lignin biosynthesis was related to lignin biosynthesis rate, although data are lacking. It was also assumed that the complement of proteins in cells changes in response to both the genesis and cessation of lignin biosynthesis. Both these assumptions imply changes in protein (re)synthesis rates associated with lignin biosynthesis and are considered tool maintenance herein.
Assigning costs to tool maintenance associated with lignin biosynthesis is hindered by lack of data, but speculative values are included for completeness. It was conjectured that 1 ATP per 4‐coumaryl alcohol synthesized and added to lignin is required for tool maintenance (releasing 1 ADP plus 1 Pi). Tool maintenance costs for coniferyl alcohol‐ and sinapyl alcohol‐based lignin were obtained by simple ratios as follows. On average, about 50 reactions were associated with conversion of sucrose to 4‐coumaryl alcohol (depending on which routes are used) and then adding that monolignol to a lignin polymer (Figs 1–3). In contrast, about 75 and 100 reactions were associated with biosynthesis of coniferyl and sinapyl alcohols and addition of those monolignols to a lignin polymer, respectively, assuming that SAM was regenerated from serine and that serine was produced from sucrose via PEP (Figs 1–4 and 6). Thus, the tool maintenance cost for coniferyl alcohol‐based lignin was assumed to be 1·5 ATP per monolignol, and that for sinapyl alcohol‐based lignin was assumed to be 2·0 ATP per monolignol. These values were used to represent possible differences in tool maintenance costs for addition of different monolignols to lignin polymers.
NET INPUT–OUTPUT STOICHIOMETRIES OF LIGNIN BIOSYNTHESIS
Net input–output stoichiometries for lignin biosynthesis were obtained by summing all summary equations associated with a particular pathway of lignin biosynthesis, accounting for proper multiples of those summary equations [e.g. dividing eqn (S.27) by two if only one SAH needs to be converted to SAM per monolignol]. Differences between the most and the least efficient reaction set input–output stoichiometries are given in Table ; the differences between equations for most (summary equation numbers with suffix ‘a’) and least efficient (summary equation numbers with suffix ‘b’) cases were due to different pathways of carbon metabolism and lignin biosynthesis. ATP requirements are one gauge of differences between most and least efficient reaction sets for lignin biosynthesis, as are differences in NADPH and NADH inputs and outputs (see Table ). For example, depending on the reaction set chosen, 6·5–16·5 ATP were required per coniferyl alcohol molecule synthesized and then added to a growing lignin polymer [eqns (5·31a)–(5·34b)]. The corresponding range of net NADPH requirements was 0–3, whereas 1·5–2·0 NADH were produced per coniferyl alcohol synthesized and added to a lignin polymer.
Table 6.
Summary equations describing input–output stoichiometric ranges for biosynthesis of lignin involving each monolignol, including tool maintenance cost
| No.* | Summary equation | ||
| Using 4‐coumaryl alcohol (via tyrosine) | |||
| S.29a | Sucrose + 3 ATP + NAD+ + 2 NADP+ + PPi + 0·25 O2 + ligninn | → | ligninn+1 + 3 ADP + NADH + 2 NADPH + 5 Pi + 1·5 H2O + 3 CO2 |
| S.29b | Sucrose + 10 ATP + 0·5 NAD+ + 2 NADP+ + 0·5 O2 + ligninn | → | ligninn+1 + 10 ADP + 0·5 NADH + 2 NADPH + 2 PPi + 6 Pi + 3 CO2 |
| Using 4‐coumaryl alcohol (via phenylalanine) | |||
| S.30a | Sucrose + 3 ATP + NAD+ + PPi + 1·25 O2 + ligninn | → | ligninn+1 + 3 ADP + NADH + 5 Pi + 3·5 H2O + 3 CO2 |
| S.30b | Sucrose + 10 ATP + 0·5 NAD+ + 1·5 O2 + ligninn | → | ligninn+1 + 10 ADP + 0·5 NADH + 2 PPi + 6 Pi + 2 H2O + 3 CO2 |
| Using coniferyl alcohol (via tyrosine; SAM regeneration from serine) | |||
| S.31a | 1·125 Sucrose + 6·5 ATP + 2 NAD+ + 0·375 PPi + 1·25 O2 + ligninn | → | ligninn+1 + 6·5 ADP + 2 NADH + 7·25 Pi + 0·5 H2O + 3·5 CO2 |
| S.31b | 1·125 Sucrose + 16 ATP + 1·5 NAD+ + 2·125 H2O + 1·5 O2 + ligninn | → | ligninn+1 + 16 ADP + 1·5 NADH + 4 PPi + 8 Pi + 3·5 CO2 |
| Using coniferyl alcohol (via phenylalanine; SAM regeneration from serine) | |||
| S.32a | 1·125 Sucrose + 6·5 ATP + 2 NAD+ + 2 NADPH + 0·375 PPi + 2·25 O2 + ligninn | → | ligninn+1 + 6·5 ADP + 2 NADH + 2 NADP+ + 7·25 Pi + 2·5 H2O + 3·5 CO2 |
| S.32b | 1·125 Sucrose + 16 ATP + 1·5 NAD+ + 2 NADPH + 0·125 H2O + 2·5 O2 + ligninn | → | ligninn+1 + 16 ADP + 1·5 NADH + 2 NADP+ + 4 PPi + 8 Pi + 3·5 CO2 |
| Using coniferyl alcohol (via tyrosine; SAM regeneration from formate) | |||
| S.33a | Sucrose + methanol + 7·5 ATP + 2 NAD+ + NADPH + 1·75 O2 + ligninn | → | ligninn+1 + 7·5 ADP + 2 NADH + NADP+ + 7·5 Pi + 1·5 H2O + 3 CO2 |
| S.33b | Sucrose + methanol + 16·5 ATP + 1·5 NAD+ + NADPH + H2O + 2 O2 + ligninn | → | ligninn+1 + 16·5 ADP + 1·5 NADH + NADP+ + 4 PPi + 8·5 Pi + 3 CO2 |
| Using coniferyl alcohol (via phenylalanine; SAM regeneration from formate) | |||
| S.34a | Sucrose + methanol + 7·5 ATP + 2 NAD+ + 3 NADPH + 2·75 O2 + ligninn | → | ligninn+1 + 7·5 ADP + 2 NADH + 3 NADP+ + 7·5 Pi + 3·5 H2O + 3 CO2 |
| S.34b | Sucrose + methanol + 16·5 ATP + 1·5 NAD+ + 3 NADPH + 3 O2 + ligninn | → | ligninn+1 + 16·5 ADP + 1·5 NADH + 3 NADP+ + 4 PPi + 8·5 Pi + H2O + 3 CO2 |
| Using sinapyl alcohol (via tyrosine; SAM regeneration from serine) | |||
| S.35a | 1·25 Sucrose + 10 ATP + 3 NAD+ + 2 NADPH + 0·5 H2O + 2·25 O2 + ligninn | → | ligninn+1 + 10 ADP + 3 NADH + 2 NADP+ + 0·25 PPi + 9·5 Pi + 4 CO2 |
| S.35b | 1·25 Sucrose + 22 ATP + 2·5 NAD+ + 2 NADPH + 4·25 H2O + 2·5 O2 + ligninn | → | ligninn+1 + 22 ADP + 2·5 NADH + 2 NADP+ + 6 PPi + 10 Pi + 4 CO2 |
| Using sinapyl alcohol (via phenylalanine; SAM regeneration from serine) | |||
| S.36a | 1·25 Sucrose + 10 ATP + 3 NAD+ + 4 NADPH + 3·25 O2 + ligninn | → | ligninn+1 + 10 ADP + 3 NADH + 4 NADP+ + 0·25 PPi + 9·5 Pi + 1·5 H2O + 4 CO2 |
| S.36b | 1·25 Sucrose + 22 ATP + 2·5 NAD+ + 4 NADPH + 2·25 H2O + 3·5 O2 + ligninn | → | ligninn+1 + 22 ADP + 2·5 NADH + 4 NADP+ + 6 PPi + 10 Pi + 4 CO2 |
| Using sinapyl alcohol (via tyrosine; SAM regeneration from formate) | |||
| S.37a | Sucrose + 2 methanol + 12 ATP + 3 NAD+ + 4 NADPH + 3·25 O2 + ligninn | → | ligninn+1 + 12 ADP + 3 NADH + 4 NADP+ + PPi + 10 Pi + 1·5 H2O + 3 CO2 |
| S.37b | Sucrose + 2 methanol + 23 ATP + 2·5 NAD+ + 4 NADPH + 2 H2O + 3·5 O2 + ligninn | → | ligninn+1 + 23 ADP + 2·5 NADH + 4 NADP+ + 6 PPi + 11 Pi + 3 CO2 |
| Using sinapyl alcohol (via phenylalanine; SAM regeneration from formate) | |||
| S.38a | Sucrose + 2 methanol + 12 ATP + 3 NAD+ + 6 NADPH + 4·25 O2 + ligninn | → | ligninn+1 + 12 ADP + 3 NADH + 6 NADP+ + PPi + 10 Pi + 3·5 H2O + 3 CO2 |
| S.38b | Sucrose + 2 methanol + 23 ATP + 2·5 NAD+ + 6 NADPH + 4·5 O2 + ligninn | → | ligninn+1 + 23 ADP + 2·5 NADH + 6 NADP+ + 6 PPi + 11 Pi + 3 CO2 |
These summary equations are based on appropriate combinations of eqns (S.1)–(S.28) (Tables 2–5) plus maintenance ATP (from text). Equation numbers with suffix ‘a’ indicate most efficient pathways, whereas summary equations with suffix ‘b’ indicate least efficient pathways. ‘Ligninn’ indicates a lignin polymer composed of n monolignol residues.
* Summary equation numbers (No.) are used elsewhere in analysis.
RESPIRATION SUPPORTING LIGNIN BIOSYNTHESIS
All the summary equations for lignin biosynthesis in Table include inputs of ATP, and most include inputs of NADPH. At the same time, they all show net reduction of NAD+ to NADH (i.e. net NADH production). Production of ATP and NADPH needed for input, and consumption (or use) of NADH produced, must be included in calculations of net sucrose requirements for lignin biosynthesis. In particular, ATP and NADPH requirements can be met by respiratory oxidation of additional sucrose, whereas the NADH formed can be oxidized to produce ATP via mitochondrial electron transport and ADP phosphorylation by the mitochondrial H+‐transporting ATP synthase (EC 3.6.1.34). Importantly, use of NADH from the right‐hand side of the summary equations (Table ) to produce ATP decreases the amount of sucrose needed for ATP production.
ATP production from sucrose catabolism
When complete catabolism of sucrose by combined action of glycolysis and the tricarboxylic acid (TCA) cycle is coupled to mitochondrial electron transport and ADP phosphorylation by the mitochondrial H+‐transporting ATP synthase, only ATP, H2O, CO2 and heat are produced. Only sucrose, ADP, Pi and O2 are consumed. The ratio of ATP produced per sucrose consumed during complete catabolism of sucrose by glycolysis and the TCA cycle is herein called YATP,sucrose (mol ATP produced per mole sucrose catabolized), and is defined by (adapted from Amthor, 1994, 2000):
YATP,sucrose = (12 – 2i – 2f) + [(1 – s)(cI 16 H+I +cIII,IV 24 H+III,IV) – 8]/(1 + H+ATP)for (1 – s)(cI 16 H+I + cIII,IV 24 H+III,IV) ≥ 8(1)
where i is the fraction, [0–1], of sucrose cleaved by invertase [the fraction (1–i) is cleaved by sucrose synthase] (see Fig. 1); f is the fraction (0–1) of fructose 6‐P phosphorylated by 6‐phosphofructokinase [the fraction (1–f) is phosphorylated by PPi‐fructose‐6‐P 1‐phosphotransferase] (see Fig. 1); the term (12 – 2i – 2f) is the number of ATP molecules produced in substrate‐level phosphorylations per sucrose oxidized (including 4 ATP in the TCA cycle in the mitochondrial matrix); s is the fraction (0–1) of protons pumped into the mitochondrial intermembrane space by the respiratory chain that re‐enter the mitochondrial matrix through membrane ‘leaks’; cI is the fraction (0–1) of electrons from matrix NADH that pass through the NADH dehydrogenase called Complex I (EC 1.6.5.3) [the fraction (1–cI) pass through the second matrix‐facing NADH dehydrogenase, which does not pump protons into the intermembrane space, but all electrons passing through either Complex I or the second matrix‐facing dehydrogenase reduce ubiquinone to ubiquinol]; 16 is the number of NADH molecules formed from NAD+ in the TCA cycle (in the mitochondrial matrix) per sucrose (i.e. 4 NADH per pyruvate × 4 pyruvate per sucrose); H+I is the number of protons pumped into the intermembrane space when a pair of electrons from NADH passes through Complex I (one electron pair per NADH); cIII,IV is the fraction (0–1) of electrons that move from ubiquinol through Complexes III (EC 1.10.2.2) and IV (EC 1.9.3.1), joined by reduction and oxidation of cytochrome c, to O2 forming H2O [the fraction (1–cIII,IV) move from ubiquinol to O2 via the mitochondrial alternative oxidase, also forming H2O, but not pumping protons into the intermembrane space]; 24 is the number of cytosolic plus mitochondrial NADH and mitochondrial FADH2 molecules formed from NAD+ and FAD, respectively, per sucrose catabolized; H+III,IV is the number of protons pumped into the intermembrane space when a pair of electrons from ubiquinol passes through both Complexes III and IV (one electron pair per ubiquinol); 8 is the number of protons that move back into the matrix along with Pi (H+‐Pi symport) to support substrate‐level ADP phosphorylations in the matrix and along with pyruvate (H+‐pyruvate symport supplying the TCA cycle with substrate) (4 with Pi plus 4 with pyruvate per sucrose oxidized); 1 in the denominator represents the proton entering the matrix via H+‐Pi symport with each Pi used for ADP phosphorylation by the mitochondrial H+‐transporting ATP synthase; and H+ATP represents the number of protons moving through the mitochondrial H+‐transporting ATP synthase per ADP phosphorylated. It is noted that ADP phosphorylation catalysed by ATP synthase may be spontaneous (i.e. may occur without major energy input); the energy supplied by proton flux through the ATP synthase is used to dislodge the resulting ATP from the enzyme so that additional ADP can be bound by the enzyme and then phosphorylated (Boyer, 1993). Use of eqn (1) assumes that PPi is freely available if either i or f are less than unity.
Parameter values in eqn (1) (i.e. i, f, s, cI, cIII,IV, H+III,IV and H+ATP) are somewhat uncertain. Available data indicate that H+I is 4 protons per electron pair, H+III,IV may be 6 protons per electron pair, and H+ATP is 3 protons per ADP (Nicholls and Ferguson, 1992; Haraux and de Kouchkovsky, 1998). The maximum value of YATP,sucrose is obtained with i, f and s each equal to zero, and with both cI and cIII,IV equal to unity. In that case (and with H+I = 4, H+III,IV = 6 and H+ATP = 3), YATP,sucrose = 62 (or 31 ATP per hexose). With i and f both equal to unity, and other values as above, YATP,sucrose = 58 (or 29 ATP per hexose). The minimum value of YATP,sucrose is 12 ATP per sucrose, according to eqn (1). In all uses of eqn (1) herein, i = 0·5, f = 0·5, s = 0, cI = 1, cIII,IV = 1, H+I = 4, H+III,IV = 6 and H+ATP = 3, so YATP,sucrose = 60 ATP per sucrose. Conversely, all earlier analyses of (potential) efficiency of lignin biosynthesis used ratios of 36 or 37 ATP per hexose (i.e. the equivalent of YATP,sucrose = 72 or 74), based on earlier estimates of ATP yield from respiration [e.g. cf. Stryer (1981) to Stryer (1995)].
The amount of CO2 released during sucrose catabolism to produce each ATP is given by 12/YATP,sucrose. The amount of O2 consumed during sucrose catabolism to produce each ATP is also given by 12/YATP,sucrose, and 2 H2O are produced per O2 consumed.
Futile cycles of ATP production and use (e.g. Torres et al., 1995) would reduce the ‘effective’ YATP,sucrose. Whether futile cycle activity is associated with lignin biosynthesis is unknown, and is not considered in this analysis.
ATP production from NADH oxidation
All pathways of lignin biosynthesis summarized in Table resulted in net reduction of NAD+ to NADH. All NADH was formed in plastids or cytosol. Cytosolic NADH was assumed to have free access to the cytosol‐facing NADH dehydrogenase on/in the inner mitochondrial membrane (Siedow and Umbach, 1995). The plastidic NADH was also assumed to have free access to mitochondria, through the cytosol, via a plastidic NAD+/NADH shuttle. Hence, all the NADH that appeared on the right‐hand side of equations in Table can drive ATP production (from ADP and Pi) according to the stoichiometry:
YATP,cyt‐NADH = (1 – s)(cIII,IV H+III,IV)/(1 + H+ATP)(2)
where YATP,cyt‐NADH is the ratio of ATP formed per cytosolic NADH oxidized.
With parameter values as above, YATP,cyt‐NADH can range from 0 to 1·5 ATP formed per NADH oxidized. The minimum value would occur if either all protons pumped out of the mitochondrial matrix re‐entered the matrix through inner‐membrane leaks (i.e. s = 1) or if all electrons reducing ubiquinone were transferred to the alternative oxidase (i.e. cIII,IV = 0), both of which are unlikely. The maximum value of 1·5 ATP per NADH was used in this analysis except for one special case described later. All NADH involved is oxidized to NAD+. One‐half O2 is consumed, and 1 H2O is produced, per NADH oxidized.
ATP production from NADPH oxidation
In one case (i.e. 4‐coumaryl alcohol‐based lignin biosynthesis via tyrosine), net NADPH production occurred [eqn (S.29a) in Table ]. The NADPH was formed in a plastid and could gain access to the cytosol via an NADP+/NADPH shuttle. In this case, the NADPH could drive ATP production (from ADP and Pi) if it was oxidized by the cytosol‐facing NADPH dehydrogenase on/in the inner mitochondrial membrane, which may be the same enzyme that oxidizes cytosolic NADH. The stoichiometry is the same as that for cytosolic NADH oxidation:
YATP,cyt‐NADPH = (1 – s)(cIII,IV H+III,IV)/(1 + H+ATP)(3)
where YATP,cyt‐NADPH is the ratio of ATP formed per cytosolic NADPH oxidized.
The range of possible values is again 0 to 1·5 ATP per NADPH (as for NADH), and the maximum value of 1·5 ATP per NADPH was used in this analysis. All NADPH involved is oxidized to NADP+. One‐half O2 is consumed, and 1 H2O is produced, per NADPH oxidized.
NADPH production from sucrose catabolism
In all Table summary equations except eqns (S.29)–(S.31), NADPH is required as input for lignin biosynthesis. It is convenient to assume that such NADPH is produced by a closed cycle of the OPPP. Beginning with glucose 6‐P, operation of the OPPP in a closed cycle can be summarized as (see Beevers, 1961, p. 33):
6 glucose 6‐P + 12 NADP+ + 6 H2O → 5 glucose 6‐P + 12 NADPH + Pi + 6 CO2
The glucose 6‐P required as input can be produced from sucrose as summarized by the following:
0·5 sucrose + i ATP + 0·5(1 – i)PPi + 0·5 i H2O → glucose 6‐P + i ADP
where, as above, i is the fraction (0–1) of sucrose cleaved by invertase [the fraction (1–i) is cleaved by sucrose synthase] (see Fig. 1). By combining these two equations, net production of NADPH from sucrose can be written:
12 NADP+ + 0·5 sucrose + i ATP + 0·5(1 – i)PPi + (6 + 0·5 i)H2O → 12 NADPH + i ADP + Pi + 6 CO2
Thus, for every NADPH produced, 1/24 sucrose, i/12 ATP, (1 – i)/24 PPi and (0·5 + i/24) H2O are consumed. At the same time, i/12 ADP, 1/12 Pi and 0·5 CO2 are produced as by‐products.
NET SUCROSE INPUT PER UNIT LIGNIN FORMED
To estimate possible net stoichiometries between sucrose consumption and lignin biosynthesis, the values chosen above for YATP,sucrose, YATP,cyt‐NADH, YATP,cyt‐NADPH and YNADPH,sucrose were substituted into the summary equations in Table (Table ). The resulting ratios of sucrose consumed per unit of lignin formed varied between the three monolignols and between the pathways used to produce each monolignol and then add that monolignol to a growing lignin polymer [e.g. cf. eqns (S.39a) and (S.46b) in Table 7]. The most efficient reaction sets for lignin biosynthesis excluded the metabolic cost of monolignol transport to the apoplast and net metabolic cost of polymerization (aside from tool maintenance cost). In all cases, the conjectured tool maintenance costs were small fractions of total lignin biosynthesis costs. Depending on the monolignol involved, and the reaction set used for conversion of sucrose to lignin, between 0·975 and 1·724 mol sucrose were consumed per mole monolignol formed and then added to a growing lignin polymer (Table ). The sucrose requirement increased as the size of the monolignol (i.e. either 9, 10 or 11 carbon atoms) increased.
Table 7.
Ranges of net sucrose consumption for lignin biosynthesis according to reaction sets considered in this analysis (omitting exchanges of H2O)
| No.* | Summary equation | ‘RQ’ | C retention | Energy retention† | ||
| Using 4‐coumaryl alcohol (via tyrosine) | ||||||
| S.39a | 0·975 Sucrose + 1·450 O2 + ligninn + PPi | → | ligninn+1 + 2·700 CO2 + 2 Pi | 1·86 | 0·769 | 0·816 |
| S.39a′‡ | 1·000 Sucrose + 1·750 O2 + ligninn + PPi | → | ligninn+1 + 3·000 CO2 + 2 Pi | 1·71 | 0·750 | 0·796 |
| S.39b | 1·104 Sucrose + 3·000 O2 + ligninn + 4 Pi | → | ligninn+1 + 4·250 CO2 + 2 PPi | 1·42 | 0·679 | 0·721 |
| Using 4‐coumaryl alcohol (via phenylalanine) | ||||||
| S.40a | 1·025 Sucrose + 2·050 O2 + ligninn + PPi | → | ligninn+1 + 3·300 CO2 + 2 Pi | 1·61 | 0·732 | 0·777 |
| S.40b | 1·154 Sucrose + 3·600 O2 + ligninn + 4 Pi | → | ligninn+1 + 4·850 CO2 + 2 PPi | 1·35 | 0·650 | 0·690 |
| Using coniferyl alcohol (via tyrosine; SAM regeneration from serine) | ||||||
| S.41a | 1·183 Sucrose + 2·950 O2 + ligninn + 0·375 PPi | → | ligninn+1 + 4·200 CO2 + 0·75 Pi | 1·42 | 0·704 | 0·745 |
| S.41b | 1·354 Sucrose + 5·000 O2 + ligninn + 8 Pi | → | ligninn+1 + 6·250 CO2 + 4 PPi | 1·25 | 0·615 | 0·651 |
| Using coniferyl alcohol (via phenylalanine; SAM regeneration from serine) | ||||||
| S.42a | 1·268 Sucrose + 3·967 O2 + ligninn + 0·417 PPi | → | ligninn+1 + 5·217 CO2 + 0·833 Pi | 1·32 | 0·657 | 0·695 |
| S.42b | 1·439 Sucrose + 6·017 O2 + ligninn + 7·917 Pi | → | ligninn+1 + 7·267 CO2 + 3·958 PPi | 1·21 | 0·579 | 0·612 |
| Using coniferyl alcohol (via tyrosine; SAM regeneration from formate) | ||||||
| S.43a | 1·117 Sucrose + methanol + 3·658 O2 + ligninn + 0·021 PPi | → | ligninn+1 + 4·408 CO2 + 0·042 Pi | 1·21 | 0·694 | 0·703 |
| S.43b | 1·280 Sucrose + methanol + 5·608 O2 + ligninn + 7·958 Pi | → | ligninn+1 + 6·358 CO2 + 3·979 PPi | 1·13 | 0·611 | 0·622 |
| Using coniferyl alcohol (via phenylalanine; SAM regeneration from formate) | ||||||
| S.44a | 1·202 Sucrose + methanol + 4·675 O2 + ligninn + 0·063 PPi | → | ligninn+1 + 5·425 CO2 + 0·125 Pi | 1·16 | 0·648 | 0·659 |
| S.44b | 1·365 Sucrose + methanol + 6·625 O2 + ligninn + 7·875 Pi | → | ligninn+1 + 7·375 CO2 + 3·938 PPi | 1·11 | 0·575 | 0·587 |
| Using sinapyl alcohol (via tyrosine; SAM regeneration from serine) | ||||||
| S.45a | 1·426 Sucrose + 4·867 O2 + ligninn + 0·417 Pi | → | ligninn+1 + 6·117 CO2 + 0·208 PPi | 1·26 | 0·643 | 0·678 |
| S.45b | 1·639 Sucrose + 7·417 O2 + ligninn + 11·917 Pi | → | ligninn+1 + 8·667 CO2 + 5·958 PPi | 1·17 | 0·559 | 0·589 |
| Using sinapyl alcohol (via phenylalanine; SAM regeneration from serine) | ||||||
| S.46a | 1·511 Sucrose + 5·883 O2 + ligninn + 0·333 Pi | → | ligninn+1 + 7·133 CO2 + 0·167 PPi | 1·21 | 0·607 | 0·639 |
| S.46b | 1·724 Sucrose + 8·433 O2 + ligninn + 11·833 Pi | → | ligninn+1 + 9·683 CO2 + 5·917 PPi | 1·15 | 0·532 | 0·560 |
| Using sinapyl alcohol (via tyrosine; SAM regeneration from formate) | ||||||
| S.47a | 1·294 Sucrose + 2 methanol + 6·283 O2 + ligninn + 1·833 Pi | → | ligninn+1 + 6·533 CO2 + 0·917 PPi | 1·04 | 0·628 | 0·617 |
| S.47b | 1·490 Sucrose + 2 methanol + 8·633 O2 + ligninn + 11·833 Pi | → | ligninn+1 + 8·883 CO2 + 5·917 PPi | 1·03 | 0·553 | 0·549 |
| Using sinapyl alcohol (via phenylalanine; SAM regeneration from formate) | ||||||
| S.48a | 1·379 Sucrose + 2 methanol + 7·300 O2 + ligninn + 1·750 Pi | → | ligninn+1 + 7·550 CO2 + 0·875 PPi | 1·03 | 0·593 | 0·586 |
| S.48b | 1·575 Sucrose + 2 methanol + 9·650 O2 + ligninn + 11·750 Pi | → | ligninn+1 + 9·900 CO2 + 5·875 PPi | 1·03 | 0·526 | 0·523 |
These equations correspond to the summary equations in Table 6. Equation numbers with suffix ‘a’ indicate most efficient pathways, whereas summary equations with suffix ‘b’ indicate least efficient pathways, for reaction sets shown in Figs 1–5. ‘Ligninn’ indicates a lignin polymer composed of n monolignol residues. PPi is assumed to be freely available when shown as an input. When net PPi production occurs, some additional carbon and energy retention may occur at the whole plant level if that PPi is usefully used (e.g. in the place of ATP for active transport processes). All input requirements (or net production) of ATP, NADH, and NADPH were converted to appropriate inputs of sucrose and O2 and outputs of CO2. ‘RQ’ is the ratio of CO2 released : O2 consumed, and is analogous to respiratory quotient.
* Summary equation numbers (No.) are used elsewhere in analysis.
† Based on heats of combustion of 5·641, 0·7645, 4·49, 4·97 and 5·45 MJ mol–1 for sucrose, methanol, hydroxyphenyl residue, guaiacyl residue and syringyl residue, respectively (Table 1).
‡ Net NAD(P)H produced in excess of that needed to produce ATP was oxidized by the alternative oxidase (i.e. without H+ translocation across the inner membranes of mitochondria and the opportunity for ATP synthesis).
For lignin derived from 4‐coumaryl alcohol and coniferyl alcohol, the most efficient reaction sets for biosynthesis included PPi inputs (all reactions sets involving sinapyl alcohol were net producers of PPi). For these reaction sets to be valid, PPi must be ‘freely’ available from other areas of metabolism. If it is not, small additional inputs of ATP (and therefore sucrose) would be required.
One special case was the ‘overproduction’ of ATP from an excess of NADH and NADPH production [eqn (S.29a) in Table ]. Specifically, the NADH and NADPH produced by that reaction set supplied more ATP than was needed by the reaction set. In that case, the ‘extra’ ATP was converted back to sucrose and subtracted from the sucrose input requirement. This does not imply that the extra ATP was used to produce sucrose, but rather that the extra ATP could be used in other biosynthetic reactions at the same place and time (including production of other monolignols) and those other reactions would therefore require less sucrose. This might be important when concomitant biosynthesis of several macromolecules is considered (see Penning de Vries et al., 1974). But if a general excess of NAD(P)H production occurs (which may be unlikely; Penning de Vries et al., 1974), engagement of the alternative oxidase or other changes in respiration, such as increased passive proton leakage through the inner mitochondrial membrane or engagement of the matrix NADH dehydrogenase bypassing Complex I, could operate to oxidize NAD(P)H with reduced yield of ATP, thus reducing values of YATP,sucrose, YATP,cyt‐NADH and YATP,cyt‐NADPH. In that case, the sucrose requirement for lignin biosynthesis from 4‐coumaryl alcohol via tyrosine increased from 0·975 sucrose per lignin residue [eqn (S.39a)] to 1·000 sucrose per lignin residue [eqn (S.39a′)].
The fraction of carbon in the substrate (either sucrose or sucrose plus methanol) used for lignin biosynthesis that was retained in the resulting lignin was estimated directly from carbon contents of sucrose (and methanol) and hydroxyphenyl, guaiacyl and syringyl residues in lignin. That fraction declined as the number of carbon atoms in the lignin residue increased from nine to 11 when using the most efficient reaction sets (Fig. 7; Table ). The same result occurred when least efficient reaction sets were used (Fig. 8; Table ). When lignin was produced from sucrose only (no methanol input), and most efficient reaction sets were used, the energy retention during biosynthesis was significantly greater than the carbon retention (Fig. 7), but this difference was reduced when SAM regeneration involved formate derived from methanol (Table ). Lignin biosynthesis was potentially less efficient when both sucrose and methanol were used as substrates (compared with using only sucrose), but the use of methanol reflected the recovery or retention of carbon that would otherwise presumably have been lost from the plant to the atmosphere. That recovery of methanol would therefore reduce total photosynthesis needed to synthesize a unit of lignin (i.e. a smaller sucrose input would be needed even though the total carbon input is greater). Determination of whether sufficient methanol could be available to meet a significant fraction of the SAM regeneration needed for lignin biosynthesis in a given plant is beyond the scope of this study. Assuming efficient respiration and accounting for different pathways that could be used to synthesize monolignols and then add them to a growing lignin polymer, between 52·6 and 76·9 % of the carbon in the substrate(s) of lignin biosynthesis was retained in the end product (Table ). The range for energy retention was even larger, at between 52·3 and 81·6 % (Table ).

Fig. 7. Efficiency of biosynthesis of fractions of lignins associated with the three main monolignol residues containing nine (hydroxyphenol), 10 (guaiacyl) or 11 (syringyl) carbon atoms per residue when the most efficient reaction sets of biosynthesis were used. Efficiency was quantified by the retention of carbon (solid lines) and energy (dashed lines) in lignin per unit carbon (or energy) contained in the sucrose substrate of lignin biosynthesis (Table 7) (reaction sets including methanol as cosubstrate were not considered here). Energy retention was larger than carbon retention because lignins are more reduced (more energy per carbon atom) than sucrose. All calculations were based on YATP,sucrose = 60 ATP per sucrose, YATP,cyt‐NADH = 1·5 ATP formed per NADH oxidized, and YATP,cyt‐NADPH = 1·5 ATP formed per NADPH oxidized.

Fig. 8. Efficiency of biosynthesis of fractions of lignins associated with the three main monolignol residues containing nine (hydroxyphenol), 10 (guaiacyl) or 11 (syringyl) carbon atoms per residue when the most efficient (solid lines) and the least efficient (dashed lines) reaction sets of biosynthesis were compared. Efficiency was quantified by the retention of carbon in lignin per unit carbon contained in the sucrose substrate of lignin biosynthesis (Table 7) (reaction sets including methanol as cosubstrate were not considered here). All calculations were based on YATP,sucrose = 60 ATP per sucrose, YATP,cyt‐NADH = 1·5 ATP formed per NADH oxidized, and YATP,cyt‐NADPH = 1·5 ATP formed per NADPH oxidized.
DISCUSSION
Lignins are expensive to synthesize from sucrose. They are more reduced than other major fractions of phytomass (which is reflected in their high carbon concentrations; Table ) and the biosynthesis of coniferyl and sinapyl alcohols involves one and two methoxylation reactions, respectively, which in turn involve inputs of carbon and energy.
No single ratio of sucrose consumed per unit lignin formed can be derived from present knowledge because: (1) lignins are composed of variable mixtures of monolignols; (2) different pathways with different metabolic requirements can produce each of the three main monolignols; (3) different possibilities for monolignol storage, mechanisms of monolignol transport to apoplast and polymerization reactions required to add monolignols to growing lignin polymers exist; and (4) there may be considerable flexibility in efficiency of respiration supplying ATP and NADPH needed for lignin biosynthesis. As a result, even if the efficiency of respiration were constant, the ranges of the fraction of carbon (or energy) in the substrates of lignin biosynthesis that can be retained in the end product (a lignin polymer) are large. This implies that before estimates of the substrate requirement of lignin biosynthesis can be applied to any particular circumstance, information about the composition of the lignin involved, and the pathways used to synthesize that lignin, must be obtained. For example, based on the reaction sets considered in this analysis, the possible efficiency of lignin biosynthesis from coniferyl alcohol (derived exclusively from sucrose via phenylalanine, and with efficient respiration) would be somewhere within the range 0·579–0·657 mol C (mol C)–1 (Table ), but from available measurements of plant growth, composition and respiration, it would be impossible to determine where inside that range actual plant lignin biosynthesis from coniferyl alcohol occurs, or even if it occurs within that range at all. Nonetheless, clear differences in potential efficiency of lignin biosynthesis from each of the three main monolignols are apparent (Figs 7 and 8).
If other factors are equal, the efficiency of producing lignin is greater via tyrosine than it is via phenylalanine (Figs 7 and 8). The tyrosine pathway appears to be limited to monocots, but if it could be introduced into other plants then the efficiency of their lignin biosynthesis might be improved. For example, the maximum efficiency of lignin biosynthesis from coniferyl alcohol (derived from sucrose only) via tyrosine is more than 7 % greater in terms of both carbon retention and energy retention than it is via phenylalanine (Table ). The unanswered question is: why do only monocots take advantage of this considerable increase in the amount of lignin that can be produced from a unit of photosynthate?
Previously published estimates of the cost of lignin biosynthesis
Four estimates of the mass of glucose required to synthesize 1·0 g lignin (i.e. the ‘glucose requirement’) composed mainly of guaiacyl residues were published between 1974 and 1984, with values ranging from 1·897 to 2·320 g glucose g–1 lignin (Table ). Later, Williams et al. (1987) and Thornley and Johnson (1990) produced estimates for lignin synthesized from all three of the main monolignols, with an even larger range of values for guaiacyl‐based lignin (i.e. 1·811–2·488 g glucose g–1 lignin; Table ).
Table 8.
Prior and present estimates of substrate requirements for lignin biosynthesis in higher plants
| Glucose requirement [g glucose (g lignin)–1] | ||||
| Lignin residue: | ||||
| Hydroxyphenyl | Guaiacyl | Syringyl | Notes | Reference |
| Previously published estimates | ||||
| 2·104 | 1, 2, 3 | Penning de Vries et al. (1974) | ||
| 1·897* | 1, 2, 4 | Chung and Barnes (1977) | ||
| 2·119 | 1, 5 | Penning de Vries et al. (1983) | ||
| 2·320* | 1, 2, 4 | Merino et al. (1984) | ||
| 2·431 | 2·488 | 2·528 | 4, 6 | Williams et al. (1987) |
| 1·867 | 1·811 | 1·770 | 4, 6, 7 | Thornley and Johnson (1990) |
| 2·078 | 1·981 | 1·912 | 8 | Thornley and Johnson (1990) |
| This analysis with most efficient pathways of biosynthesis and options for polymerization, and high efficiency of respiration | ||||
| 2·353 | 2·377 | 2·454 | Via tyrosine, 9 | |
| 2·413 | Via tyrosine, 9, 10 | |||
| 2·473 | 2·547 | 2·600 | Via phenylalanine, 9 | |
| This analysis with least efficient pathways of biosynthesis and options for polymerization, but high efficiency of respiration | ||||
| 2·664 | 2·720 | 2·820 | Via tyrosine, 9 | |
| 2·784 | 2·891 | 2·967 | Via phenylalanine, 9 | |
Values shown are grams of glucose required for the biosynthesis of 1·0 g of lignin using the indicated lignin residues. For the present analysis, it was assumed that 1·0 mol sucrose is equivalent to 2·0 mol glucose (180 g mol–1) to provide direct comparisons between the present analysis and previous publications.
Notes:
(1) Based on 37 ATP produced during complete respiratory oxidation of 1 glucose (i.e. the equivalent of YATP,sucrose = 74 ATP per sucrose).
(2) Includes ATP cost of glucose import into a cell.
(3) Calculated from Table 6 in Penning de Vries et al. (1974), using the ratio 0·166 g glucose per 0·08 g lignin for carbon skeleton production (i.e. from ‘PV’ in Penning de Vries et al., 1974). The production of 0·00034 mol NADH during biosynthesis of 0·08 g lignin was assumed, and that such NADH was oxidized to produce 0·00102 mol ATP (i.e. YATP,cyt‐NADH = 3 ATP per NADH). The total ATP requirement for biosynthesis of 0·08 g lignin was 0·00150 mol, so an additional (i.e. in addition to that produced during oxidation of the NADH formed) 0·00048 mol ATP was needed from oxidation of glucose, meaning that an additional 0·002335 g glucose was oxidized to CO2 (assuming the ratio 37 ATP formed per glucose oxidized), for a total glucose requirement of 0·1683 g glucose per 0·08 g lignin.
(4) May exclude tool maintenance cost.
(5) Cost of glucose uptake into a cell was excluded to allow a direct comparison to present results.
(6) Based on 36 ATP produced during complete respiratory oxidation of 1 glucose (i.e. the equivalent of YATP,sucrose = 72 ATP per sucrose).
(7) Assumes that polymerization reactions produce NADH. Also, Thornley and Johnson (1990) added an oxygen atom to each alcohol monomer during polymerization rather than removing a hydrogen atom, so their estimates of the molecular masses of the lignin residues exceeds that shown in Table 1 and used in other analyses (e.g. in Williams et al., 1987).
(8) Recalculated from Thornley and Johnson (1990) based on lignin residue molecular masses in Table 1.
(9) Biosynthesis from sucrose only; no input of methanol. With YATP,sucrose = 60·0 ATP per sucrose, YATP,cyt‐NADH = 1·5 ATP per NADH, and YATP,cyt‐NADPH = 1·5 ATP per NADPH.
(10) NADH and NADPH produced in excess of that required to provide needed ATP was oxidized without producing ATP (i.e. oxidized via the alternative oxidase).
* Spruce lignin.
Williams et al. (1987) estimated that the mass‐based cost of lignin biosynthesis increased with molecular mass of the lignin monomer, whereas Thornley and Johnson (1990) calculated that the mass‐based cost of biosynthesis decreased with increasing monomer molecular mass (Table ). The present analysis indicates that the mass‐based cost does increase with increasing molecular mass of the monomer, in agreement with the result of Williams et al. (1987).
This analysis differs from all previously published values of the cost of synthesizing lignin because up‐to‐date considerations of the efficiency of ATP production in respiration were used. This resulted in a smaller amount of ATP produced from ADP and Pi per unit of sucrose (or glucose) oxidized. In addition, different reactions were used in the present analysis to regenerate glutamate and assimilate NH3 compared with those used in previous analyses, and estimates of tool maintenance costs were made explicit in the present analysis. The present analysis also explicitly compared costs of lignin biosynthesis via tyrosine vs. phenylalanine. Moreover, it considered alternative pathways and reactions of SAM regeneration and lignin storage, transport and polymerization. All these factors contributed to differences in results between the present and previous studies. In addition, the present analysis produced a range of estimates, rather than a single value, for the cost of lignin biosynthesis for each monolignol.
According to the present analysis, glucose requirements for lignin biosynthesis (based on an equivalency of 2 glucose per sucrose) using the most efficient pathways thought to be associated with lignin biosynthesis were similar to glucose requirements estimated by Williams et al. (1987) (Table ). This was the case in spite of a number of improvements in the present analysis, including lower values of YATP,sucrose (or the ‘equivalent’ yield of ATP from glucose oxidation) and the use of GS/GOGAT instead of GDH to regenerate glutamate from 2‐oxoglutarate and NH3. Costs of tool maintenance (though speculative) and polymerization were included in the present analysis, but were apparently excluded from the analysis of Williams et al. (1987). The present analysis also explicitly compared substrate requirements for lignin biosynthesis via phenylalanine with tyrosine, whereas Williams et al. (1987) stated that ‘values for alternate pathways were averaged’, but did not specify whether both pathways were considered for lignin biosynthesis, or whether only the phenylalanine pathway was used.
In contrast to the general agreement between the end result of the present analysis and the results of Williams et al. (1987), glucose requirements for lignin biosynthesis derived from the present study were considerably larger than values given by Thornley and Johnson (1990), even after comparing results on the basis of identical monolignol residues (Table ). Thornley and Johnson (1990) assumed that monolignol polymerization produced NADH (one per monomer residue), whereas the present analysis assumed that in the most efficient case polymerization neither produced nor consumed NADH. In less efficient, but physiologically possible and perhaps probable cases, the present analysis implied that polymerization requires input of NADH and/or ATP, which increases the overall cost of lignin biosynthesis compared with the calculations of Thornley and Johnson (1990). The inclusion of tool maintenance costs in this analysis accounted for only a small part of the difference between the present estimates and those of Thornley and Johnson (1990). The large differences between results of the present analysis and those of Thornley and Johnson (1990) that occurred for guaiacyl‐ and syringyl‐based lignins (Table ) were due, in the most part, to what may have been overly efficient methoxylation reactions assumed by Thornley and Johnson (1990). In particular, glucose requirements for lignin biosynthesis (mass per mass) declined as the number of carbon atoms per lignin residue increased in the Thornley and Johnson (1990) analysis because they assumed that methoxylation resulted in a net production of reductant, with no ATP requirement, and the net gain in monolignol mass was greater than the increase in glucose requirement as monolignol size increased. In the present analysis, SAM regeneration required significant ATP input [eqns (S.25)–(S.28)], and the substrate requirements (their mass) for methoxylation exceeded the mass increase in monolignols resulting from methoxylation.
According to the present analysis, when the most costly (i.e. least efficient) pathways thought to be active in plants were used, glucose requirements for lignin biosynthesis were significantly larger than glucose requirements estimated in all previously published studies (Table ). The difference between present results based on most costly pathways and previous analyses may be important because the most costly pathways included in the present analysis were derived from reaction sets that are thought to occur in plants. The most costly reaction sets considered in the present analysis might therefore be as close, or closer, to actual (as opposed to minimum potential) costs of lignin biosynthesis in plants as the most efficient reaction sets considered.
Improving efficiency of lignin biosynthesis
This analysis indicates possibilities for improving the efficiency of lignin biosynthesis. Two approaches can be distinguished. One is to increase the fraction of lignin synthesized from p‐coumaryl alcohol (and coniferyl alcohol respective to sinapyl alcohol). The other is to improve the efficiency of producing a given monolignol and/or adding it to a growing lignin polymer.
Increasing the fraction of lignin derived from p‐coumaryl (and coniferyl) alcohol could be successful if the functioning of lignin is not reduced by such a change in composition. Data currently available do not allow a quantitative assessment of the relationship between lignin composition and function.
Increasing the potential efficiency of synthesizing a given monolignol would require a change in the pathways considered in this analysis, whereas a change in the actual efficiency might be obtained by changing actual pathways to the most efficient considered in this analysis if actual biosynthesis does not now follow the most efficient pathways considered herein.
One possibility for improving potential efficiency of lignin biosynthesis involves altering 2‐oxoglutarate recycling. As outlined above, 2‐oxoglutarate recycling is probably catalysed by GS/GOGAT, although GDH could potentially perform the same function more efficiently. For example, if GDH replaced GS/GOGAT during biosynthesis of coniferyl alcohol (via phenylalanine) and that monolignol was added to a growing lignin polymer, the potential efficiency of carbon retention associated with that monolignol would increase from 0·657 [see eqn (S.42a)] to 0·670 (a 2·0 % increase). In other terms, energy retention would increase from 0·695 to 0·709, and a requirement of 1·268 sucrose per coniferyl alcohol‐based monomer added to lignin would decline to 1·243 sucrose. These calculations involved replacing GS/GOGAT activity with GDH activity during biosynthesis of arogenate (Fig. 2) and serine (Fig. 6). Such an increase in efficiency of lignin biosynthesis (though small) might be obtained through bioengineering for activity of GDH in preference to GS/GOGAT for 2‐oxoglutarate recycling when secondary cell wall growth occurs. All other (i.e. non‐lignin) synthetic activities involving 2‐oxoglutarate recycling would also benefit from such bioengineering, at least from a biosynthetic efficiency viewpoint and as long as such GDH activity was free of detrimental consequences for plant growth and health.
Another possibility of a changed reaction contributing to improved potential efficiency of lignin biosynthesis would be the use of NADH rather than NADPH by 5,10‐methylene‐THF reductase (EC 1.5.1.20) (Fig. 4). In this analysis it was assumed that NADPH was used, but NADH could also be the reductant. When use of NADPH was replaced by NADH use, the efficiency of biosynthesis of coniferyl alcohol‐based lignin produced via phenylalanine and using serine to regenerate SAM increased from 0·657 to 0·666 mol C (mol C)–1 (slightly more than 1 %).
Because the actual pathways used during lignin biosynthesis (among the alternative pathways considered in this analysis) are unknown, it is currently impossible to estimate the scope for improvement in the efficiency of lignin biosynthesis by changing actual pathways to more efficient pathways included in Figs 1–4. One exception is lignin biosynthesis via the tyrosine pathway, which is presumably limited to monocots, compared with the phenylalanine pathway (Fig. 2). If use of the tyrosine pathway for lignin biosynthesis was introduced into non‐monocots, assuming that this was accomplished without detriment to the plant (e.g. through phenylalanine deficiency), lignin biosynthesis might be more efficient.
Lignin polymerization should be more efficient if catalysed by laccase compared with peroxidase (0·5 NADH per monolignol in this analysis). Thus, if peroxidase is involved in actual lignin polymerization, maximum efficiency might not be obtained, and a small gain in biosynthetic efficiency might be realized if plants were selected for laccase‐mediated polymerization.
Penning de Vries et al. (1974) noted that the efficiency of biosynthesis of ‘standard plant biomass’ is hardly affected by the P : O ratio (the number of ADP molecules phosphorylated per NADH molecule oxidized by mitochondria) in the range of two to three. In this analysis a comparison was made between biosynthetic efficiency with and without activity of the alternative oxidase. For example, for lignin biosynthesis summarized by eqn (S.42b) (Table ), which excludes any alternative pathway activity but which uses the most costly pathways of biosynthesis, carbon retention during lignin biosynthesis from sucrose was 57·9 %, and 1·439 mol sucrose were consumed per mole monolignol synthesized and added to a lignin polymer. (Effects of alternative oxidase activity on biosynthetic efficiency are larger, with more costly pathways of biosynthesis, compared with more efficient pathways of biosynthesis.) Using the same pathways of biosynthesis and respiration, but with all electrons in the respiratory chain transferred to the alternative oxidase (i.e. cIII,IV = 0, YATP,sucrose = 24 ATP per sucrose, YATP,cyt‐NADH = 0), carbon retention declined to 44·4 % and the sucrose requirement increased to 1·878 mol sucrose (mol monolignol)–1, an increase in sucrose requirement of nearly 31 %. Thus, alternative oxidase activity had a larger effect on YATP,sucrose and YATP,cyt‐NADH than on efficiency of lignin biosynthesis, though the effect on biosynthesis was considerable.
CONCLUSIONS
Present theoretical (biochemical pathway‐based) estimates of the efficiency of lignin biosynthesis are less than most previously published values (i.e. the cost of producing lignin may exceed previously published estimates). The present analysis indicates that a broad range of possible efficiencies of lignin biosynthesis exists; there may be no general value of the ‘cost’ of lignin biosynthesis. The relative in situ activity of alternative reactions and pathways potentially associated with lignin biosynthesis will need to be better characterized before more precise (or more certain) values than those derived in the present study can be given for the efficiency of lignin biosynthesis. Until that time, the ranges of values associated with each monolignol derived in this analysis, accounting for the possible activity of the tyrosine pathway in monocots but not in other plants, will need to be used. Such use should be judicious when applied to quantitative estimates of plant growth costs or respiration (i.e. CO2 release or O2 uptake) amounts associated with lignin biosynthesis.
ACKNOWLEDGEMENTS
Paul Hanson lent a Macintosh computer to draw pathways and personally finalized Fig. 2, Helen Miller helped in the library, and the US Department of Energy’s Office of Science (BER) provided partial financial support. The views expressed are those of the author, not those of the US Government.
Supplementary Material
Received: 25 October 2002; Returned for revision: 15 December 2002; Accepted: 25 January 2003 Published electronically: 28 March 2003
References
- AgarwalUP, Atalla RH.1986. In‐situ microprobe studies of plant cell walls: macromolecular organization and compositional variability in the secondary wall of Picea mariana (Mill.) B.S.P. Planta 169: 325–332. [DOI] [PubMed] [Google Scholar]
- AmthorJS.1994. Respiration and carbon assimilate use. In: Boote KJ, Bennett JM, Sinclair TR, Paulsen GM, eds. Physiology and determination of crop yield Madison: American Society of Agronomy, 221–250. [Google Scholar]
- AmthorJS.2000. The McCree–de Wit–Penning de Vries–Thornley respiration paradigms: 30 years later. Annals of Botany 86: 1–20. [Google Scholar]
- ap ReesT.1985. The organization of glycolysis and the oxidative pentose phosphate pathway in plants. In: Douce R, Day DA, eds. Encyclopedia of plant physiology, new series, volume 18 Berlin: Springer‐Verlag, 391–417. [Google Scholar]
- ap ReesT.1988. Hexose phosphate metabolism by nonphotosynthetic tissues of higher plants. In: Preiss J, ed. The biochemistry of plants, volume 14 San Diego: Academic Press, 1–33. [Google Scholar]
- BeeversH.1961. Respiratory metabolism in plants. New York: Harper & Row. [Google Scholar]
- BoudetAM, Lapierre C, Grima‐Pettenati J.1995. Biochemistry and molecular biology of lignification. New Phytologist 129: 203–236. [DOI] [PubMed] [Google Scholar]
- BoyerPD.1993. The binding change mechanism for ATP synthase – some probabilities and possibilities. Biochimica et Biophysica Acta 1140: 215–250. [DOI] [PubMed] [Google Scholar]
- BraunsFE.1952. The chemistry of lignin. New York: Academic Press. [Google Scholar]
- CampbellMM, Sederoff RR.1996. Variation in lignin content and composition. Plant Physiology 110: 3–13. [DOI] [PMC free article] [PubMed] [Google Scholar]
- CarpitaNC.1996. Structure and biogenesis of the cell walls of grasses. Annual Review of Plant Physiology and Plant Molecular Biology 47: 445–476. [DOI] [PubMed] [Google Scholar]
- ChenF, Yasuda S, Fukushima K.1999. Evidence for a novel biosynthetic pathway that regulates the ratio of syringyl to guaiacyl residues in lignin in the differentiating xylem of Magnolia kobus DC. Planta 207: 597–603. [Google Scholar]
- ChenL, Chan SY, Cossins EA.1997. Distribution of folate derivatives and enzymes for synthesis of 10‐formyltetrahydrofolate in cytosolic and mitochondrial fractions of pea leaves. Plant Physiology 115: 299–309. [DOI] [PMC free article] [PubMed] [Google Scholar]
- ChungH‐H, Barnes RL.1977. Photosynthate allocation in Pinus taeda. I. Substrate requirements for synthesis of shoot biomass. Canadian Journal of Forest Research 7: 106–111. [Google Scholar]
- CipolliniDF Jr.1997. Wind‐induced mechanical stimulation increases pest resistance in common bean. Oecologia 111: 84–90. [DOI] [PubMed] [Google Scholar]
- Colas des Francs‐SmallC, Ambard‐Bretteville F, Small ID, Rémy R.1993. Identification of a major soluble protein in mitochondria from nonphotosynthetic tissues as NAD‐dependent formate dehydrogenase. Plant Physiology 102: 1171–1177. [DOI] [PMC free article] [PubMed] [Google Scholar]
- CopelandL, Turner JF.1987. The regulation of glycolysis and the pentose phosphate pathway. In: Davies DD, ed. The biochemistry of plants, volume 11 San Diego: Academic Press, 107–128. [Google Scholar]
- CossinsEA.1987. Folate biochemistry and the metabolism of one‐carbon units. In: Davies DD, ed. The biochemistry of plants, volume 11 San Diego: Academic Press, 317–353. [Google Scholar]
- CossinsEA, Chen L.1997. Folates and one‐carbon metabolism in plants and fungi. Phytochemistry 45: 437–452. [DOI] [PubMed] [Google Scholar]
- DancerJE, ap Rees T.1989. Effects of 2,4‐dinitrophenol and anoxia on the inorganic‐pyrophosphate content of the spadix of Arum maculatum and the root apices of Pisum sativum Planta 178: 421–424. [DOI] [PubMed] [Google Scholar]
- DaviesJM.1997. Vacuolar energization: pumps, shunts and stress. Journal of Experimental Botany 48: 633–641. [Google Scholar]
- DaviesJM, Darley CP, Sanders D.1997. Energetics of the plasma membrane pyrophosphatase. Trends in Plant Science 2: 9–10. [Google Scholar]
- DebnamPM, Emes MJ.1999. Subcellular distribution of enzymes of the oxidative pentose phosphate pathway in root and leaf tissues. Journal of Experimental Botany 50: 1653–1661. [Google Scholar]
- de WitCT, Brouwer R, Penning de Vries FWT.1970. The simulation of photosynthetic systems. In: Setlik I, ed. Prediction and measurement of photosynthetic productivity Wageningen: Centre for Agricultural Publishing and Documentation (Pudoc), 47–70. [Google Scholar]
- de WitCTet al. 1978. Simulation of assimilation, respiration and transpiration of crops. New York: John Wiley & Sons. [Google Scholar]
- DharmawardhanaDP, Ellis BE, Carlson JE.1995. A β‐glucosidase from lodgepole pine xylem specific for the lignin precursor coniferin. Plant Physiology 107: 331–339. [DOI] [PMC free article] [PubMed] [Google Scholar]
- DomalskiES.1972. Selected values of heats of combustion and heats of formation of organic compounds containing the elements C, H, N, O, P, and S. Journal of Physical and Chemical Reference Data 1: 221–277. [Google Scholar]
- DomalskiES, Jobe TL Jr, Milne TA.1987. Thermodynamic data for biomass materials and waste components. New York: American Society of Mechanical Engineers. [Google Scholar]
- EberhardJ, Bischoff M, Raesecke HR, Amrhein N, Schmid J.1996a. Isolation of a cDNA from tomato coding for an unregulated, cytosolic chorismate mutase. Plant Molecular Biology 31: 917–922. [DOI] [PubMed] [Google Scholar]
- EberhardJ, Ehrler TT, Epple P, Felix G, Raesecke HR, Amrhein N, Schmid J.1996b. Cytosolic and plastidic chorismate mutase isozymes from Arabidopsis thaliana: molecular characterization and enzymatic properties. Plant Journal 10: 815–821. [DOI] [PubMed] [Google Scholar]
- EckardtNA.2002. Probing the mysteries of lignin biosynthesis: the crystal structure of caffeic acid/5‐hydroxyferulic acid 3/5‐O‐methyltransferase provides new insights. Plant Cell 14: 1185–1189. [DOI] [PMC free article] [PubMed] [Google Scholar]
- ElstnerEF.1987. Metabolism of activated oxygen species. In: Davies DD, ed. The biochemistry of plants, volume 11 San Diego: Academic Press, 253–315. [Google Scholar]
- FallR, Benson AA.1996. Leaf methanol – the simplest natural product from plants. Trends in Plant Science 1: 296–301. [Google Scholar]
- GavnholtB, Larsen K.2002. Molecular biology of plant laccases in relation to lignin formation. Physiologia Plantarum 116: 273–280. [Google Scholar]
- GoodwinTW, Mercer EI.1983. Introduction to plant biochemistry. Oxford: Pergamon Press. [Google Scholar]
- GrahamLE.1993. Origin of land plants. New York: John Wiley & Sons. [Google Scholar]
- GuoD, Chen F, Inoue K, Blount JW, Dixon RA.2001. Downregulation of caffeic acid 3‐O‐methyltransferase and caffeoyl CoA 3‐O‐methyltransferase in transgenic alfalfa: impacts on lignin structure and implications for the biosynthesis of G and S lignin. Plant Cell 13: 73–88. [DOI] [PMC free article] [PubMed] [Google Scholar]
- HarauxF, de Kouchkovsky Y.1998. Energy coupling and ATP synthase. Photosynthesis Research 57: 231–251. [Google Scholar]
- HeldtH‐W.1997. Plant biochemistry and molecular biology. Oxford: Oxford University Press. [Google Scholar]
- HerrmannKM, Weaver LM.1999. The shikimate pathway. Annual Review of Plant Physiology and Plant Molecular Biology 50: 473–503. [DOI] [PubMed] [Google Scholar]
- HiguchiT.1985. Biosynthesis of lignin. In: Higuchi T, ed. Biosynthesis and biodegradation of wood components Orlando: Academic Press, 141–160. [Google Scholar]
- HiguchiT.1997. Biochemistry and molecular biology of wood. Berlin: Springer‐Verlag. [Google Scholar]
- Hourton‐CabassaC, Ambard‐Bretteville F, Moreau F, Davy de Viriville J, Rémy R, Colas des Francs‐Small C.1998. Stress induction of mitochondrial formate dehydrogenase in potato leaves. Plant Physiology 116: 627–635. [DOI] [PMC free article] [PubMed] [Google Scholar]
- HughesJW, Fahey TJ.1991. Availability, quality, and selection of browse by white‐tailed deer after clearcutting. Forest Science 37: 261–270. [Google Scholar]
- IgamberdievAU, Bykova NV, Kleczkowski LA.1999. Origins and metabolism of formate in higher plants. Plant Physiology and Biochemistry 37: 503–513. [Google Scholar]
- LamH‐M, Coschigano KT, Oliveira IC, Melo‐Oliveira R, Coruzzi GM.1996. The molecular‐genetics of nitrogen assimilation into amino acids in higher plants. Annual Review of Plant Physiology and Plant Molecular Biology 47: 569–593. [DOI] [PubMed] [Google Scholar]
- LeaPJ, Robinson SA, Stewart GR.1990. The enzymology and metabolism of glutamine, glutamate, and asparagine. In: Miflin BJ, Lea PJ, eds. The biochemistry of plants, volume 16 San Diego: Academic Press, 121–159. [Google Scholar]
- Le Floc’hF, Faye F.1995. Metabolic fate of adenosine and purine metabolism enzymes in young plants of peach tree. Journal of Plant Physiology 145: 398–404. [Google Scholar]
- LeinhosV, Savidge RA.1993. Isolation of protoplasts from developing xylem of Pinus banksiana and Pinus strobus Canadian Journal of Forest Research 23: 343–348. [Google Scholar]
- LiL, Cheng XF, Leshkevich J, Umezawa T, Harding SA, Chiang VL.2001. The last step of syringyl monolignol biosynthesis in angiosperms is regulated by a novel gene encoding sinapyl alcohol dehydrogenase. Plant Cell 13: 1567–1585. [DOI] [PMC free article] [PubMed] [Google Scholar]
- LucknerM.1990. Secondary metabolism in microorganisms, plants, and animals. 3rd edn. New York: Springer‐Verlag. [Google Scholar]
- MerinoJ, Field C, Mooney HA.1984. Construction and maintenance costs of mediterranean‐climate evergreen and deciduous leaves. Acta Oecologica 5: 211–229. [DOI] [PubMed] [Google Scholar]
- MichalG.1999. Biochemical pathways: an atlas of biochemistry and molecular biology. New York: John Wiley & Sons. [Google Scholar]
- MicheliF.2001. Pectin methylesterases: cell wall enzymes with important roles in plant physiology. Trends in Plant Science 6: 414–419. [DOI] [PubMed] [Google Scholar]
- MiflinBJ, Habash DZ.2002. The role of glutamine synthetase and glutamate dehydrogenase in nitrogen assimilation and possibilities for improvement in the nitrogen utilization of crops. Journal of Experimental Botany 53: 979–987. [DOI] [PubMed] [Google Scholar]
- MobleyEM, Kunkel BN, Keith B.1999. Identification, characterization and comparative analysis of a novel chorismate mutase gene in Arabidopsis thaliana Gene 240: 115–123. [DOI] [PubMed] [Google Scholar]
- MurpheyWK, Masters KR.1978. Gross heat of combustion of northern red oak (Quercus rubra L.) chemical components. Wood Science 10: 139–141. [Google Scholar]
- NichollsDG, Ferguson SJ.1992. Bioenergetics 2. London: Academic Press. [Google Scholar]
- NoseM, Bernards MA, Furlan M, Zajicek J, Eberhardt TL, Lewis NG.1995. Towards the specification of consecutive steps in macromolecular lignin assembly. Phytochemistry 39: 71–79. [DOI] [PubMed] [Google Scholar]
- ObendorfRL, Koch JL, Gorecki RJ, Amable RA, Aveni MT.1990. Methanol accumulation in maturing seeds. Journal of Experimental Botany 41: 489–495. [Google Scholar]
- ÖnnerudH, Zhang L, Gellerstedt G, Henriksson G.2002. Polymerization of monolignols by redox shuttle–mediated enzymatic oxidation: a new model in lignin biosynthesis I. Plant Cell 14: 1953–1962 [DOI] [PMC free article] [PubMed] [Google Scholar]
- Penning de VriesFWT, Brunsting AHM, Van Laar HH.1974. Products, requirements and efficiency of biosynthesis: a quantitative approach. Journal of Theoretical Biology 45: 339–377. [DOI] [PubMed] [Google Scholar]
- Penning de VriesFWT, Van Laar HH, Chardon MCM.1983. Bioenergetics of growth of seeds, fruits, and storage organs. In: Smith WH, Banta SJ, eds. Potential productivity of field crops under different environments Los Baños, Philippines: International Rice Research Institute, 37–59. [Google Scholar]
- Penning de VriesFWT, Jansen DM, ten Berge HFM, Bakema A.1989. Simulation of ecophysiological processes of growth in several annual crops. Wageningen: Centre for Agricultural Publishing and Documentation (Pudoc). [Google Scholar]
- PlaxtonWC.1996. The organization and regulation of plant glycolysis. Annual Review of Plant Physiology and Plant Molecular Biology 47: 185–214. [DOI] [PubMed] [Google Scholar]
- PoorterH, Villar R.1997. The fate of acquired carbon in plants: chemical composition and construction costs. In: Bazzaz FA, Grace J, eds. Plant resource allocation San Diego: Academic Press, 39–72. [Google Scholar]
- Raiesi GahrooeeF.1998. Impacts of elevated atmospheric CO2 on litter quality, litter decomposability and nitrogen turnover rate of two oak species in a Mediterranean forest ecosystem. Global Change Biology 4: 667–677. [Google Scholar]
- RanochaP, McDougall G, Hawkins S, Sterjiades R, Borderies G, Stewart D, Cabanes‐Macheteau M, Boudet A‐M, Goffner D.1999. Biochemical characterization, molecular cloning and expression of laccases – a divergent gene family – in poplar. European Journal of Biochemistry 259: 485–495. [DOI] [PubMed] [Google Scholar]
- RatajczakR, Hinz G, Robinson DG.1999. Localization of pyrophosphatase in membranes of cauliflower inflorescence cells. Planta 208: 205–211. [DOI] [PubMed] [Google Scholar]
- RavanelS, Gakière B, Job D, Douce R.1998. The specific features of methionine biosynthesis and metabolism in plants. Proceedings of the National Academy of Sciences of the USA 95: 7805–7812. [DOI] [PMC free article] [PubMed] [Google Scholar]
- RazalRA, Ellis S, Singh S, Lewis NG, Towers GHN.1996. Nitrogen recycling in phenylpropanoid metabolism. Phytochemistry 41: 31–35. [Google Scholar]
- RichardsonA, Duncan J, McDougall GJ.2000. Oxidase activity in lignifying xylem of a taxonomically diverse range of trees: identification of a conifer laccase. Tree Physiology 20: 1039–1047. [DOI] [PubMed] [Google Scholar]
- RöslerJ, Krekel F, Amrhein N, Schmid J.1997. Maize phenylalanine ammonia‐lyase has tyrosine ammonia‐lyase activity. Plant Physiology 113: 175–179. [DOI] [PMC free article] [PubMed] [Google Scholar]
- RydholmSA.1967. The application of modern pulping chemistry to the design of processes and machinery. Pulp and Paper Magazine of Canada 68: T‐2–T‐15. [Google Scholar]
- SavidgeRA.1989. Coniferin, a biochemical indicator of commitment to tracheid differentiation in conifers. Canadian Journal of Botany 67: 2663–2668. [Google Scholar]
- SederoffRR, MacKay JJ, Ralph J, Hatfield RD.1999. Unexpected variation in lignin. Current Opinion in Plant Biology 2: 145–152. [DOI] [PubMed] [Google Scholar]
- ShafizadehF, DeGroot WF.1976. Combustion characteristics of cellulosic fuels. In: Shafizadeh F, Sarkanen KV, Tillman DA, eds. Thermal uses and properties of carbohydrates and lignins New York: Academic Press, 1–17. [Google Scholar]
- SiedowJN, Umbach AL.1995. Plant mitochondrial electron transfer and molecular biology. Plant Cell 7: 821–831. [DOI] [PMC free article] [PubMed] [Google Scholar]
- SommerS, Heide L.1998. Expression of bacterial chorismate pyruvate‐lyase in tobacco: evidence for the presence of chorismate in the plant cytosol. Plant and Cell Physiology 39: 1240–1244. [DOI] [PubMed] [Google Scholar]
- SterjiadesR, Dean JFD, Gamble G, Himmelsbach DS, Eriksson K‐EL.1993. Extracellular laccases and peroxidases from sycamore maple (Acer pseudoplatanus) cell‐suspension cultures. Planta 190: 75–87. [Google Scholar]
- StryerL.1981. Biochemistry. 2nd edn. San Francisco: W.H. Freeman and Company. [Google Scholar]
- StryerL.1995. Biochemistry. 4th edn. New York: W.H. Freeman and Company. [Google Scholar]
- ThornleyJHM, Johnson IR.1990. Plant and crop modelling. Oxford: Oxford University Press. [Google Scholar]
- TorresJC, Guixe V, Babul J.1995. A new method of assessing rates of the futile cycle during glycolytic and gluconeogenic metabolism. Archives of Biochemistry and Biophysics 321: 517–525. [DOI] [PubMed] [Google Scholar]
- WeinerH, Stitt M, Heldt HW.1987. Subcellular compartmentation of pyrophosphate and alkaline pyrophosphatase in leaves. Biochimica et Biophysica Acta 893: 13–21. [Google Scholar]
- WhettenR, Sederoff R.1995. Lignin biosynthesis. Plant Cell 7: 1001–1013. [DOI] [PMC free article] [PubMed] [Google Scholar]
- WhettenRW, MacKay JJ, Sederoff RR.1998. Recent advances in understanding lignin biosynthesis. Annual Review of Plant Physiology and Plant Molecular Biology 49: 585–609. [DOI] [PubMed] [Google Scholar]
- WilliamsK, Percival F, Merino J, Mooney HA.1987. Estimation of tissue construction cost from heat of combustion and organic nitrogen content. Plant, Cell and Environment 10: 725–734. [Google Scholar]
- YaropolovAI, Skorobogat’ko OV, Vartanov SS, Varfolomeyev SD.1994. Laccase: properties, catalytic mechanism, and applicability. Applied Biochemistry and Biotechnology 49: 257–280. [Google Scholar]
- ZhongR, Morrison WH III, Negrel J, Ye Z‐H.1998. Dual methylation pathways in lignin biosynthesis. Plant Cell 10: 2033–2045. [DOI] [PMC free article] [PubMed] [Google Scholar]
- ZieglerH.1975. Nature of transported substances. In: Zimmermann MH, Milburn JA, eds. Encyclopedia of plant physiology, new series, volume 1 Berlin: Springer‐Verlag, 59–100. [Google Scholar]
- ZimmermannMH, Ziegler H.1975. List of sugars and sugar alcohols in sieve‐tube exudates. In: Zimmermann MH, Milburn JA, eds. Encyclopedia of plant physiology, new series, volume 1 Berlin: Springer‐Verlag, 480–503. [Google Scholar]
Associated Data
This section collects any data citations, data availability statements, or supplementary materials included in this article.