Abstract
Chlorophyll‐fluorescence and infrared gas analyser measurements show saturation of photosynthetic electron flow and CO2 uptake at generally lower irradiances in Hymenophyllum tunbrigense than in H. wilsonii, but with wide variation in both species (63–189 µmol m–2 s–1 PPFD in H. tunbrigense, 129–552 µmol m–2 s–1 PPFD in H. wilsonii), probably related to both site and season. Non‐photochemical quenching (at 400 µmol m–2 s–1 PPFD) ranged from 2·1 to 8·1, with no significant difference between the species. Pressure–volume curves from thermocouple‐psychrometer measurements give full‐turgor osmotic potentials of approx. –1·4 MPa in both species, and indicate low apoplast fractions and high cell‐wall elastic moduli. Leaves of H. tunbrigense recovered within 24 h from up to 7 d desiccation at water potentials ranging from –40 MPa (74 % relative humidity, RH) to –220 MPa (20 % RH); after 15 or 30 d, desiccation recovery was slower and less complete, and leaves were severely damaged at the highest and lowest humidities. Hymenophyllum wilsonii recovered well from up to 30 d desiccation at –114 and –220 MPa, but at –40 MPa it showed signs of damage after 15 d, and was severely damaged or killed after 30 d. Results are discussed in relation to the ecological and geographical distributions of the two species, and to the adaptive strategies of filmy ferns in general.
Key words: Chlorophyll fluorescence, desiccation tolerance, filmy ferns, Hymenophyllaceae, Hymenophyllum, light responses, osmotic potential, P–V curves, pressure–volume curves
INTRODUCTION
The Hymenophyllaceae (filmy ferns) are attractive and well‐known plants, most abundant in humid tropical forests, but extending in humid shady habitats into temperate regions, where two species of Hymenophyllum and one of Trichomanes reach western Europe. They have a substantial literature, largely morphological, taxonomic, floristic and ecological, including a Biological Flora account of the two Hymenophyllum species that occur in Britain and Ireland (Richards and Evans, 1972). Several authors have remarked on the similarities between the Hymenophyllaceae and bryophytes in terms of structure and ecological adaptation (Shreve, 1911; Eames, 1936; Smith, 1938; Page, 1997). Hymenophyllaceae are generally perceived as plants of constantly moist, deeply shaded places, but the ability of some species to tolerate desiccation and, in some cases, direct sunshine has been remarked upon by Shreve (1911), Holloway (1923a) and others. The physiology of these plants has received rather little attention. There is general agreement that water is readily taken up (either as liquid or vapour) and lost through the leaf surfaces (Shreve, 1911; Härtel 1940b; Richards and Evans, 1972). Härtel (1940b) showed that the dye neutral red can move in solution through the petiole into leaves of Hymenophyllum demissum, but concluded from micropotometer experiments that Hymenophyllaceae are not dependent on water uptake through the vascular system. It is also generally accepted that filmy ferns are physiologically shade plants (Gessner, 1940; Richards and Evans, 1972; Johnson et al., 2000). However, many questions of detail remain unanswered.
Filmy ferns are narrowly restricted both in their world range and in their local distributions, yet they can be a prominent feature of the vegetation where they occur, as in some tropical regions (there are some 50 species of Hymenophyllaceae in Jamaica; Shreve, 1911) or in wet sheltered valleys and tree‐fern gullies in New Zealand (Holloway, 1923a, b; Brownsey and Smith‐Dodsworth, 1989) and south‐east Australia (Duncan and Isaac, 1986). In Britain and Ireland, H. tunbrigense has a thinly scattered distribution in very localized sheltered, humid oceanic sites, mostly in rocky woodland, from Kerry, Cornwall and Sussex to west Inverness; H. wilsonii (although absent from south‐east England) has an ecologically and geographically rather wider distribution in rainy, humid western districts from Devon and Cornwall to northernmost Scotland and Shetland. Just what factors favour (and limit) the occurrence of filmy ferns? The present paper sets out some physiological data on H. wilsonii and H. tunbrigense from populations in south‐west England as a contribution to understanding the ecophysiological requirements and limitations both of these two species and of filmy ferns in general.
MATERIALS AND METHODS
Many of the measurements reported in this paper are based on chlorophyll fluorescence. This made it possible to work with minimal amounts of plant material, an important consideration when plants are extremely localized, slow growing, and often exist in only small populations. The field collecting sites are listed in Table . In most cases plant material was collected as single leaves, which were carefully detached to avoid damage to the patches (which are often easily loosened from the substratum). In a few cases palm‐sized pieces of material were collected from large populations, again taking care to avoid damage to the remaining plants. Measurements were generally made within hours, or at most a day or two, of collection of individual leaves; for short periods the leaves were kept on moistened filter paper in Petri dishes in subdued light in the laboratory. Larger amounts of material remained in good condition for weeks (in some cases, months) in closed polythene bags in subdued light in the laboratory, but light responses are likely to have changed over this time.
Table 1.
Localities of investigated material of H. tunbrigense and H. wilsonii
| Locality | Ordinance Survey grid ref. (Lat., Long.) | Altitude (m) | Habitat |
| H. tunbrigense | |||
| White Wood, Holne, Dartmoor, Devon | SX 692722 (50°32′N, 3°51′W) | 170 | Vertical face of shady granite outcrop in Quercus woodland on steep north‐east‐facing side of valley of R. Dart. |
| Shaugh Wood, Dartmoor, Devon | SX 536636 (50°27′N, 4°03′W) | 100 | Granite rock faces and amongst granite boulders in Quercus woodland on north‐facing side of valley of R. Plym. |
| Watersmeet, Lynmouth, Devon | SS 744486 (51°13′N, 3°48′W) | 110 | Steep ± north‐facing outcrop of Devonian sandstone (Hangman Grits), shaded by Quercus petraea and Vaccinium myrtillus |
| Roche Rock, Roche, Cornwall | SW 991596 (50°24′N, 4°49′W) | 190 | Sheltered hollow amongst granite boulders, shaded by rocks and by Pteridium and Rubus |
| Roughtor, Bodmin Moor, Cornwall | SX 145809 (50°36′N, 4°37′W) | 380 | Deep in interstices of granite block scree on treeless north‐west side of summit. |
| H. wilsonii | |||
| White Wood, Holne, Dartmoor, Devon | SX 692722 (50°32′N, 3°51′W) | 180 | With bryophytyes and Polypodium vulgare on side of shady granite outcrop in Quercus woodland on steep north‐east‐facing side of valley of R. Dart. |
| Wistman’s Wood, Two Bridges, Devon | SX 612773 (50°35′N, 3°58′W) | 400 | In bryophyte carpet on sloping faces of large granite boulders in low‐growing Quercus robur woodland |
| Sharpitor, nr Princetown, Devon | SX 559703 (50°31′N, 4°02′W) | 400 | Interstices of granite block scree near summit |
| Nr Desolate, Countisbury, Devon | SS 775499 (51°14′N, 3°45′W) | 190 | In bryophyte carpet on steep north‐facing Devonian sandstone (Hangman Grits) by old coast path, shaded by Ulex europaeus |
| Roughtor, Bodmin Moor, Cornwall | SX 145809 (50°36′N, 4°37′W) | 380 | Interstices of granite block scree on treeless north‐west side of summit, generally nearer light than H. tunbrigense |
Light‐response curves of relative electron flow and other parameters were constructed using a modulated chlorophyll fluorometer (FMS1; Hansatech Ltd, King’s Lynn, UK). Actinic light was provided by the fluorometer’s internal light‐source through a fibre‐optic probe. The leaf was exposed to a series of progressively increased 400–700 nm photon flux density (PPFD) levels. At each PPFD level, the leaf was equilibrated for 6 min before a 0·8‐s saturating pulse to measure FM′, for calculation of ΦPSII and non‐photochemical quenching (NPQ). The actinic light was then switched off and, after a far‐red pulse, F0′ was measured for calculation of qP before proceeding to measurements at the next highest light intensity. Repetitive sets of measurements were run using computer‐implemented scripts on the fluorometer. During all sets of measurements that extended beyond a few minutes, the leaf clip and fluorometer probe were lightly wrapped in moistened tissue and clingfilm to prevent drying. For concepts and nomenclature of chlorophyll‐fluorescence measurements and parameters, see Schreiber et al. (1995) and Maxwell and Johnson (2000).
CO2 exchange was measured using an infrared gas analyser (IRGA: leaf‐chamber analyser type LCA‐2, with Parkinson leaf chamber; ADC Ltd, Hoddesdon, UK), in differential mode at a flow‐rate of 150 cm3 min–1.
Pressure–volume (P–V) curves were constructed for single leaves, using thermocouple psychrometry. The psychrometer chambers were about 3 cm3 in volume, with screen‐caged thermocouples (Ramsden Scientific Instru ments, Billericay, UK, supplied by T. & J. Crump, Essex, UK). Measurements were made using a Wescor HR30‐T dewpoint microvoltmeter, in a room in which temperature varied by no more than 2 °C during the course of a day. The psychrometers were equilibrated for at least 4 h in an expanded polystyrene insulated box before each reading. After each measurement the leaf was quickly transferred to a small capped glass vial for weighing, and then allowed to lose 1–2 mg water before returning it to the psychrometer chamber for the next measurement. At the end of the run the leaves were oven dried at 70 °C to determine the dry weight, and the psychrometers were calibrated with filter‐paper discs saturated with 0·4 molal NaCl. For a fuller consideration of concepts and methods see Proctor et al. (1998) and Proctor (1999).
For the desiccation experiments, leaves were placed in open Petri dishes in glass desiccators, over salts in equilibrium with their saturated solutions to give the following humidities (at approx. 20 °C): CH3COOK [approx. 20 % relative humidity (RH), –220 MPa]; K2CO3·2H2O (approx. 43 % RH, –114 MPa); and CH3COONa. 3H2O (approx. 74 % RH, –40 MPa). Recovery was assessed by chlorophyll fluorescence, using the parameter FV/FM.
RESULTS
Light‐response curves
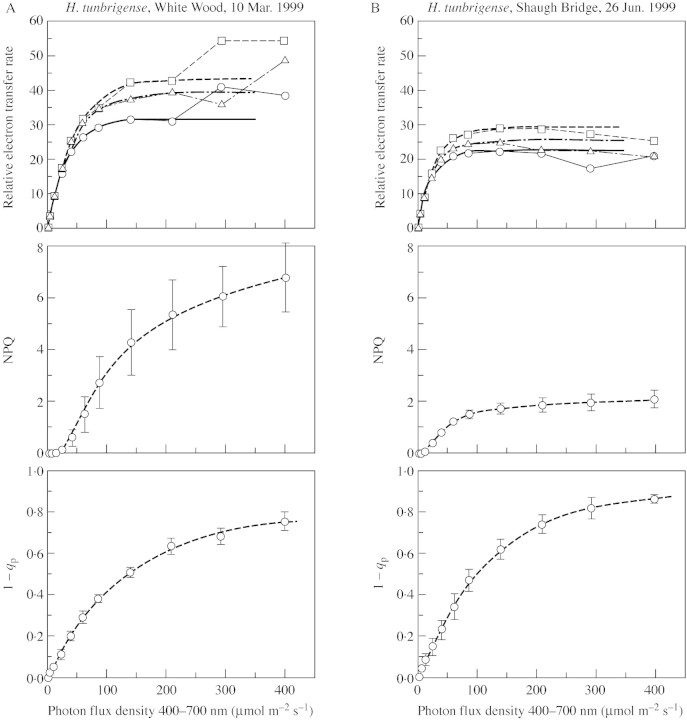
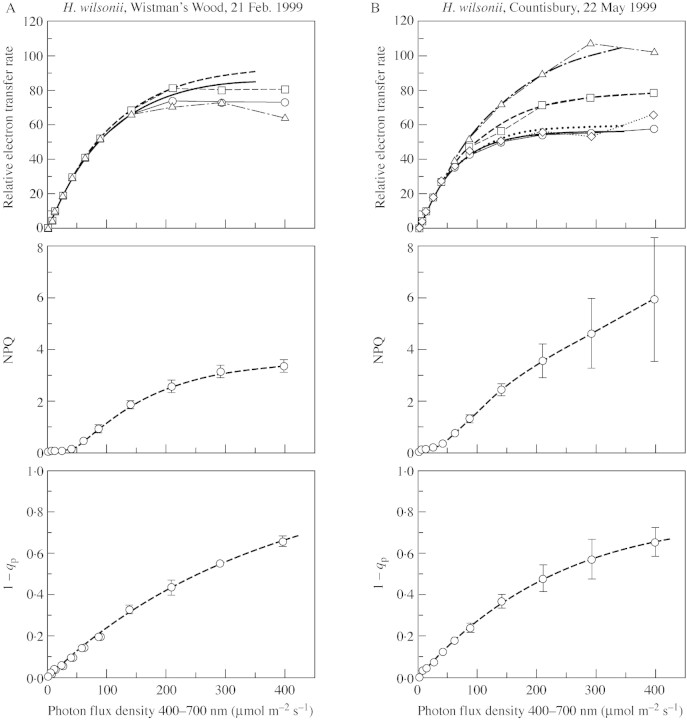
Representative light‐response curves for each of the species, based on the chlorophyll‐fluorescence measurements, are shown in Figs 1 and 2. Three parameters are plotted. First, the product of ΦPSII [(FM′ – FS)/FM′ × PPFD] is a measure of relative electron transport rate (RETR) through photosystem II. In general, this reflects photosynthesis + photorespiration. It provides a more easily (and precisely) measured alternative to gas exchange for characterizing light adaptation of the photosynthetic system. At low to moderate light intensities, typically up to 200–400 µmol m–2 s–1 PPFD, the data give a good fit to a curve of the form y = A(1 – e–kx), where y is RETR, x is PPFD, and A (the asymptote) and k are constants. The initial slope of the curve is A × k, which, for unstressed material, is expected to be approx. 0·8. We thus have a near approximation to a one‐parameter curve, characterizable by the value of x (PPFD) at which y (RETR) reaches 95 % of saturation (calculated as PPFD95% = – ln(0·05)/k).
Fig. 1. Light‐response curves of chlorophyll‐fluorescence parameters of H. tunbrigense from White Wood, Holne, Devon (10 Mar. 1999) (A) and from a shady crevice among granite boulders, Shaugh Bridge, Devon (26 Jun. 1999) (B).
Fig. 2. Light‐response curves of chlorophyll‐fluorescence parameters of H. wilsonii from Wistman’s Wood, Dartmoor, Devon (21 Feb. 1999) (A) and from the coast path west of Desolation Point, Countisbury, Devon (22 May 1999) (B).
At high irradiances, the data may show departures of two kinds from this simple saturation curve. In material from the shady sites, especially in late winter, electron flow was depressed at irradiances close to or exceeding saturation. On the other hand, in the spring months some material of both species from the more open sites followed the normal saturation curve initially, but electron flow continued to increase steeply at irradiances greater than about 300–400 µmol m–2 s–1 (Fig. 4). This is an effect commonly seen in bryophytes of brightly lit habitats, where it appears to be due to electron flow to oxygen, the precise nature of which has yet to be determined (Marschall et al., 2000). For the purposes of this paper, curves have been fitted to the lowest five to eight data points. The appropriate number in each case was decided largely by inspection of the graph and fitted curves; the value of the initial slope Ak was taken as a further criterion of goodness of fit.
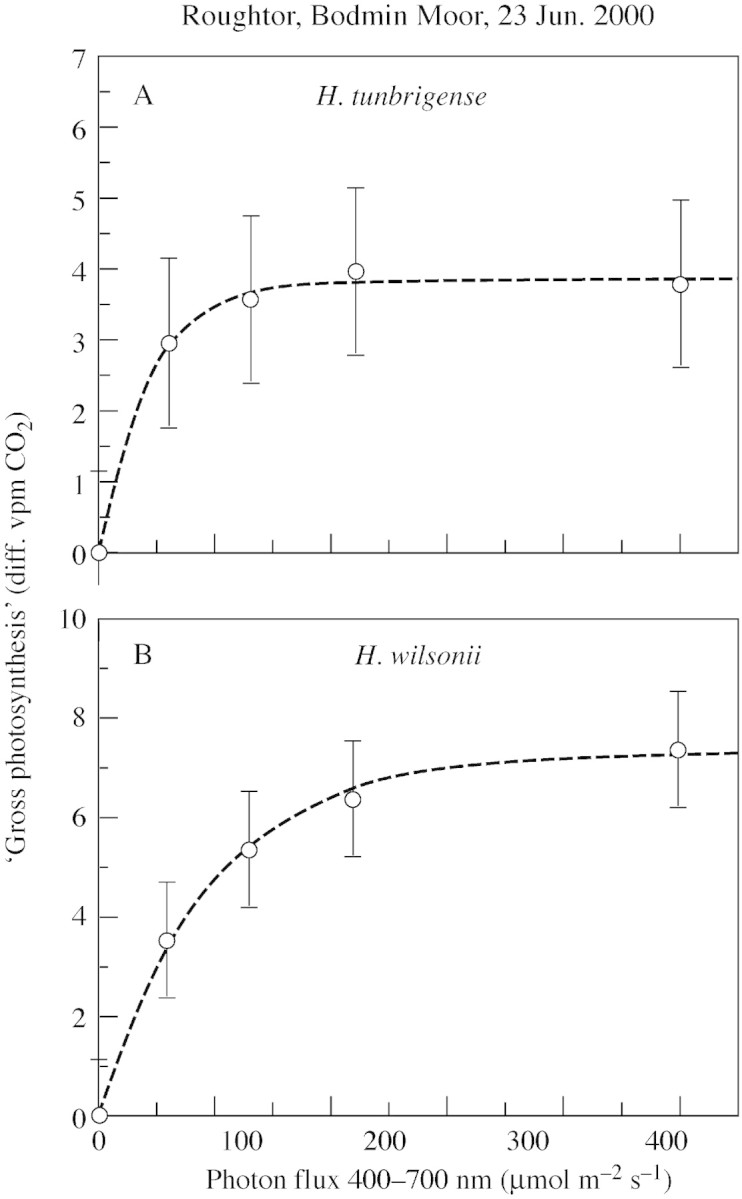
Fig. 4. Light response of CO2 exchange in H. tunbrigense (A) and H. wilsonii (B) from Roughtor, Bodmin Moor, Cornwall (17 Apr. 2000); measurements made 23 Jun. 2000. The y‐axis in each graph is arbitrary, and does not allow absolute comparisons between photosynthetic rates in the two species.
PPFD95 % values show that H. tunbrigense saturates at generally lower light levels than H. wilsonii (Table ). However, there is wide variation in both species (and between individual leaves within populations), and substantial overlap between them. It is noteworthy that the lowest values are from material collected from shady woodland sites in late winter or with the tree canopy fully expanded in summer, whereas most of the highest values derive from material from relatively open sites in April and May—that is, at the period in spring with relatively high irradiance before expansion of the vascular plant leafy canopy. For comparison, Table also includes a few values from ferns with normal leaf morphology. These saturated at higher light levels than the filmy ferns at the same localities, but Blechnum spicant from around the outcrops with H. tunbrigense was notably variable. Measurements from mature leaves of Ceterach officinarum from sunny limestone rocks showed saturation at far higher light levels than in any of the woodland species, even in early January.
Table 2.
Chlorophyll‐fluorescence light‐response parameters of H. tunbrigense and H. wilsonii
| Locality (treatment) | Date of measurement | 95% sat. RETR (µmol m–2 s–1) | NPQ at 400 µmol m–2 s–1 | 1 – qP at 400 µmol m–2 s–1 |
| Hymenophyllum tunbrigense | ||||
| White Wood | 13 Feb. 1999 | 109 ± 27 | 3·53 ± 0·72 | 0·81 ± 0·03 |
| White Wood (1 mmol DTT) | 16 Feb. 1999 | 63 ± 5 | 1·18 ± 0·05 | 0·90 ± 0·01 |
| White Wood | 10 Mar. 1999 | 123 ± 19 | 6·79 ± 1·35 | 0·75 ± 0·04 |
| Roche Rock | 10 May 1999 | 153 ± 22 | 6·44 ± 1·01 | 0·67 ± 0·05 |
| Watersmeet | 22 May 1999 | 164 ± 66 | 5·58 ± 0·84 | 0·72 ± 0·08 |
| Shaugh Bridge, rock face | 24 Jun. 1999 | 155 ± 20 | 3·54 ± 0·47 | 0·73 ± 0·04 |
| Shaugh Bridge, shady crevice | 26 Jun. 1999 | 83 ± 10 | 2·12 ± 0·36 | 0·86 ± 0·02 |
| Roughtor | 25 Apr. 2000 | 189 ± 54 | 3·95 ± 0·63 | 0·73 ± 0·08 |
| Hymenophyllum wilsonii | ||||
| White Wood | 13 Feb. 1999 | 140 ± 5 | 2·89 ± 0·16 | 0·77 ± 0·02 |
| Wistman’s Wood | 21 Feb. 1999 | 299 ± 16 | 3·33 ± 0·23 | 0·66 ± 0·02 |
| White Wood | 13 Mar. 1999 | 189 ± 53 | 3·88 ± 1·31 | 0·70 ± 0·09 |
| Sharpitor | 14 May 1999 | 323 ± 71 | 6·16 ± 1·17 | 0·57 ± 0·05 |
| Countisbury | 22 May 1999 | 277 ± 108 | 5·89 ± 2·41 | 0·66 ± 0·07 |
| Roughtor | 25 Apr. 2000 | 552 ± 146 | 4·16 ± 0·50 | 0·62 ± 0·13 |
| Other fern species and locality | ||||
| Blechnum spicant (L.) Roth; White Wood | 9 Mar. 1999 | 355 ± 207 | 3·81 | 0·58 |
| Dryopteris dilatata (Hoffm.) A. Gray; Wistman’s Wood | 21 Feb. 1999 | 417 | 2·87 | 0·54 |
| Polypodium vulgare L.; Wistman’s Wood | 22 Feb. 1999 | 565 ± 20 | 2·83 ± 0·39 | 0·31 ± 0·02 |
| Polypodium vulgare L.; White Wood | 10 Mar. 1999 | 415 ± 45 | 3·71 ± 0·46 | 0·34 ± 0·03 |
| Ceterach officinarum Willd.; sun‐exposed limestone rocks, Chudleigh, Devon. | 5 Jan. 2001 | 1142 ± 104 | 2·66 ± 0·27 (520 µmol m–2 s–1) | 0·21 ± 0·01 (520 µmol m–2 s–1) |
For further details of localities and habitats see Table 1.
In general, because it includes photorespiration as well as photosynthesis, RETR will saturate at higher irradiance than photosynthesis alone. The CO2‐exchange and RETR response curves for H. tunbrigense and H. wilsonii from Roughtor (Figs 3 and 4) illustrate this, but some of the difference seen here may reflect acclimation to light conditions in the laboratory.
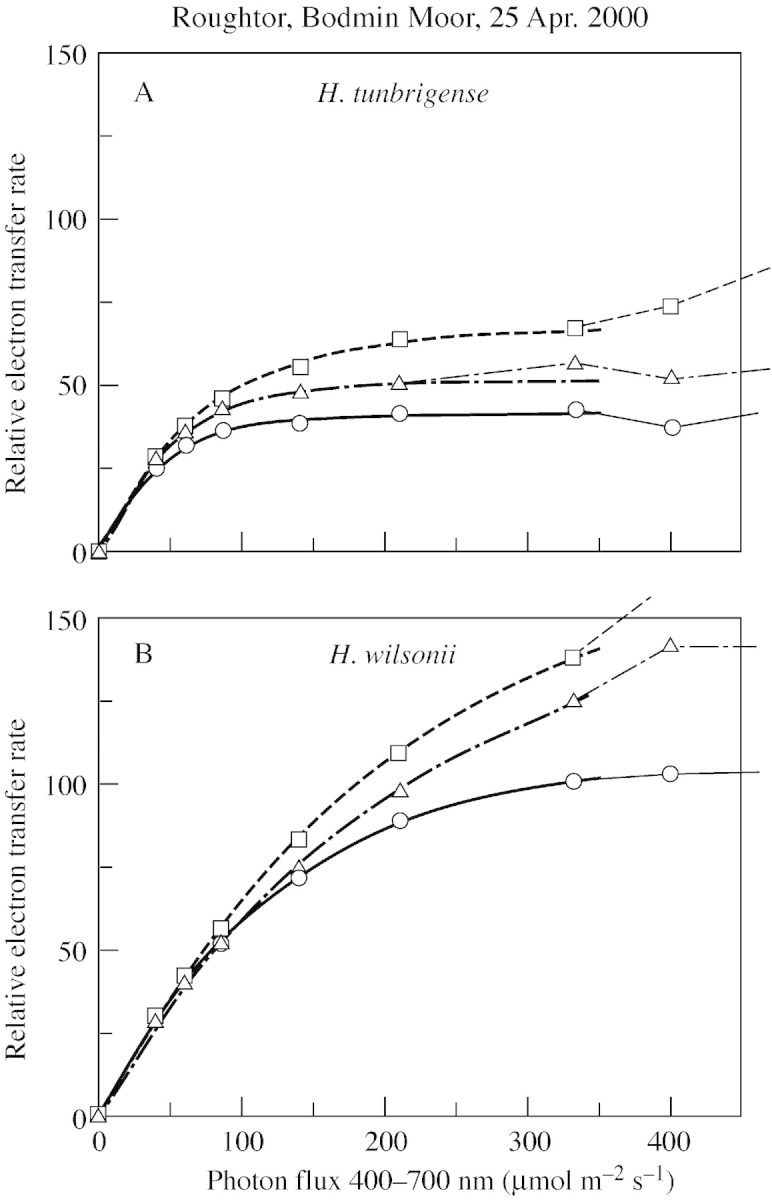
Fig. 3. Light‐response curves of relative electron flow in H. tunbrigense and H. wilsonii from Roughtor, Bodmin Moor, Cornwall (17 Apr. 2000). Measurements made 25 Apr. 2000.
The second parameter shown in Figs 1 and 2 and listed in Table is NPQ. Typically, this is largely a reflection of zeaxanthin‐mediated non‐radiative dissipation of excitation energy (Gilmore, 1997); the strong depression of NPQ in H. tunbrigense by the xanthophyll‐cycle inhibitor dithiothreitol (DTT; Winter and Königer, 1989) suggests that this is so in the filmy ferns examined here. NPQ is variable in both species; it rises to levels that are high by vascular plant standards, but lower than those reached by some desiccation‐tolerant bryophytes of sun‐exposed sites. There is no clear evidence of any difference in NPQ between the two species.
The third parameter in Figs 1 and 2 and Table , 1 – qP, is a measure of the reduction state of the primary electron acceptor QA. This rises with increasing irradiance and, in both species, the relation of 1 – qP to PPFD approximates to a negative exponential curve, whose asymptote (generally between 0·7 and 0·95) is negatively correlated with NPQ. Values of 1 – qP in the filmy ferns (400 µmol m–2 s–1 PPFD) are generally higher than those in ferns of normal leaf morphology from the same localities.
Water relations: P–V curves
Pressure–volume curves for leaves of H. tunbrigense and H. wilsonii from adjacent populations are shown in Figs 5 and 6, and some water‐relations parameters calculated from them are given in Table . Because of the inherent heteroscedasticity imposed by the reciprocal transformation in the familiar P–V curve, it is statistically preferable to work from the parameters of the hyperbolic fit to the untransformed data, and this has been done here.
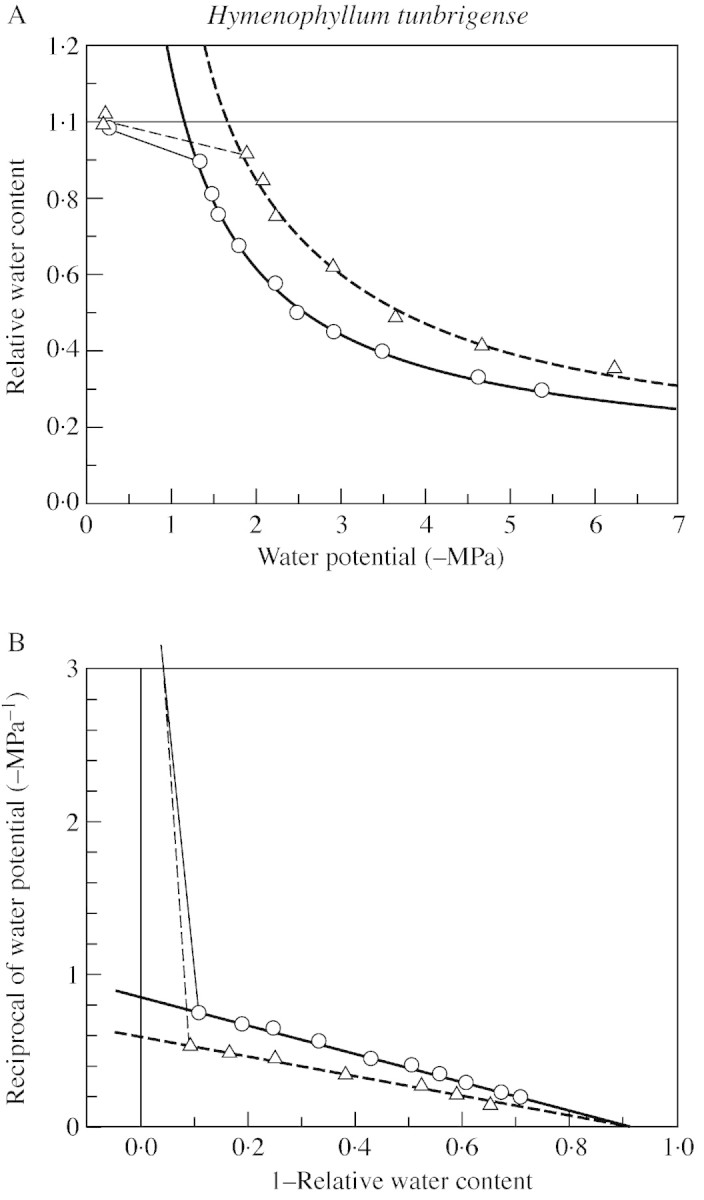
Fig. 5.Hymenophyllum tunbrigense. A, Relation of water potential to water content, from thermocouple‐psychrometric measurements, with hyperbolic regressions fitted to the observations below the turgor‐loss point. This presentation is equivalent to the Höfler diagram. B, Equivalent reciprocal‐transformed ‘P–V curves’, with linear regressions. For clarity, only two of the four measured data sets are shown. Material from White Wood, Holne, Dartmoor (16 Feb. 1999).
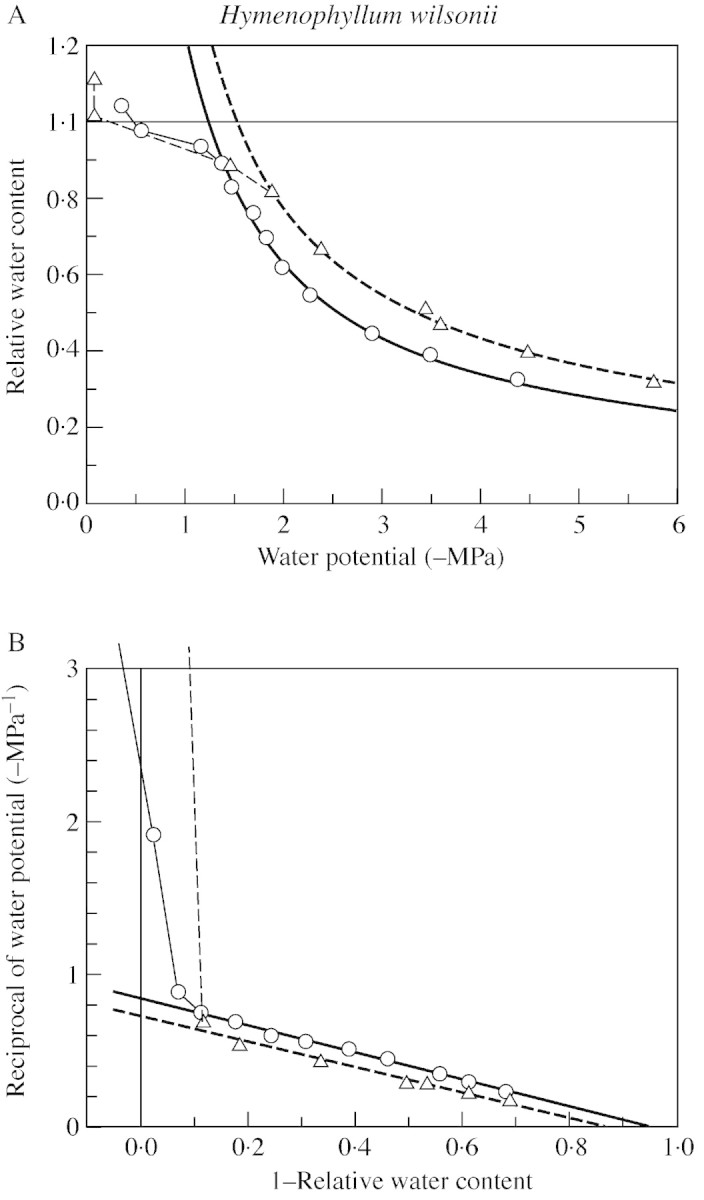
Fig. 6.Hymenophyllum wilsonii. A, Relation of water potential to water content, with hyperbolic regressions fitted to the observations below the turgor‐loss point. B, Equivalent ‘P–V curves’, with linear regressions. For clarity, only two of four data sets are shown. White Wood, Holne, Dartmoor (11 Feb. 1999). Compare Fig. 6.
Table 3.
Water‐relations parameters of H. tunbrigense and H. wilsonii
| Species | Osmotic potential at full turgor (MPa) | RWC at ψ∞ | Bulk elastic modulus ϵB at RWC 1·0 (MPa) | Water content at full turgor (% d. wt) |
| H. tunbrigense | –1·37 ± 0·28 | 0·066 ± 0·032 | 31 | 167 ± 22 |
| H. wilsonii | –1·45 ± 0·27 | 0·057 ± 0·039 | 26 | 195 ± 23 |
Material from White Wood, Holne, Dartmoor, February 1999.
Full‐turgor osmotic potentials of the two species are similar, and both are somewhat variable from leaf to leaf. The values measured lie within the mainstream range for bryophytes of similar habitats (Proctor et al., 1998; Proctor, 1999) and of vascular mesophytes (Larcher, 1995). The asymptote of the hyberbolic RWC/ψ curve as –ψ→∞ (corresponding to the x‐intercept of the traditional P–V curve, and the ‘apoplast fraction’) is similar, and similarly variable, in the two species. The data show clearly that the elastic modulus (ϵB) of the tissue at full turgor is high in both species (approx. 25–30), but are not adequate to assess its variability, or whether it differs between species. There is some indication that H. wilsonii may have a somewhat higher full‐turgor water content than H. tunbrigense, but this is not statistically significant.
Desiccation tolerance
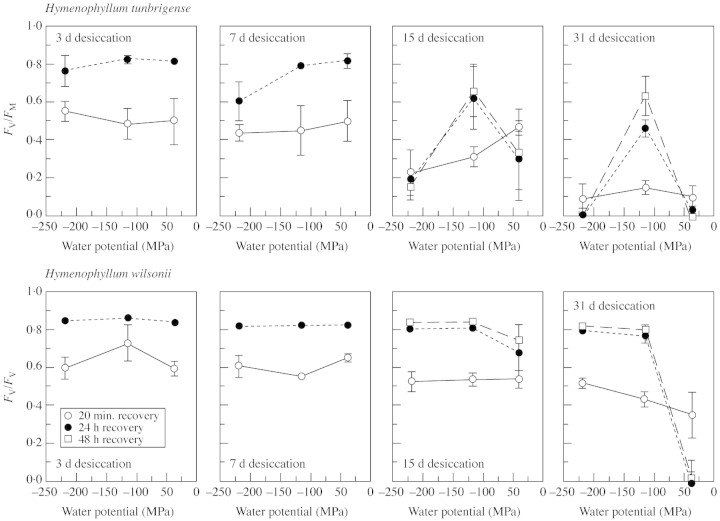
Figure 7 shows the tolerance to desiccation of leaves of H. tunbrigense and H. wilsonii from adjacent populations, in terms of the fluorescence parameter FV/FM (a measure of the maximal quantum efficiency of PSII) 20 min and 24 h after re‐moistening. H. wilsonii recovered equally quickly and fully from 7 d dry at any of the three humidities used, and H. tunbrigense less so only at 43% RH. A striking finding was the relatively poor survival of both species following longer periods of desiccation at 74 % RH (approx. –40 MPa). Of the two species, H. wilsonii was markedly the more desiccation tolerant, the leaves recovering after even 2 months at 43 % or 20 % RH (approx. –114 or approx. –218 MPa), though showing substantial localized damage. H. tunbrigense showed a similar level of recovery (and of damage) after 30 d, but survived only at 43 % RH (approx. –114 MPa); after just 15 d at this humidity it was already recovering less well than H. wilsonii.
Fig. 7. Desiccation tolerance of H. tunbrigense and H. wilsonii at three water potentials, approx. –40 MPa (approx. 74 % RH), –114 MPa (43 % RH) and –220 MPa (20 % RH), measured in terms of the chlorophyll‐fluorescence parameter FV/FM 20 min and 24 h after re‐wetting. Mean and s.d., n = 3. Material from White Wood, Holne, Dartmoor (Dec. 2001).
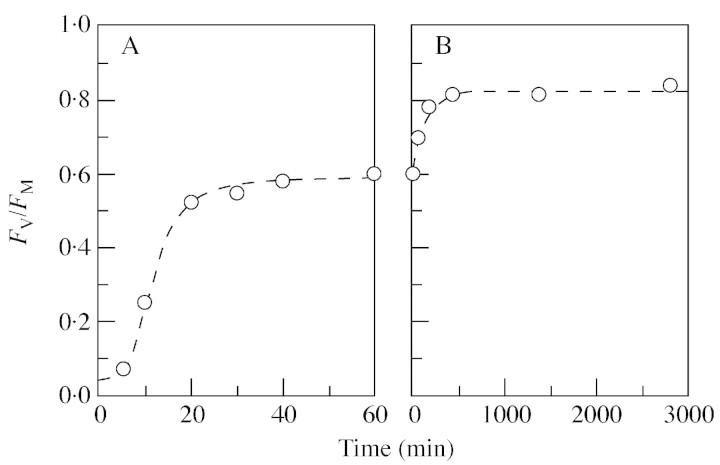
Both species recovered notably quickly after short periods (up to a few days) of desiccation (Fig. 7), H. wilsonii attaining approx. 85 % and H. tunbrigense approx. 60 % of the unstressed level of FV/FM within 20 min. Figure 8 shows a more detailed curve for H. wilsonii after 15 d desiccation at 43 % RH. Initial imbibition took a few minutes because of the waxy, water‐repellent leaf surface. The course of recovery for the first hour is well described by a logistic curve with an upper asymptote at about 0·59, reaching 50 % of this after about 12 min. Further recovery after this is slower and approximately exponential to an asymptote at FV/FM approx. 0·82, with a half‐recovery time of approx. 1·5 h.
Fig. 8. Recovery of H. wilsonii following rewetting after 15‐d desiccation at –114 MPa. A, 0–60 min, with fitted logistic curve. B, >60 min, with fitted exponential curve (rescaled with 60 min. from rewetting taken as zero). Material from White Wood, Holne, Dartmoor (29 Dec. 2001).
DISCUSSION
Light adaptation
The present results confirm earlier findings which have characterized Hymenophyllum species as shade plants (Gessner, 1940; Evans, 1964; Richards and Evans, 1972). Gessner was largely concerned with methodological comparisons of assimilation rates in air and water, but he confirmed earlier findings of reduced assimilation at high light intensities, and related this to bleaching of photosynthetic pigments. Evans (1964) found that the light compensation point was generally below 800 lx (approx. 16 µmol m–2 s–1) in H. tunbrigense, but most commonly 800–1100 lx (16–22 µmol m–2 s–1) in H. wilsonii. Richards and Evans (1972) reported that in leaves of the two species kept in the dark until starch‐free and then exposed to different levels of daylight, starch reappeared in H. tunbrigense at lower daylight values than in H. wilsonii. Rather surprisingly, the small discoid chloroplasts of Hymenophyllaceae have small grana and are quite unlike those of shade‐adapted ferns or angiosperms with normal leaf anatomy (Duckett and Ligrone, 1993; Makgomol and Sheffield, 2001).
The present results confirm that the two British Hymenophyllum species are indeed adapted to rather low light levels, and that H. wilsonii has a somewhat higher light requirement than H. tunbrigense. However, the two species overlap in this respect and there is much variation within each, especially in H. wilsonii. Some of this variation may be plastic, some ecotypic and some seasonal. The present data provide no positive evidence that PPFD responses are markedly plastic, but suggest that a degree of plasticity may exist. There is a clear tendency for populations in more brightly lit sites to reach saturation at higher PPFD values. The highest figures are for material collected in the two open moorland sites at relatively high altitude (Sharpitor and Roughtor). The data also suggest seasonal change in light adaptation, with light saturation at relatively low PPFD during the winter, rising through early spring and, in sites with a tree or shrub cover, perhaps reaching a maximum in April or early May before the canopy is fully expanded. Overall, the lowest figures are for material collected from the north‐east‐facing White Wood site under the relatively low ambient irradiance of late winter, and from a deeply shaded rock crevice under a fully expanded tree canopy near Shaugh Bridge in mid‐summer. NPQ tends to follow a similar trend, being low in shady sites and early in the season, and highest during the high‐irradiance period in spring, especially in sites without tree cover. The occurrence of ‘normal’ levels of NPQ in Hymenophyllum is in contrast to the absence of reversible NPQ in the extreme shade‐adapted gametophyte of Trichomanes speciosum (Johnson et al., 2000). The parameter (1 – qP) tends to follow an inverse pattern to RETR and NPQ. The correlation found between NPQ and the asymptote of (1 – qP) may be seen as a natural consequence of xanthophyll‐cycle‐mediated photoprotection preventing over‐reduction of the primary electron acceptor QA (Horton et al., 1996; Gilmore, 1997). The effect of DTT on RETR, NPQ and (1 – qP) lends weight to this idea. The tendency in the early part of the season (and in deep shade during the summer) for RETR to fall below the fitted negative‐exponential saturation curve must be due to some form of ‘photoinhibition’ other than that due to the operation of the xanthophyll cycle.
‘Gross photosynthesis’, estimated from IRGA measurements, reached saturation at rather lower PPFD than elec tron flow. This is an expected consequence of the fact that electron flow reflects both carbon assimilation and photorespiration. Therefore, chlorophyll‐fluorescence measurements alone cannot give a precise measure of photosynthetic carbon uptake. However, with appropriate precautions, they can give excellent comparative measurements, and it could be argued that they provide as valid a measure of the light‐adaptation of the photosynthetic system as carbon fixation.
Water relations
Earlier studies on the water relations of Hymenophyllaceae focused particularly on the effectiveness of the vascular system in water conduction, and on plasmolysis and cell‐wall and cell‐membrane permeability (Shreve, 1911; Renner, 1933; Härtel, 1940a, b). Richards and Evans (1972) suggested that H. tunbrigense both loses and gains water through the leaf surfaces more rapidly than H. wilsonii, but their data seem somewhat inconsistent on this point. From observations of plasmolysis, Renner (1933) estimated osmotic potentials (OPs) equivalent to 0·25–0·6 mol l–1 NaCl (approx. –1 to –2·5 MPa) in two Javanese species of Trichomanes. Härtel (1940a) similarly estimated OPs in the ranges 0·45–0·7 and 0·55–0·65 mol l–1 KNO3 (–1·8 to –2·6 and –2·1 to –2·4 MPa) in the New Zealand H. demissum and H. sanguinolentum, and 0·45–0·65 mol l–1 KNO3 (–1·8 to –2·4 MPa) in the Macaronesian and Atlantic‐European Trichomanes radicans (= T. speciosum). Plasmolysis can explore the variations in osmotic behaviour from one part of a leaf to another, but otherwise it is a limited tool and the figures given by it are always likely to be too high. Thermocouple psychrometry, as used here, cannot explore detailed variation, but gives a more precise estimate of the average osmotic potential of the cells in a tissue sample. The figures obtained here (Table ) are indeed lower, but do not lie far outside the range estimated by plasmolysis. They do not suggest a significant difference in OP between H. tunbrigense and H. wilsonii, and are unremarkable in the context of vascular mesophytes in general (Larcher, 1995). The data also indicate that the cell walls in these filmy ferns are relatively rigid and inelastic, and that only a small fraction of the total water content lies within the apoplast. Beckett (1997) obtained very similar figures by thermocouple psychrometry from the South African Trichomanes melanotrichum Schlechtend. Over all, the water relations data for filmy ferns are well within the range seen in bryophytes.
It seems firmly established that water conduction through the vascular system plays only a limited role in the water economy of filmy ferns (Shreve, 1911; Härtel, 1940b) though internal conduction must of course be important for metabolites including, e.g. carbohydrates, amino acids and growth regulators.
Desiccation tolerance
At first sight, the level of desiccation tolerance of both Hymenophyllum species may seem surprising in plants commonly perceived as requiring constantly humid conditions. However, it will come as no surprise to those who know the plants and their habitats well in the field, as indeed the literature shows (Shreve, 1911; Holloway, 1923a, b; Richards and Evans, 1972; Page, 1997). In general, the pattern of desiccation tolerance is similar to that seen in bryophytes (Proctor, 2001; Proctor and Pence, 2002). An interesting feature is that recovery is substantially independent of intensity of desiccation over a wide range; in this respect the two Hymenophyllum species behave more like desiccation‐tolerant mosses of exposed habitats than like liverworts or many forest‐floor mosses. In particular, both species do notably worse when kept for long periods at 74 % RH than at lower humidities. As shown by Figs 8 and 8, H. wilsonii appears to recover quickly and fully after desiccation for a week or two, and the behaviour of H. tunbrigense is different mainly in degree (but it is more sensitive than H. wilsonii to severe desiccation). Within limits, the two species seem well adapted to cope with alternating wet and dry periods. The length of dry period that the plant will tolerate is clearly one limit. Another limit was demonstrated by Evans (1964), who found a 3‐h daily moist period in an otherwise dry treatment uniformly damaging. There is obviously room for a wide range of possibilities between these extremes.
Species, adaptive strategies and habitat
The results particularly invite consideration from two points of view: how far do they illuminate the different behaviour of the two species in the field, and what do they tell us about the adaptation and broad ecological niche of filmy ferns in general?
H. tunbrigense occurs typically in very sheltered sites that are deeply shaded at least in summer, and humid but well drained and not persistently wet (Paton, 1953; Richards and Evans, 1972; Page, 1997). In block scree it grows in deeper and shadier crevices than H. wilsonii but, as in other situations, the two species seldom grow intermixed. H. wilsonii has a wider ecological amplitude, but generally occurs in more brightly lit situations, and is less closely tied to shelter. It appears the more tolerant of the two species to intermittent wetting, and it is the commoner of the two close to waterfalls and on boulders in rocky stream gullies. It is also more associated with high rainfall, and it extends to higher altitudes. These ecological preferences are reflected in the geographical distributions of the two species in Britain and Ireland (Preston et al., 2002); only H. tunbrigense is found in south‐east England (where it grows in shaded sites on the sand rocks of the Weald), but H. wilsonii is much the more widespread of the two in Wales, Cumbria and the western Scottish Highlands. Only H. wilsonii extends to the Atlantic coast of Norway, where (with a steep oceanic–continental gradient) it is very rare and generally occurs in deeply shaded, sheltered sites at low altitudes. These distributional differences relate clearly to the present data on light adaptation and desiccation tolerance.
Filmy ferns are undoubtedly a successful group in the habitats that favour them. But what defines a habitat that is favourable? Clearly it is not humidity or deep shade as such, otherwise we should not expect to find the British species [or, for instance, the New Zealand H. sanguinolentum (Forst. f.) Swartz] as tolerant of desiccation as both field observation and laboratory experimentation show them to be, or to observe the rather wide range of light adaptation that exists. More probably, their essential requirements are for reasonably frequent precipitation coupled with low evaporation. These conditions may be met by a range of combinations of wetting frequency and evaporation rate. Deep shade and still air mean little energy exchange to supply the latent of heat of evaporation, and high diffusive resistance to water loss (Jones, 1992). Turgor can thus be maintained for long periods with minimal water conduction, and precipitation need not be too frequent. On the other hand, with more frequent precipitation there is less premium on low evaporation. Typical habitats of H. tunbrigense exemplify the first set of conditions, and those of H. wilsonii the second. Between them, they define a substantial part of a filmy‐fern adaptive space. The sporophyte generation of the ‘Killarney fern’ Trichomanes speciosum Willd. is confined to wetter and more deeply shaded habitats than either of the British Hymenophyllum species (Ratcliffe et al., 1993), although its filamentous gametophyte is relatively widespread (Rumsey et al., 1998; Preston et al., 2002).
In Britain and Ireland the Hymenophyllum species are concentrated in areas with particularly rich and luxuriant bryophyte floras; their distributions recall those of such liverworts as Bazzania trilobata (L.) Gray, Scapania gracilis Lindb., Plagiochila punctata Tayl., Frullania fragilifolia (Tayl.) Gottsche, Lindenb. & Nees and Lejeunea patens Lindb. (Hill et al., 1991), or such mosses as Heterocladium heteropterum B. S. & G., Hyocomium armoricum (Brid.) Wijk & Margad. and Rhytidiadelphus loreus (Hedw.) Warnst. (Hill et al., 1994). The total distributions of Hymenophyllum tunbrigense and H. wilsonii are classified as Oceanic Temperate and Oceanic Boreo‐Temperate, respectively, by Preston and Hill (1997); the bryophytes listed above are classified on the same basis by Hill and Preston (1998) within a wider but related range of oceanic temperate groups. On a world scale too, the ecological and geographical distribution of the Hymenophyllaceae lies within core areas of bryophyte diversity and dominance, and some other fern genera (e.g. Leptopteris) show convergent development of membranous leaves. Filmy ferns may thus be seen as a pteridophyte essay into the typical adaptive strategy of bryophytes (Proctor and Tuba, 2002), in habitats and regions where that strategy is adaptively optimal.
ACKNOWLEDGEMENTS
I thank Professors John Birks and Jeff Duckett, and Dr Giles Johnson, for helpful discussion.
Supplementary Material
Received: 20 November 2002; Returned for revision: 15 January 2003; Accepted: 31 January 2003 Published electronically: 28 March 2003
References
- BeckettRP.1997. Pressure volume analysis of a range of poikilohydric plants implies the existence of negative turgor in vegetative cells. Annals of Botany 79: 145–152. [Google Scholar]
- BrownseyPJ, Smith‐Dodsworth JC.1989. New Zealand ferns and allied plants. Auckland: David Bateman. [Google Scholar]
- DuckettJG, Ligrone R.1993. Plastid‐dividing rings in ferns. Annals of Botany 72: 619–627. [Google Scholar]
- DuncanBD, Isaac G.1986. Ferns and allied plants of Victoria, Tasmania and South Australia. Melbourne: Melbourne University Press. [Google Scholar]
- EamesAJ.1936. Morphology of vascular plants. New York: McGraw‐Hill. [Google Scholar]
- EvansGB.1964. Studies on the autecology of the British species of Hymenophyllum, H. wilsonii Hk and H. tunbrigense (L.) Sm. PhD Thesis, University of Wales. [Google Scholar]
- GessnerF.1940. Die Assimilation der Hymenophyllaceen. Protoplasma 34: 102–116. [Google Scholar]
- GilmoreAM.1997. Mechanistic aspects of xanthophyll cycle‐dependent photoprotection in higher plant chloroplasts and leaves. Physiologia Plantarum 99: 197–209. [Google Scholar]
- HärtelO.1940a Physiologische Studien an Hymenophyllaceen. I. Zellphysiologische Untersuchungen. Protoplasma 34: 117–147. [Google Scholar]
- HärtelO.1940b. Physiologische Studien an Hymenophyllaceen. II. Wasserhaushalt und Resistenz. Protoplasma 34: 489–514. [Google Scholar]
- HillMO, Preston CD.1998. The geographical relationships of British and Irish bryophytes. Journal of Bryology 20: 127–226. [Google Scholar]
- HillMO, Preston CD, Smith AJE.1991. Atlas of the bryophytes of Britain and Ireland. 1. Liverworts. Great Horkesley, Colchester, UK: Harley Books. [Google Scholar]
- HillMO, Preston CD, Smith AJE.1994. Atlas of the bryophytes of Britain and Ireland. 3. Mosses (Diplolepideae). Great Horkesley, Colchester, UK: Harley Books. [Google Scholar]
- HollowayJE.1923a Studies in the New Zealand Hymenophyllaceae. Part 1. The distribution of the species in Westland, and their growth‐forms. Transactions of the New Zealand Institution 54: 577–618. [Google Scholar]
- HollowayJE.1923b Studies in the New Zealand Hymenophyllaceae. Part 2. The distribution of the species throughout the New Zealand biological region. Transactions of the New Zealand Institution 55: 67–94. [Google Scholar]
- HortonP, Ruban AV, Walters RG.1996. Regulation of light harvesting in green plants. Annual Review of Plant Physiology and Plant Molecular Biology 47: 655–684. [DOI] [PubMed] [Google Scholar]
- JohnsonGN, Rumsey FJ, Headley AD, Sheffield E.2000. Adaptations to extreme low light in the fern Trichomanes speciosum New Phytologist 148: 423–431. [DOI] [PubMed] [Google Scholar]
- JonesHG.1992. Plants and microclimate 2nd edn. Cambridge: Cambridge University Press. [Google Scholar]
- LarcherW.1995. Physiological plant ecology. 3rd edn. Berlin: Springer. [Google Scholar]
- MakgomolK, Sheffield E.2001. Gametophyte morphology and ultrastructure of the extremely deep shade fern, Trichomanes speciosum New Phytologist 151: 243–255. [DOI] [PubMed] [Google Scholar]
- MarschallM, Proctor MCF, Smirnoff N.2000. Aspects of the photosynthetic responses of bryophytes. Journal of Experimental Botany 51 (suppl.): 58. [Google Scholar]
- MaxwellK, Johnson GN.2000. Chlorophyll fluorescence – a practical guide. Journal of Experimental Botany 51: 659–668. [DOI] [PubMed] [Google Scholar]
- PageCN.1997. The ferns of Britain and Ireland 2nd edn. Cambridge: Cambridge University Press. [Google Scholar]
- PatonJA.1953. A bryophyte flora of the sandstone rocks of Kent and Sussex. Transactions of the British Bryological Society 2: 349–374. [Google Scholar]
- PrestonCD, Hill MO.1997. The geographical relationships of British and Irish vascular plants. Botanical Journal of the Linnean Society 124: 1–120. [Google Scholar]
- PrestonCD, Pearman DA, Dines TD.2002. New atlas of the British and Irish flora Oxford: Oxford University Press, 63. [Google Scholar]
- ProctorMCF.1999. Water‐relations parameters of some bryophytes evaluated by thermocouple psychrometry. Journal of Bryology 21: 263–270. [Google Scholar]
- ProctorMCF.2001. Patterns of desiccation tolerance and recovery in bryophytes. Plant Growth Regulation 35: 147–156. [Google Scholar]
- ProctorMCF, Pence VC.2002. Vegetative tissues: bryophytes, vascular plants and vegetative propagules. In: Black M, Pritchard HW, eds. Desiccation and survival in plants: drying without dying Wallingford, UK: CAB International, 207–237. [Google Scholar]
- ProctorMCF, Tuba Z.2002. Poikilohydry and homoihydry: antithesis or spectrum of possibilities? New Phytologist 156: 327–349. [DOI] [PubMed] [Google Scholar]
- ProctorMCF, Nagy Z, Csintalan Zs, Takács Z.1998. Water‐content components in bryophytes: analysis of pressure–volume curves. Journal of Experimental Botany 49: 1845–1854. [Google Scholar]
- RatcliffeDA, Birks HJB, Birks HH.1993. The ecology and conservation of the Killarney fern Trichomanes speciosum Willd. in Britain and Ireland. Biological Conservation 66: 231–247. [Google Scholar]
- RennerO.1933. Zur Kenntnis des Wasserhaushaltes javanischer Kleinepiphyten. Planta 18: 215–287. [Google Scholar]
- RichardsPW, Evans GB.1972. Biological Flora of the British Isles. Hymenophyllum Journal of Ecology 60: 245–268. [Google Scholar]
- RumseyFJ, Jermy AC, Sheffield E.1998. The independent gametophyte stage of Trichomanes speciosum Willd. (Hymenophyllaceae), the Killarney Fern and its distribution in the British Isles. Watsonia 22: 1–19. [Google Scholar]
- SchreiberU, Bilger W, Neubauer C.1995. Chlorophyll fluorescence as a nonintrusive indicator for rapid assessment of in vivo photosynthesis. In: Schulze E‐D, Caldwell MM, eds. Ecophysiology of photosynthesis Berlin: Springer, 49–70. [Google Scholar]
- ShreveF.1911. Studies on Jamaican Hymenophyllaceae. Botanical Gazette 51: 184–209. [Google Scholar]
- SmithGM.1938. Cryptogamic botany. II. Bryophytes and Pteridophytes. New York: McGraw‐Hill. [Google Scholar]
- WinterK, Königer M.1989. Dithiothreitol, an inhibitor of violaxanthin de‐epoxidation, increases the susceptibility of leaves of Nerium oleander L. to photoinhibition of photosynthesis. Planta 180: 24–31. [DOI] [PubMed] [Google Scholar]
Associated Data
This section collects any data citations, data availability statements, or supplementary materials included in this article.


