

Abstract
• Background and Aims Rapid leaf area expansion is a desirable trait in the early growth stages of cereal crops grown in low‐rainfall areas. In this study, the traits associated with inherent variation in early leaf area expansion rates have been investigated in two wheat species (Triticum aestivum and T. durum) and three of its wild relatives (Aegilops umbellulata, A. caudata and A. tauschii) to find out whether the Aegilops species have a faster leaf area expansion in their early developmental stage than some of the current wheat species.
• Methods Growth of individual leaves, biomass allocation, and gas exchange were measured on hydroponically grown plants for 4 weeks.
• Key Results Leaf elongation rate (LER) was strongly and positively correlated with leaf width but not with leaf elongation duration (LED). The species with more rapidly elongating leaves showed a faster increase with leaf position in LER, leaf width and leaf area, higher relative leaf area expansion rates, and more biomass allocation to leaf sheaths and less to roots. No differences in leaf appearance rate were found amongst the species.
• Conclusions Aegilops tauschii was the only wild species with rapid leaf expansion rates similar to those of wheat, and it achieved the highest photosynthetic rates, making it an interesting species for further study.
Key words: Aegilops, biomass allocation, leaf elongation duration, leaf elongation rate, leaf expansion, leaf width, photosynthesis, relative growth rate, Triticum, wheat, wild relatives
INTRODUCTION
Rapid leaf area expansion is a desirable trait in the early growth stages of cereal crops grown in low‐rainfall areas. It leads to rapid canopy closure, thereby reducing the evaporation from the soil surface, and thus increasing crop water‐use efficiency (Richards et al., 2002). In more favourable conditions, fast canopy development will make the crop more competitive with weeds for light interception (Lemerle et al., 2001). Moreover, Van den Boogaard et al. (1996b) showed, in a controlled‐environment study, that a fast leaf area expansion rate in wheat was positively correlated with above‐ground biomass and grain yield. In the present study, the traits associated with inherent variation in early leaf area expansion rates have been investigated in two wheat species (Triticum aestivum and T. durum) and three of its wild relatives (Aegilops umbellulata, A. caudata and A. tauschii). In addition to a better mechanistic understanding, this will provide valuable information on traits to select for in wheat‐breeding programmes. Some of the species of the genus Aegilops have contributed in the distant past to the genome of the current bread wheat through natural hybridization (Van Slageren, 1994). The hybridization between tetraploid T. turgidum (genomic formula: AABB) and diploid A. tauschii (DD) resulted in hexaploid T. aestivum (genomic formula: AABBDD). Due to their genetic link with the wheat species and their large genetic variation, the species of the genus Aegilops are potential donors of valuable traits for future wheat cultivars (Feldman and Sears, 1981; Damania, 1993) that may be better adapted to drier and warmer conditions, diseases and extreme temperatures.
The relative growth rate of whole shoot leaf area (RGRla) is determined by the leaf area expansion rate of individual leaves, and the rate at which new leaves and tillers emerge (Bultynck et al., 1999). In turn, leaf area expansion of individual leaves is determined by leaf elongation rate (LER), leaf elongation duration (LED) and leaf width. Although expansion rates of main stem leaves of single genotypes are well documented (e.g. Gallagher, 1979; Gautier and Varlet‐Grancher, 1996; Rodríguez et al., 1998a; Masle, 2000), studies that include several tillers (Bos and Neuteboom, 1998) and compare a range of genotypes or species are scarce. Such data are a prerequisite to understanding of inherent variation in RGRla, and are gathered in this study.
In comparisons of several wheat cultivars and some of their progenitors (Evans and Dunstone, 1970; Rawson et al., 1983; Van den Boogaard et al., 1997; Villar et al., 1998), a negative association between leaf area and the rate of photosynthesis per unit leaf area has been found, counteracting the positive effect of an increased leaf area on biomass production. Variation in RGRla has been shown to be closely associated with variation in biomass allocation and production (Chapin et al., 1989; Van den Boogaard et al., 1996a).
The three objectives of this study were (1) to determine the traits associated with inherent variation in RGRla; (2) to investigate the relationship among RGRla, the rate of photosynthesis per unit leaf area, the biomass allocation pattern and relative growth rate of dry mass (RGRdm); and (3) to evaluate whether the Aegilops species have a faster leaf area expansion in their early developmental stage than some of the current wheat species.
MATERIALS AND METHODS
Plant material and growing conditions
Three Aegilops L. species and two Triticum L. species were used: A. caudata, A. tauschii, A. umbellulata, T. aestivum ‘Cascades’ and T. durum ‘Tamaroi’. Aegilops seeds were obtained from the International Centre for Agricultural Research in the Dry Areas (ICARDA, Aleppo, Syria) and Triticum seeds were obtained from the Department of Agriculture Western Australia (South Perth, Australia). Prior to germination, seeds were surface‐sterilized with a 2·5 % NaHClO3 solution and stratified (placed on wet filter paper at 4 °C in the dark) for 7 d. Seeds were germinated on moistened filter paper in Petri dishes in a germination cabinet (day: 14 h, 50 µmol m–2 s–1 PAR, 25 °C; night: 10 h, 15 °C). After germination seedlings were transferred to trays filled with washed river‐sand, saturated with de‐ionized water, and placed in the growth room (day: 14 h, 420 ± 30 µmol m–2 s–1 PAR, 23 ± 2 °C, 70 % RH; night: 10 h, 19 ± 2 °C, 70 % RH) for 3 d. Thereafter, seedlings were transferred (= day 0) to containers with 20 L of aerated modified Hoagland nutrient solution (2 mm NO3–), as described by Poorter and Remkes (1990). The pH of the nutrient solution was adjusted daily to 5·5 with H2SO4, and the solution was replenished weekly. Each container held 32 plants on day 0, spaced wide enough to prevent competition for light. Through progressive harvests, sufficient spacing was maintained between the growing plants during the course of the experiment. Plants were rotated daily within the growth room to minimize the variation in environmental conditions for individual plants.
Destructive measurements
Eight plants per species were harvested on the following days: 0, 7, 14, 20 and 26 for T. aestivum and T. durum; 0, 7, 14, 21 and 26 for A. umbellulata; 0, 7, 14, 21 and 27 for A. caudata and A. tauschii. The date of the last harvest differed among species depending on when leaf 6 on the main stem was fully elongated. Plants were separated into leaf blades, leaf sheaths and roots, and fresh weights of each portion were determined. Leaf blades were computer‐scanned and analysed for leaf area, leaf length and maximum leaf width using the Win Rhizo V3.9 software (Regent Instruments, Quebec, Canada). Dry weights were determined after all plant material had been dried for 48 h at 70 °C.
From these data the following parameters were calculated: leaf mass ratio (LMR; leaf blade biomass per unit plant mass, g g–1), stem mass ratio (SMR; leaf sheath biomass per unit plant mass, g g–1), root mass ratio (RMR; root biomass per unit plant mass, g g–1), leaf area ratio (LAR; leaf area per unit plant mass, m2 kg–1) and specific leaf area (SLA; leaf area per unit leaf mass, m2 kg–1).
Leaf area and plant dry mass data from each harvest were ln‐transformed, and relative leaf area expansion rate (RGRla, g g–1 day–1), relative growth rate (RGRdm, g g–1 day–1) and net assimilation rate (NAR; increase in total plant mass per unit leaf area per day, g m–2 day–1) were calculated for each harvest interval, using the equations of Radford (1967).
Plants reserved for the last harvest were used throughout the experiment for daily leaf growth measurements as specified below. Villar et al. (1998) showed, for six Aegilops species, including A. umbellulata and A. tauschii, that handling these plants every 5 d had only a minor effect on their relative growth rates. In the preliminary experiments of the present study, RGR of daily handled plants was determined non‐destructively (i.e. whole plants were weighed and subsequently returned to nutrient solution) and compared with the RGR of non‐handled plants determined through destructive harvests. No significant differences were found in RGR between the destructive and non‐destructive method, leading to the conclusion that handling these plants daily did not affect their growth rates.
Non‐destructive individual leaf growth measurements
Leaf growth measurements were conducted on eight plants per species, until leaf 6 on the main shoot was fully elongated. Leaf and tiller emergence were recorded daily, and leaves and tillers were identified according to Klepper et al. (1982). Phyllochron was determined for individual leaves as the time between the appearence of two successive leaf tips from the whorl of leaf sheaths. At each daily non‐destructive measurement the number of simultaneously growing leaves and tillers was determined. From the onset of tillering, the relative tillering rate (increase in number of tillers per number of tillers already present; tillers tiller–1 day–1) and the relative increase in number of simultaneously growing leaves (increase in number of simultaneously growing leaves per number leaves already growing; leaves leaf–1 day–1) were calculated as the slopes of the regression lines through the ln‐transformed number of tillers and simultaneously growing leaves versus time, respectively.
Leaf length of each growing leaf was measured daily with a ruler. Leaf elongation rate (LER, mm day–1) of individual leaves was calculated as the slope of the linear regression line through the data points within the phase of linear increase in leaf length.
Leaf elongation duration (LED, days) of individual leaves was estimated as:
LED = Lf/LER(1)
where Lf (mm) is final leaf length and LER (mm day–1) is leaf elongation rate. Calculating LED in this way underestimates the absolute LED, as LER is not constant throughout the duration of leaf elongation. Instead, LER follows a sigmoidal curve, with lower rates at the start and end of leaf elongation. However, the relative LED values, as estimated here by eqn (1), are sufficient for the purpose of comparing leaf positions and species.
Gas exchange measurements
At the last harvest date, gas exchange was measured on the youngest fully expanded leaf on the main stem of three plants per species. Gas exchange measurements were carried out with a LiCor 6400 system using the red and blue LED light source (LiCor, Lincoln, NE, USA). First, the rate of CO2 assimilation was measured at ambient CO2 concentration, at a saturating light intensity (2000 µmol m–2 s–1; Amax) and then at a light intensity similar to that in the growth room (430 µmol m–2 s–1; Aa). Thereafter, the response to intercellular CO2 was measured at a light intensity of 2000 µmol m–2 s–1 and at external CO2 concentrations declining from 1200 µmol mol–1 to 50 µmol mol–1.
It was assumed that, at low intercellular CO2 partial pressures, the assimilation of CO2 was limited solely by the amount, activity and kinetic properties of Rubisco (Wullschleger, 1993). At these low intercellular CO2 partial pressure values, Rubisco activity (Vc) was obtained by fitting the following equation to the rates of CO2 assimilation (Von Caemmerer and Farquhar, 1981):
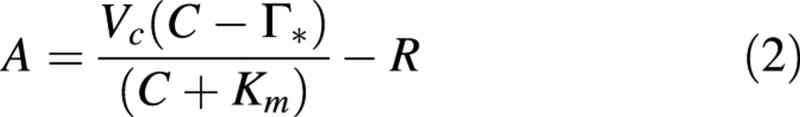
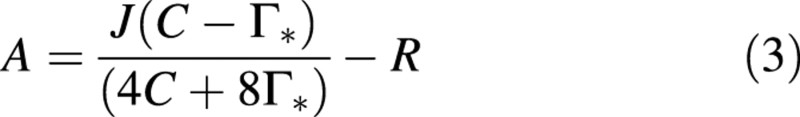
where C is the intercellular CO2 partial pressure (assumed here to be equal to that at the site of carboxylation), Γ* is the CO2 compensation point in the absence of dark respiration (R), and Km is the effective Michaelis‐Menten constant for CO2. The kinetic constants for Rubisco were assumed to be equal to those determined for tobacco (Von Caemmerer et al., 1994), namely 36·9 µbar for Γ* and 730 µbar for Km at 25 °C. As the data of this study were obtained at growth temperature (23 °C), parameter values were calculated using the Arrhenius equation and activation energies given by De Pury and Farquhar (1997). At high intercellular CO2 partial pressures, it was assumed that CO2 assimilation was limited by the electron transport activity (J). J was then obtained by fitting the following equation through the rates of CO2 assimilation at high intercellular CO2 partial pressures (Von Caemmerer and Farquhar, 1981):
Total nitrogen concentration of the leaves on which photosynthesis was measured, was determined with an automatic C‐H‐N analyser (Leco CHN 1000, St Joseph, MI, USA).
Statistical analysis
Data were analysed with SPSS 8·0 for Windows statistical software (SPSS Inc., Chicago, IL, USA). For each leaf position, differences in LER, leaf width and LED between species were analysed by one‐way ANOVA (α = 0·05). The results from this analysis were used to calculate the LSD. Relationships between leaf parameters were tested by linear regression equations. Differences between species in biomass allocation parameters were analysed by two‐way ANOVA with species and time as factors. Differences amongst species in RGRdm and RGRla were tested by two‐way ANOVA of the ln‐transformed plant dry mass and leaf area data with species and time as the independent factors (Poorter and Lewis, 1986). A significant interaction between species and time indicates a difference in RGRdm or RGRla. Differences amongst species in gas exchange parameters, relative tillering rate and relative increase in simultaneously growing leaves were analysed with a one‐way ANOVA, followed by a Tukey post hoc test at α = 0·05.
RESULTS
Growth of individual leaves
The leaves on the main stem, tiller 1 and tiller 2 of A. tauschii, T. aestivum and T. durum had larger leaf areas than those at similar positions on A. caudata and A. umbellulata (Fig. 1A), due to a faster leaf elongation and wider leaves (Fig. 1B and C). No such distinct differences in LED were found between the species (Fig. 1D). LER of the individual leaves was positively correlated with leaf width within each species (P < 0·001; r2 between 0·171 for A. umbellulata and 0·628 for T. aestivum), and the correlation became stronger when all the species were grouped together (P < 0·001; r2 = 0·71) (Fig. 2A). The relationship between LER and LED was less clear, both within and amongst species (P < 0·001; r2 = 0·049) (Fig. 2B).

Fig. 1. Leaf area (A), leaf elongation rate (B), leaf width (C), and leaf elongation duration (D) of successive leaves on main stem, tiller 1 and tiller 2, of A. umbellulata, A. caudata, A. tauschii, T. aestivum and T. durum. Leaf area and width were measured on fully grown harvested leaves. Leaf elongation rate and duration were calculated from daily leaf length measurements. Symbols denote means of eight plants per species. Vertical bars represent LSD.

Fig. 2. Relationships between (A) leaf elongation rate and leaf width, and (B) leaf elongation rate and duration, of A. umbellulata, A. caudata, A. tauschii, T. aestivum and T. durum. Symbols denote mean values (± s.e.) of eight leaves per leaf position. The lines indicate the linear regressions, derived from the individual values of leaves of all species: (A) y = 0·116x + 0·94 (r2 = 0·71, P < 0·001); (B) y = 0·012x + 5·27 (r2 = 0·049, P < 0·001).
Leaf area, LER, leaf width and LED increased with leaf number on a tiller, in most species (Fig. 1). The increase in LED did not differ significantly amongst most species, whereas the increases in leaf area, LER and leaf width were significantly faster in the two Triticum species and A. tauschii compared with the more slowly elongating A. umbellulata and A. caudata (Fig. 1). In the rapidly elongating A. tauschii and the two Triticum species, leaf area, LER and leaf width increased by >150 % from the first to the sixth leaf on the main stem. In the slowly elongating A. umbellulata and A. caudata, leaf area and LER increased by approx. 100 % from the first to the sixth leaf on the main stem, and leaf width increased by approx. 20 %. On tillers 1 and tiller 2, A. tauschii and the two Triticum species showed a higher relative increase in leaf area and leaf width from the first to the third leaf than did A. umbellulata and A. caudata, but the species no longer differed in their relative increase in LER. The relative increase in LED was similar for all the species on the main stem, tiller 1 and tiller 2, and was generally <50 %.
Leaf appearance rate: leaf and tiller emergence
Phyllochron (= inverse of leaf emergence) was constant across leaf positions on a single tiller (data not shown) and, when averaged over all the leaves on a tiller, there were no significant differences in phyllochron amongst the different tillers and species (Table 1; two‐way ANOVA with tiller and species as factors and α = 0·05, data not shown). Although A. umbellulata started to produce tillers earlier (day 6) than the other species (between day 8 and day 10), the first tiller of all species emerged when the third and fourth leaves on the main stem were growing, and the tillers emerged in the same sequence (data not shown). From the onset of tillering, no significant difference in relative tillering rate was found among most of the species (Table 1): the two Triticum species had a higher relative tillering rate (>0·060 tillers tiller–1 day–1) than the Aegilops species (<0·055 tillers tiller–1 day–1), but the difference was significant only for T. aestivum (0·063 tillers tiller–1 day–1). Similar differences amongst species were observed for the relative increase in simultaneously elongating leaves, calculated from the start of tillering, but none of these differences was significant (Table 1). Before the onset of tillering, the number of simultaneously growing leaves on the main stem fluctuated between one and two leaves (data not shown). Two weeks after the onset of tillering, A. umbellulata had 12·0 (± 0·3) tillers; A. caudata had 9·3 (± 0·5) tillers; A. tauschii had 8·8 (± 0·4) tillers; T. aestivum had 13·0 (± 0·9) tillers; and T. durum had 12·3 (± 0·6) tillers.
Table 1.
Comparison, amongst species, of phyllochron (days) averaged across all leaves of a tiller, relative tillering rate (tillers tiller–1 day–1), and relative increase in number of simultaneously elongating leaves (leaves leaf–1 day–1)
| Phyllochron | Relative | Relative increase in | |||
| Main stem | Tiller 1 | Tiller 2 | tillering rate | simultaneously growing leaves | |
| A. umbellulata | 4·2 | 3·8 | 3·9 | 0·053ab | 0·054a |
| A. caudata | 4·7 | 4·8 | 4·6 | 0·051at | 0·054a |
| A. tauschii | 4·5 | 4·5 | 4·4 | 0·052ab | 0·059a |
| T. aestivum | 4·2 | 4·0 | 4·2 | 0·063ct | 0·064a |
| T. durum | 3·9 | 4·0 | 3·7 | 0·061bc | 0·060a |
Values are means of eight plants and different letters indicate significant differences between species (post hoc Tukey; P < 0·05).
Whole plant growth and biomass allocation
Figures 3 and 4 present biomass allocation, LAR, SLA, NAR, and relative growth rate of dry mass (RGRdm) and leaf area (RGRla) as a function of plant size. Two‐way analysis of variance, with species and time as fixed factors, showed highly significant (P < 0·001) main effects and interactions for all the parameters presented in Figs 3 and 4. At the start of the growing period, A. tauschii and the two Triticum species showed a faster relative growth rate (RGRdm) than A. umbellulata and A. caudata, owing to a higher LAR (Fig. 3A) in A. tauschii and a higher NAR in the Triticum species (Fig. 3B and C). In A. tauschii, however, RGRdm and LAR decreased by approx. 60 % over the experimental period, and reached values similar to those of the other Aegilops species (Fig. 3A and B). The RGRdm in the two Triticum species also decreased initially, owing to a decrease in NAR, but it recovered again at the end of the experimental period, owing to an increase in both NAR and LAR (Fig. 3A–C). The change in RGRla with ontogeny showed a similar pattern as that of RGRdm (Fig. 3D).

Fig. 3. Ontogenetic changes in (A) relative growth rate of plant dry mass (RGRdm), (B) leaf area ratio (LAR), (C) net assimilation rate (NAR) and (D) relative leaf area expansion rate (RGRla), of A. umbellulata, A. caudata, A. tauschii, T. aestivum and T. durum. Arrows in (D) indicate onset of tillering for each species. Error bars indicate s.e. (n = 8). For NAR it was not possible to calculate s.e. See Results for statistical evaluation of these parameters.

Fig. 4. Ontogenetic changes in (A) specific leaf area (SLA), (B) leaf mass ratio (LMR), (C) stem mass ratio (SMR), and (D) root mass ratio (RMR), of A. umbellulata, A. caudata, A. tauschii, T. aestivum and T. durum. Error bars indicate s.e. (n = 8). See Results for statistical evaluation of the parameters.
LAR in the Aegilops species decreased as a result of the decreasing SLA (Fig. 4A), whereas LAR in the Triticum species increased, due to a stronger increase in LMR and a smaller decrease in SLA (Fig. 4B). At the start of the experimental period, the biomass allocation pattern of A. tauschii resembled that of the other Aegilops species: they allocated more to the leaf blades (high LMR) and leaf sheaths (high SMR) and less to the roots (low RMR) than the Triticum species did (Fig. 4B–D). At a later stage of their development, the biomass allocation pattern of A. tauschii resembled that of the two Triticum species: LMR and SMR increased with development while RMR deceased (Fig. 4B–D).
Photosynthetic characteristics
Table 2 shows the photosynthetic characteristics for the last fully expanded main stem leaf in all the species at the last harvest date. The Aegilops species had higher rates of photosynthesis per unit leaf area than the Triticum species, both at a PPFD of 430 µmol m–2 s–1 (A430), the light level at which the plants were grown, and at saturating light levels (Amax). The higher rates of photosynthesis per unit leaf area in Aegilops were associated with a higher nitrogen concentration, a higher Rubisco activity (Vc) and a higher electron transport activity (J) per unit leaf area than in Triticum. Per unit nitrogen, the rate of photosynthesis (A/N), Rubisco activity (Vc/N) and electron transport activity (J/N) were the same for the Triticum and Aegilops species, suggesting that similar proportions of leaf nitrogen were allocated to Rubisco and electron transport. Aegilops tauschii, the Aegilops species with the more rapidly elongating leaves, tended to have a lower leaf nitrogen concentration but a similar rate of photosynthesis per unit leaf area than the Aegilops species with the slowly elongating leaves. Aegilops caudata, on the other hand, had the highest N concentration of all the species in this study, without having a proportionately higher photosynthetic rate. As a result A/N, Vc/N and J/N were low compared with the other species.
Table 2.
Photosynthetic and associated parameters of the youngest fully expanded main stem leaf of three Aegilops and two Triticum species, at the last harvest date
| A. umbellulata | A. caudata | A. tauschii | T.aestivum | T. durum | |
| Leaf N (mmol m–2) | t173 ± 9ab | t189 ± 9a | t153 ± 5bc | t127 ± 3cd | t121 ± 4d |
| A430 (µmol m–2 s–1) | 22·6 ± 1·2a | 20·1 ± 1·1ab | 21·9 ± 1·4a | 16·7 ± 0·4bc | 14·9 ± 0·7c |
| Amax (µmol m–2 s–1) | 40·0 ± 0·6a | 34·6 ± 2·4b | 35·0 ± 2·2ab | 27·6 ± 0·2bc | 25·9 ± 0·9c |
| Vc (µmol m–2 s–1) | t174 ± 6a | t167 ± 3a | t159 ± 15a | t119 ± 2b | t120 ± 4b |
| J (µmol m–2 s–1) | t285 ± 4a | t237 ± 11ab | t246 ± 22a | t187 ± 4bc | t176 ± 9c |
| Amax/N (µmol mol–1 s–1) | t234 ± 9a | t176 ± 19b | t222 ± 8ab | t215 ± 7ab | t209 ± 7ab |
| Vc/N (mmol mol–1 s–1) | 1·01 ± 0·03a | 0·87 ± 0·04a | 1·04 ± 0·09a | 0·94 ± 0·01a | 0·99 ± 0·01a |
| J/N (mmol mol–1 s–1) | 1·66 ± 0·09a | 1·26 ± 0·09b | 1·60 ± 0·11ab | 1·48 ± 0·06ab | 1·45 ± 0·05ab |
Values of leaf nitrogen concentration per unit leaf area (leaf N), rate of photosynthesis at 430 µmol m–2 s–1 per unit leaf area (A430), rate of photosynthesis at 2000 µmol m–2 s–1 per unit leaf area (Amax) and per unit leaf nitrogen (Amax/N), Rubisco activity at 2000 µmol m–2 s–1 per unit leaf area (Vc) and per unit leaf nitrogen (Vc/N), and electron transport activity at 2000 µmol m–2 s–1 per unit leaf area (J) and per unit leaf nitrogen (J/N). Values are means ± s.e. (n = 3) and different letters indicate significant differences between species.
DISCUSSION
Relationship between LER, LED, leaf width and leaf position
Leaf area increased with leaf position on the main stem and tillers 1 and 2 in all the species in this study, and this pattern was strongly associated with increases in leaf elongation rate (LER) and leaf width. Although increases in leaf length and leaf width with leaf position have been shown before in cereal crop species (e.g. Williams and Rijven, 1965; Gallagher, 1979; Bos and Neuteboom, 1998), comparisons amongst species are scarce. Leaf width and LER increased more rapidly with leaf position in the species with the widest and longest leaves (A. tauschii, T. aestivum and T. durum) compared with the smaller‐leafed species (A. caudata and A. umbellulata), where LER and leaf width did not normally increase. Leaf elongation duration also increased with leaf position, albeit to a lesser extent than LER and leaf width, but this increase was not significantly different amongst these species and did not contribute to differences in leaf area amongst these species.
In a previous paper, the two‐fold differences in LER and leaf width of the third leaf on the main stem between A. caudata and A. tauschii were shown to be associated with a two‐fold difference in length and width of the leaf meristem (i.e. the number of dividing cells in length and width) (Bultynck et al., 2003). Moreover, Beemster et al. (1996) have shown an association between the LER in three successive leaves of wheat and the length of the respective leaf meristems. Possibly, the faster increase in length and width with leaf position in the rapidly elongating species in the present study resulted from a faster increase in leaf meristem size of successive leaves. In several cases, increases in LER and leaf width with leaf position have been associated with increases in apical dome size (Abbe et al., 1941; Kirby, 1974; Pieters and Van den Noort, 1988; Bos and Neuteboom, 1998). However, the results in the present study show that, at least in some of the species or in some of the tillers, the relative increase in LER with leaf position differed from that in leaf width, suggesting independent control of LER and leaf width. Beemster et al. (1996) also provide evidence for such an independent control, for leaves of wheat seedlings whose roots were growing in soils of differing physical resistance. The growing leaves in their study differed in the sensitivity of the number of formative divisions (determines number of parallel cell files and is related to leaf width) and of the number of proliferative divisions (determines number of cells along a cell file and is related to LER) to the treatment. In addition, Beemster and Masle (1996) showed that the reduction in leaf width that was induced by the treatment was not related to a reduction in apical dome size, but to changes in cellular processes that take place after leaf initiation.
Regulation of leaf and tiller appearance
Skinner and Nelson (1995) showed that initiation of leaf elongation in the youngest leaf primordium of tall fescue is synchronized with ligule initiation in the second youngest leaf, cessation of cell division in the sheath of the third oldest leaf, and initiation of tiller elongation at the axillary bud associated with that leaf. This close association between the development of successive leaves and their associated tillers may explain why very little variation in phyllochron, relative tillering rate and LED was found among the species in this study. Although the different species had similar relative tillering rates and the first tiller emerged at the same stage of development, the species differed in the time at which they reached this stage of development. Aegilops umbellulata, in particular, reached the four‐leaves stage at which tillering commences earlier than the others. This was due either to a difference in the timing of germination or in the rate of shoot development. The phyllochron, which gives an approximation of the developmental rate (McMaster, 1997), tended to be shorter in A. umbellulata compared with the other Aegilops species but was similar to that of the Triticum species, suggesting that A. umbellulata seeds germinated earlier.
Whole shoot leaf area expansion
Differences in individual leaf growth affected the relative leaf area expansion rate (RGRla) mainly during the very early growth stages. The faster increase in leaf area and leaf length with leaf position on the main stem of the rapidly expanding A. tauschii, T. durum and T. aestivum resulted in a higher RGRla during early growth than in the slow‐expanding A. umbellulata and A. caudata. As the increase in leaf elongation rate with leaf position slowed down, RGRla quickly declined in all species, showing that a linear increase in leaf area cannot lead to exponential growth without tillering (Van Loo, 1992; Groeneveld, 1998; Bultynck et al., 1999). In accordance with other studies on wheat (Longnecker et al., 1993; Rodríguez et al., 1998b; Miralles and Richards, 2000), the first tiller started to appear on all the species in this study when the third and fourth leaf on the main stem were growing. Tillering reduced the rate of decline in RGRla in Triticum but not in Aegilops, which was partly due to the slower increase in LER and leaf width with leaf position on the newly formed tillers of the Aegilops species. The slightly higher tillering rates of both Triticum species probably also played a role in this.
The species in the present study that had a higher RGRla (A. tauschii, T. aestivum and T. durum) also achieved a higher total leaf area early in development, which is also important in determining a high ground cover, final biomass and yield (López‐Castañeda et al., 1996). Several studies have shown that seed or embryo size is more important than RGR in determining plant and leaf size of seedlings (e.g. Chapin et al., 1989; López‐Castañeda et al., 1996; Van Rijn et al., 2000). Assuming that leaf width of the first seedling leaf is a good measure of embryo size (López‐Castañeda et al., 1996), this would suggest that the Triticum species had larger embryos than the Aegilops species (Fig. 1C). Despite its small embryo, A. tauschii achieved a larger total leaf area than the other Aegilops species early in development due to a higher RGRla, showing that a high RGRla can be important during early development.
Whole plant growth and biomass allocation
The faster increase in leaf area expansion with leaf position in A. tauschii, T. aestivum and T. durum, compared with A. umbellulata and A. caudata, is reflected in the higher leaf area ratio (LAR) in these species. Initially, the Triticum species had a low LAR because they invested proportionally more carbon in their roots (high RMR). However, upon elongation of the first few leaves of the Triticum species, the RMR quickly dropped below that of the Aegilops species, whereas the LAR increased to values considerably above those of the Aegilops species. It is likely that the high demand for carbon in the division and expansion zones of the growing leaves (Hu et al., 2000; Schäufele and Schnyder, 2001) resulted in more carbon being used in the shoot instead of going to the roots. A relatively high RMR for Aegilops compared with Triticum has been found before (Van den Boogaard and Villar, 1998) and may be an adaptation to dry and nutrient‐poor environments (Villar et al., 1998). In contrast with the Triticum species, A. tauschii had a high LAR at the start of the growing period, which quickly dropped below that of the Triticum species due to a decrease in SLA with development. SLA in the Triticum species, however, remained rather constant over the growing period. Species occurring in dry environments, such as Aegilops, probably benefit from making thicker leaves (lower SLA) (Lambers and Poorter, 1992).
The relatively larger investment in the Triticum species in leaf area (higher SLA), as opposed to leaf thickness or root mass (higher RMR), explains the lack of correlation observed between the rate of photosynthesis and shoot growth. A negative association between leaf area and the rate of photosynthesis per unit leaf area has been found by several authors in wheat cultivars as well as wheat ancestors (individual leaf area: Evans and Dunstone, 1970; Rawson et al., 1987; leaf area ratio: Van den Boogaard et al., 1997; total leaf area: Villar et al., 1998). Aegilops tauschii, however, was able to combine a high LAR with a relatively high NAR in the early developmental stage, through a combination of a low SLA and high leaf nitrogen concentrations which resulted in A. tauschii having higher nitrogen concentrations per unit leaf area, and hence higher photosynthetic rates per unit leaf area and a higher RGRdm compared with the Triticum species.
The rapidly growing A. tauschii, T. aestivum and T. durum have a higher SMR than the slowly growing species in this study, a relationship that was also found by Van den Boogaard and Villar (1998) in a comparison of 22 Aegilops species with ten Triticum cultivars. These authors suggested that gibberellins might be involved, as gibberellins have previously been associated with differences in RGR and SMR (Nagel et al., 2001). The results in the present study support such a hypothesis, since it was shown that the species with the highest SMR also have the fastest‐elongating leaves, while several authors have reported the important stimulating effect of gibberellins on leaf elongation rate (Tonkinson et al., 1995; Chandler and Robertson, 1999).
CONCLUSIONS
Of the Aegilops species used in the present study, only A. tauschii was able to reach the same high RGRla as the Triticum species. Moreover, in the early growth stages A. tauschii had an even higher LAR than the Triticum species, a trait that is related to high yield in cereal crops (López‐Castañeda et al., 1996), and it would be worthwhile to explore LAR further in more accessions of A. tauschii, the wild relative from which wheat inherited the D‐genome (Feldman and Sears, 1981). This study also leads to the conclusion that there is a large variation in leaf growth characteristics within the Aegilops genus, which makes this genus ideal for future experiments on the regulation of leaf growth.
ACKNOWLEDGEMENT
We thank Dr Erik Veneklaas for his valuable comments on a previous version of this manuscript.
Received: 24 November 2003; Returned for revision: 3 February 2004; Accepted: 3 March 2004, Published electronically: 20 May 2004
References
- AbbeEC, Randolph LF, Einset J.1941. The developmental relationship between shoot apex and growth pattern of leaf blade in diploid maize. American Journal of Botany 28: 778–784. [Google Scholar]
- BeemsterGTS, Masle J.1996. The role of apical development around the time of leaf initiation in determining leaf width at maturity in wheat seedlings (Triticum aestivum L.) with impeded roots. Journal of Experimental Botany 47: 1679–1688. [Google Scholar]
- BeemsterGTS, Masle J, Williamson RE, Farquhar GD.1996. Effects of soil resistance to root penetration on leaf expansion in wheat (Triticum aestivum L.): kinematic analysis of leaf elongation. Journal of Experimental Botany 47: 1663–1678. [Google Scholar]
- BosHJ, Neuteboom JH.1998. Growth of individual leaves of spring wheat as influenced by temperature and light intensity. Annals of Botany 81: 141–149. [Google Scholar]
- BultynckL, Fiorani F, Lambers H.1999. Control of leaf growth and its role in determining variation in plant growth rate from an ecological perspective. Plant Biology 1: 13–18. [Google Scholar]
- BultynckL, Fiorani F, Van Volkenburgh E, Lambers H.2003. Epidermal cell division and cell elongation in two Aegilops species with contrasting leaf elongation rates. Functional Plant Biology 30: 425–432. [DOI] [PubMed] [Google Scholar]
- ChandlerPM, Robertson M.1999. Gibberellin dose‐response curves and the characterization of dwarf mutants of barley. Plant Physiology 120: 623–632. [DOI] [PMC free article] [PubMed] [Google Scholar]
- ChapinFS, III, Groves RH, Evans LT.1989. Physiological determinants of growth rate in response to phosphorus supply in wild and cultivated Hordeum species. Oecologia 79: 96–105. [DOI] [PubMed] [Google Scholar]
- DamaniaAB.1993.Biodiversity and wheat improvement. Chichester: Wiley‐Sayce. [Google Scholar]
- De PuryDGG, Farquhar GD.1997. Simple scaling of photosynthesis from leaves to canopies without the errors of big‐leaf models. Plant, Cell & Environment 20: 537–557. [Google Scholar]
- EvansLT, Dunstone RL.1970. Some physiological aspects of evolution in wheat. Australian Journal of Biological Sciences 23: 725–741. [Google Scholar]
- FeldmanM, Sears ER.1981. The wild gene resources of wheat. Scientific American 244: 98–108. [Google Scholar]
- GallagherJN.1979. Field studies of cereal leaf growth. I. Initiation and expansion in relation to temperature and ontogeny. Journal of Experimental Botany 30: 625–636. [Google Scholar]
- GautierH, Varlet‐Grancher C.1996. Regulation of leaf growth of grass by blue light. Physiologia Plantarum 98: 424–430. [Google Scholar]
- GroeneveldHW.1998. Measuring the RGR of individual grass plants. Annals of Botany 82: 803–808. [Google Scholar]
- HuY, Schnyder H, Schmidhalter U.2000. Carbohydrate deposition and partitioning in elongating leaves of wheat under saline soil conditions. Australian Journal of Plant Physiology 27: 363–370. [Google Scholar]
- KirbyEJM.1974. Ear development in spring wheat. Journal of Agricultural Science 82: 437–447. [Google Scholar]
- KlepperB, Rickman RW, Peterson CM.1982. Quantitative characterization of vegetative development in small cereal grains. Agronomy Journal 74: 789–792. [Google Scholar]
- LambersH, Poorter H.1992. Inherent variation in growth rate between higher plants: a search for physiological causes and ecological consequences. Advances in Ecological Research 23: 187–261. [Google Scholar]
- LemerleD, Gill GS, Murphy CE, Walker SR, Cousens RD, Mokhtari S, Peltzer SJ, Coleman R, Luckett DJ.2001. Genetic improvement and agronomy for enhanced wheat competitiveness with weeds. Australian Journal of Agricultural Research 52: 527–548. [Google Scholar]
- LongneckerN, Kirby EJM, Robson A.1993. Leaf emergence, tiller growth, and apical development of nitrogen‐deficient spring wheat. Crop Science 33: 154–160. [Google Scholar]
- López‐CastañedaC, Richards RA, Farquhar GD, Williamson RE.1996. Seed and seedling characteristics contributing to variation in early vigor among temperate cereals. Crop Science 36: 1257–1266. [Google Scholar]
- McMasterGS.1997. Phenology, development, and growth of the wheat (Triticum aestivum L.) shoot apex: a review. Advances in Agronomy 59: 63–118. [Google Scholar]
- MasleJ.2000. The effects of elevated CO2 concentrations on cell division rates, growth patterns, and blade anatomy in young wheat plants are modulated by factors related to leaf position, vernalization, and genotype. Plant Physiology 122: 1399–1415. [DOI] [PMC free article] [PubMed] [Google Scholar]
- MirallesDJ, Richards RA.2000. Responses of leaf and tiller emergence and primordium initiation in wheat and barley to interchanged photoperiod. Annals of Botany 85: 655–663. [Google Scholar]
- NagelOW, Konings H, Lambers H.2001. Growth rate and biomass partitioning of wildtype and low‐gibberellin tomato (Solanum lycopersicum) plants growing at a high and low nitrogen supply. Physiologia Plantarum 111: 33–39. [Google Scholar]
- PietersGA, Van den Noort ME.1988. Effect of irradiance and plant age on the dimensions of the growing shoot of poplar. Physiologia Plantarum 74: 467–472. [Google Scholar]
- PoorterH, Lewis C.1986. Testing differences in relative growth rate: a method avoiding curve fitting and pairing. Physiologia Plantarum 67: 223–226. [Google Scholar]
- PoorterH, Remkes C.1990. Leaf area ratio and net assimilation rate of 24 wild species differing in relative growth rate. Oecologia 83: 553–559. [DOI] [PubMed] [Google Scholar]
- RadfordPJ.1967. Growth analysis formulae – their use and abuse. Crop Science 7: 171–175. [Google Scholar]
- RawsonHM, Gardner PA, Long MJ.1987. Sources of variation in specific leaf area in wheat grown at high temperature. Australian Journal of Plant Physiology 14: 287–298. [Google Scholar]
- RawsonHM, Hindmarsh JH, Fischer RA, Stockman YM.1983. Changes in leaf photosynthesis with plant ontogeny and relationships with yield per ear in wheat cultivars and 120 progeny. Australian Journal of Plant Physiology 10: 503–514. [Google Scholar]
- RichardsRA, Rebetzke GJ, Condon AG, van Herwaarden AF.2002. Breeding opportunities for increasing the efficiency of water use and crop yield in temperate cereals. Crop Science 42: 111–121. [DOI] [PubMed] [Google Scholar]
- RodríguezD, Keltjens WG, Goudriaan J.1998a. Plant leaf area expansion and assimilate production in wheat (Triticum aestivum L.) growing under low phosphorus conditions. Plant and Soil 200: 227–240. [Google Scholar]
- RodríguezD, Pomar MC, Goudriaan J.1998b. Leaf primordia initiation, leaf emergence and tillering in wheat (Triticum aestivum L.) grown under low phosphorous conditions. Plant and Soil 202: 149–157. [Google Scholar]
- SchäufeleR, Schnyder H.2001. Carbon and nitrogen deposition in expanding tissue elements of perennial ryegrass (Lolium perenne L.) leaves during non‐steady growth after defoliation. Plant, Cell and Environment 24: 407–417. [Google Scholar]
- SkinnerRH, Nelson CJ.1995. Elongation of the grass leaf and its relationship to the phyllochron. Crop Science 35: 4–10. [Google Scholar]
- TonkinsonCL, Lyndon RF, Arnold GM, Lenton JR.1995. Effect of the Rht3 dwarfing gene on dynamics of cell extension in wheat leaves, and its modification by gibberellic acid and paclobutrazol. Journal of Experimental Botany 46: 1085–1092. [Google Scholar]
- VandenBoogaardR, Villar R.1998. Variation in growth and WUE – a comparison of Aegilops L. species and Triticum aestivum L. cultivars. In: Lambers H, Poorter H, Van Vuuren M, eds. Inherent variation in plant growth. Physiological mechanisms and ecological consequences Leiden: Backhuys Publishers, 289–308. [Google Scholar]
- VandenBoogaardR, Alewijnse D, Veneklaas EJ, Lambers H.1997. Growth and water use efficiency of ten Triticum aestivum L. cultivars at different water availability in relation to allocation of biomass. Plant, Cell & Environment 20: 200–210. [Google Scholar]
- VandenBoogaardR, de Boer M, Veneklaas EJ, Lambers H.1996a. Relative growth rate, biomass allocation pattern and water use efficiency of three wheat cultivars during early growth as dependent on water availability. Physiologia Plantarum 98: 493–504. [Google Scholar]
- VandenBoogaardR, Veneklaas EJ, Peacock J, Lambers H.1996b. Yield and water use of wheat (Triticum aestivum L.) cultivars in a Mediterranean environment: effects of water availability and sowing density. Plant and Soil 181: 251–262. [Google Scholar]
- VanLooEN.1992. Tillering, leaf expansion and growth of plants of two cultivars of perennial ryegrass using hydroponics at two water potentials. Annals of Botany 70: 511–518. [Google Scholar]
- VanRijnCPE, Heersche I, Van Berkel YEM, Nevo E, Lambers H, Poorter H.2000. Growth characteristics in Hordeum spontaneum populations from different habitats. New Phytologist 146: 471–481. [Google Scholar]
- VanSlagerenMW.1994.Wild wheats: a monograph of Aegilops L. and Amblyopyrum (Jaub. & Spach) Eig (Poaceae). Wageningen: Agricultural University. [Google Scholar]
- VillarR, Veneklaas EJ, Jordano P, Lambers H.1998. Relative growth rate and biomass allocation in 20 Aegilops (Poaceae) species. New Phytologist 140: 425–437. [DOI] [PubMed] [Google Scholar]
- VonCaemmererS, Farquhar GD.1981. Some relationships between the biochemistry of photosynthesis and the gas exchange of leaves. Planta 153: 376–387. [DOI] [PubMed] [Google Scholar]
- VonCaemmererS, Evans JR, Hudson GS, Andrews TJ.1994. The kinetics of ribulose‐1,5‐biphosphate carboxylase/oxygenase in vivo inferred from measurements of photosynthesis in leaves of transgenic tobacco. Planta 195: 88–97. [Google Scholar]
- WilliamsRF, Rijven AHGC.1965. The physiology of growth in the wheat plant. II. The dynamics of leaf growth. Australian Journal of Biological Sciences 18: 721–743. [Google Scholar]
- WullschlegerSD.1993. Biochemical limitations to carbon assimilation in C3 plants – a retrospective analysis of the A/Ci curves from 109 species. Journal of Experimental Botany 44: 907–920. [Google Scholar]