

Abstract
• Background and Aims Fractal analysis allows calculation of fractal dimension, fractal abundance and lacunarity. Fractal analysis of plant roots has revealed correlations of fractal dimension with age, topology or genotypic variation, while fractal abundance has been associated with root length. Lacunarity is associated with heterogeneity of distribution, and has yet to be utilized in analysis of roots. In this study, fractal analysis was applied to the study of root architecture and acquisition of diffusion‐limited nutrients. The hypothesis that soil depletion and root competition are more closely correlated with a combination of fractal parameters than by any one alone was tested.
• Model The geometric simulation model SimRoot was used to dynamically model roots of various architectures growing for up to 16 d in three soil types with contrasting nutrient mobility. Fractal parameters were calculated for whole roots, projections of roots and vertical slices of roots taken at 0, 2·5 and 5 cm from the root origin. Nutrient depletion volumes, competition volumes, and relative competition were regressed against fractal parameters and root length.
• Key Results Root length was correlated with depletion volume, competition volume and relative competition at all times. In analysis of three‐dimensional, projected roots and 0 cm slices, log(fractal abundance) was highly correlated with log(depletion volume) when times were pooled. Other than this, multiple regression yielded better correlations than regression with single fractal parameters. Correlations decreased with age of roots and distance of vertical slices from the root origin. Field data were also examined to see if fractal dimension, fractal abundance and lacunarity can be used to distinguish common bean genotypes in field situations. There were significant differences in fractal dimension and fractal abundance, but not in lacunarity.
• Conclusions These results suggest that applying fractal analysis to research of soil exploration by root systems should include fractal abundance, and possibly lacunarity, along with fractal dimension.
Key words: Fractal dimension, fractal abundance, lacunarity, phosphorus, depletion, competition, Phaseolus vulgaris, SimRoot, simulation modelling
INTRODUCTION
Annual crops produce several orders of roots as fine as a fraction of a millimetre in diameter, with a distance between branches ranging from millimetres to centimetres. With these branching patterns, roots can be characterized by fractal analysis over a range of scales from about a quarter of a millimetre to several centimetres (Tatsumi et al., 1989). The fractal dimension (FD) has been calculated for whole root systems (Tatsumi et al., 1989), as well as for separated branches (Lynch and van Beem, 1993) and planar sections (Nielsen et al., 1997; Eshel, 1998). In computer simulations, FD of planar sections was correlated with the FD of entire root systems (Nielsen et al., 1997), so analysing subsamples may be appropriate for roots, which are often difficult to observe entirely intact.
A number of researchers have demonstrated that fractal analysis may be biologically relevant. Many aspects of morphological and physiological variation have been associated with variation in FD. As roots grow, the FD increases (Fitter and Stickland, 1992; Lynch and van Beem, 1993; Nielsen et al., 1998). Fractal dimension has been correlated with root topology (Fitter and Stickland, 1992) and root architecture (Nielsen et al., 1997). Differences in FD have been noted among four species of dicots and monocots (Fitter and Stickland, 1992), as well as among genotypes of sorghum, rice and common bean (Izumi et al., 1995; Masi and Maranville, 1998; Nielsen et al., 1998). Genotypic variation of root mass and root : shoot ratio was correlated with variation in FD of roots (Masi and Maranville, 1998). Lastly, FD has been observed to vary with nitrogen availability for corn (Eghball et al., 1993), and phosphorus acquisition from low phosphorus soils in common bean (Nielsen et al., 1998).
Most research to date has focused on FD, even though other parameters can be easily calculated from the same data. Therefore, it remains unclear if FD is sufficient or the most appropriate aspect of fractal analysis that can be applied to the study of root system morphology and functioning. While FD appears to be a useful metric in some situations, there are more aspects of fractal analysis that might also be useful.
Fractal analysis in root biology typically utilizes box counting and the equation:
N(L) = KL–D(1)
where L is the box size, and N(L) is the number of boxes of size L needed to cover the object. A log–log plot of N(L) versus L; Returns –D as the slope and log K as the intercept. In terms of fractal analysis, D is the fractal dimension, and log K has been associated with fractal abundance (FA) (Puche and Su, 2001a, b). Fractal dimension is associated with the branching pattern, while FA is associated with the volume of space explored. To date, FD has been studied far more than FA in the plant sciences. Yet, it has been shown that FA may vary when fractal dimension does not. Corn roots that vary in size can have equivalent FD, but vary in FA (Eghball et al., 1993). Masi and Maranville (1998) speculated that FA might differentiate root systems with regard to their ability to exploit the soil profile, even when the FD are similar. However, no observations were made to test this speculation. Puche and Su (2001a, b) showed that the FD describes the intricacy of termite tunnels, while FA is associated with population density and foraging behaviour. There could be an analogous situation with plants roots, whereby FD describes the branching pattern, while FA is associated with the size of the root system and extent of soil explored.
Another parameter that can be calculated in fractal analysis that might be useful in distinguishing objects of similar FD is lacunarity (L), which is a measure of the structural heterogeneity within an object (Smith et al., 1996). When the box counting method is used, L is an estimate of the variation of how many root segments are contained in the boxes. For example, some boxes might cover one root segment while other boxes cover ten root segments. The FD does not account for this variation, but L does. One measure of L is the coefficient of variation, which is the standard deviation divided by the mean of the number of root segments per box. This is the measure of L that is used in this paper. It is likely to be complementary to FD, and may or may not be a substitute or complement of FA.
The objective of this project was to determine the most appropriate fractal parameters to calculate how effectively root systems explore the soil. To simplify the discussion, phosphorus (P) will be the focus of this explanation. Diffusion‐limited elements, such as P, move slowly through soil (Schenk and Barber, 1979), so soil volumes in the immediate vicinity of roots are often depleted of P, while bulk soil 1–2 cm away has P concentrations that remain largely unchanged. The soil that has had P concentration decreased by root uptake is referred to as the depletion volume, the size of which is proportional to the rate of diffusion of P through the soil. Some soil is depleted of P by more than one root from a single plant. The volume of soil explored by multiple roots is defined as competition volume. Since competition volume increases as the root system grows, it is often useful to calculate relative competition, which in this report is competition volume divided by depletion volume. Using these concepts of depletion and competition, P efficiency can be defined as minimization of relative competition. This definition has been used in geometric modelling to evaluate the P efficiency of contrasting root architectures (Ge et al., 2000; Rubio et al., 2001), which has been correlated with the ability of plants to maintain growth under low P conditions in glasshouse and field environments (Lynch and Brown, 2001; Rubio et al., 2003). The FD of planar root sections can differentiate P‐efficient and P‐inefficient genotypes of common bean (Nielsen et al., 1998). Neither FA nor L was included in these studies, so the question of whether these terms can improve our understanding of phosphorus‐acquisition efficiency remains.
Root systems can vary significantly in size and FA, yet have similar FD (Eghball et al., 1993). Therefore, a hypothesis tested in this study is that FD and FA are correlated with complementary aspects of uptake of diffusion‐limited nutrients. Specifically, FA is correlated with absolute measures of soil exploration, such as depletion and competition volume, while FD is correlated with relative competition. Furthermore, with slow diffusion of nutrients, and, therefore low inter‐root competition (Ge et al., 2000; Rubio et al., 2001), root length is likely to be a better estimate of depletion and competition than fractal abundance. As diffusion rate increases, and more inter‐root competition results, FA may become a better estimate of depletion than root length.
The possible utility of lacunarity is not as clear. A low value of L implies homogeneity, which may be associated with roots that are uniformly distributed with either high or low competition. Therefore it is hypothesized that L alone is not well correlated with estimates of soil exploration, but it may be useful as a complement to FD or FA in multiple regression to significantly increase correlations with estimates of soil exploration.
Since three‐dimensional (3D) root architecture and nutrient depletion are not readily observable in field or glasshouse conditions, the geometric simulation model SimRoot was employed (Lynch et al., 1997), and output was imported into associated programs for numerical determination of soil depletion and fractal analysis. Fractal dimensions of entire root systems have been correlated with dimensions of root projections and planar sections (Nielsen et al., 1997), so simulations included 3D root systems, projections of root systems and 0·1 cm vertical slices taken from three positions. Empirical data were also examined to see if FD, FA and L could be used to differentiate common bean genotypes that varied in shoot mass and competitiveness in medium and high P field conditions.
MATERIALS AND METHODS
Description of root model and input
The dynamic geometric model SimRoot (Lynch et al., 1997) was used to simulate root growth and architecture. Time, adventitious root number, basal root gravitropism, and basal lateral root density were varied as described in Table 1 to produce 360 root models. Each root type was modelled in three soil types that varied in diffusion coefficient (De), producing a total of 1080 simulations. An illustration of simulated roots with 15 adventitious roots showing all time points and basal root angles is shown in Fig. 1.
Table 1.
Root growth parameters used in simulations of bean root growth
| Time (h/d) | 192/8 | 240/10 | 288/12 | 336/14 | 384/16 | |
| De (cm2 s–1)* | 10–7 | 10–8 | 10–9 | |||
| Seed depth (cm) | 5 | |||||
| Adventitious number | 0 | 5 | 10 | 15 | 20 | 25 |
| Basal root architecture† | Shallow | Intermediate | Deep | |||
| Basal lateral internode length (cm) | 0·25 | 0·35 | 0·50 | 0·75 |
* Diffusion coefficient of mineral nutrient through soil, based on Schenk and Barber (1979).
† Based on Ge et al. (2000).

Fig. 1. Geometric models of common bean root systems generated by SimRoot. Pictured roots have 15 adventitious roots and a basal lateral branch spacing of 0·5 cm. Lines differ in basal root depth. Numbers under columns indicate time after germination in hours. Scale bar has tick marks every 5 cm.
Root length and soil depletion volumes
Root length and total depletion volume with overlap (Vt) were calculated by SimRoot. The depletion volume calculation has been published (Ge et al., 2000). It is the sum of depletion over all root segments, which are individually calculated as cylindrical volume:
V = πRdz2l(2)
where l is the segment length and Rdz is the depletion radius. The depletion radius is calculated by using the equation:
Rdz = r + 2(Det)½(3)
where r is the root radius, t is time in seconds, and De is the diffusion coefficient in cm2 s–1.
Output from Simroot was analysed in DepZone to determine actual depletion volume (Va) by subtracting duplications of overlapped volume as previously described (Ge et al., 2000; Rubio et al., 2001). Competition volume is defined as:
Cv = Vt – Va(4)
and relative competition is:
Cr = 100(Vt – Va)/Va(5)
Fractal analysis
Fractal analysis of simulated roots was performed in a C program written to analyse output from SimRoot. Box counting was used to calculate FD and FA. Preliminary simulations showed that box sizes from 0·25 to 4·55 cm were appropriate for this analysis. A scaling factor of 1·25 between box sizes was used to provide 14 box sizes for the analysis. Both FD and FA are defined as previously reported (Eghball et al., 1993; Masi and Maranville, 1998), which is shown in eqn (1).
When root systems are covered with boxes, not all boxes contain the same amount of roots. A measure of this variation is lacunarity (Smith et al., 1996). In this study, lacunarity was defined as the coefficient of variation of the amount of roots per box, i.e. the standard deviation of amount of roots per box was divided by the mean. Lacunarity was calculated in this manner for each box size, and the average of these 14 estimates was used as the overall lacunarity that was used to analyse and compare root systems.
Fractal analysis for whole roots was performed with the intact 3D root systems, and for projections of root systems onto a two‐dimensional (2D) plane. Projections were simulated by taking 3D root output from SimRoot and setting all X equal to 0. Two‐dimensional slices were also analysed by simulating 0·1‐cm vertical slices of roots taken at 0, 2·5, and 5 cm from the seed position. Root projections and root segments within the slices were analysed in a 2D box counting program that used the same range of box sizes as were used for 3D analysis.
Field study
Data from a field study were re‐examined to test the utility of fractal analysis. Details of the experiment have been published (Rubio et al., 2003). Common bean recombinant inbred lines (RILs) from parents that varied in rooting depth and ability to maintain growth in low P conditions were grown in high and medium P conditions in the field in South China. After 5 weeks, trenches were dug 10 cm from the row and root positions were marked on plastic sheets. The results, in short, were that two P‐efficient RILs had more shallow roots than two P‐inefficient RILs, and P‐efficient RILs out‐competed P‐inefficient RILs in medium P plots where they were grown together.
For this study, plastic sheets that had been marked with intercepts of roots with trench faces were scanned and saved in TIF format. Image J (developed at the US National Institutes of Health and available on the internet at http://rsb.info.nih.gov/ij/) was used in Windows XP to remove extraneous markings and to output text files containing coordinates of roots. These text files were then analysed for FD, FA and L in a fractal analysis program written in C that counts boxes in two dimensions. Because of limited resolution of field measurements, seven box sizes were used ranging in size from 1·25 to 4·77 cm, with successive box sizes varied by a factor of 1·25.
Data analysis
Regression analyses were conducted in StatView, Version 5·0.1 (SAS Institute Inc, Cary, NC, USA). Simulation data were analysed by simple and multiple regression of depletion volume, competition volume and relative competition against root length, FD, FA and L. Fractal parameters calculated for root projections and 2D intersections were regressed with the fractal parameters derived from 3D root systems. Regressions were carried out for all time points pooled together to test for general trends, as well as for data from each time point to simulate single harvest dates. Coefficients of simple determination (r2) and multiple determination (R2) (Neter et al., 1989) for combinations of fractal parameters were calculated to decide when root length, FD, FA and L are relevant for understanding nutrient acquisition. Field data were analysed by a general linear model analysis of variance in the SAS System for Windows, Release 8·02 with the dependent variables FD, FA and L, and independent variables RIL and P treatment. Mean separation was evaluated by the least squares mean procedure including main effects and the interaction of RIL with P.
RESULTS
Correlation among fractal parameters
Scatter plots of FD, FA and L from analyses of 3D and 2·5‐cm planar intersections are presented in Fig. 2. Fractal dimension had low correlations with FA and L in 3D (r2 < 0·25), while there was a somewhat greater correlation between FD and L in projected roots (0·36 < r2 <0·60), as well as between FD and FA in planar intersections, with the highest correlation in intersections 2·5 cm from the root origin (0·44 < r2 < 0·68). Fractal abundance was highly correlated with L in 3D or projected roots when analysed at individual time points (0·78 < r2 < 0·95), but not when all times were pooled (r2 < 0·33). In contrast, FA was more closely correlated with L in planar intersections when times are pooled (r2 ∼0·5) than in individual time points (0·00 < r2 < 0·49).

Fig. 2. Scatter plots of fractal dimension, fractal abundance and lacunarity of simulated root systems. Values shown are for 3D root systems (top) and a vertical slice of the root system taken 2·5 cm from the root origin (bottom). Different symbols indicate different times (h).
Fractal dimensions from root projections and 2·5‐cm planar intersections were correlated well with 3D FD across all sampling times (Fig. 3). Fractal dimensions from 0 and 5‐cm intersections had correlations with 3D FD that increased with time, but were always less than the correlations between 3D FD and root projections or 2·5‐cm intersections. Fractal abundance from root projections and all planar intersections was highly correlated with 3D FA when all time points were pooled (Fig. 3). Only FA from root projections was correlated with 3D FA when data were analysed from individual time points. Only L from root projections was correlated with 3D L (Fig. 3), and this correlation decreased over time, or by pooling time.

Fig. 3. Coefficient of simple determination (r2) between fractal parameters calculated for 3D root systems and for projection and vertical planar intersections at 0, 2·5 and 5 cm from root origin.
Correlations with depletion volume
Scatter plots for depletion volume versus root length and 3D fractal parameters are presented in Fig. 4. The diffusion coefficient had some effect on the value of the correlations, but not on the patterns among fractal parameters or across time. For example, r2 for correlation of root length with depletion volume ranged from 0·90 to 0·93 across diffusion coefficients tested, while r2 for the correlation of fractal abundance with depletion volume ranged from 0·83 to 0·85. Therefore, only the results for De = 10–8 are presented.
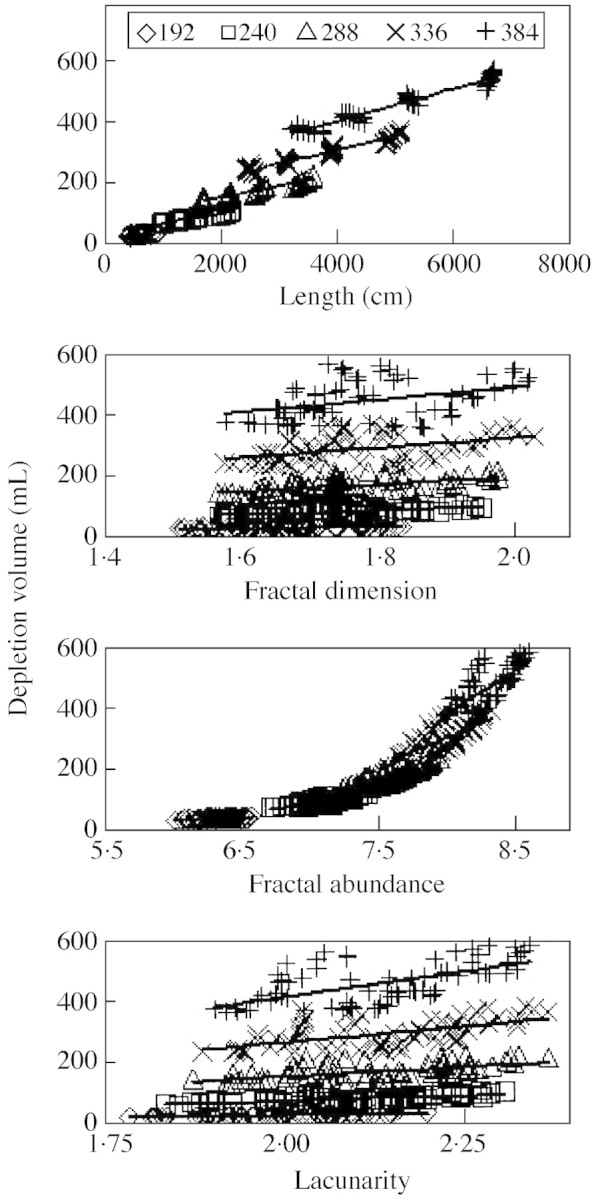
Fig. 4. Depletion volume versus root length, fractal dimension, fractal abundance and lacunarity. Diffusion coefficient equals 10–8 cm2 s–1. Each figure contains data from 360 simulations with five times (192, 240, 288, 336, 384 h from germination), three basal root angles (shallow, medium, deep), four basal lateral densities (0·25, 0·35, 0·5, 0·75 cm), and six adventitious numbers (0, 5, 10, 15, 20, 25). Regression lines are fitted for each time.
In simple regressions of 3D data, length had better correlation with depletion volume than any of the fractal parameters when time points are analysed separately (Figs 4 and 5). The correlation of FA with depletion volume improved as De increases, and the correlation of root length with depletion decreased with increasing De, but the correlation of depletion with root length remained better than that for depeletion volume with FA over all De simulated (not shown).

Fig. 5. Coefficient of simple determination (r2) or multiple determination (R2) for correlation of depletion volume with root length, fractal dimension, fractal abundance and lacunarity. Times 240 and 336 are omitted for clarity. * Fractal abundance and depletion volume are untransformed when time points are analysed separately, but they are each log‐transformed when time points are pooled.
When time data were separated, all plots were linear, but when time data were pooled, the plot of depletion volume with FA became nonlinear (Fig. 4). To make it linear, a log–log transformation was employed. The correlation of log(depletion volume) with log(FA) using pooled data was at least as high as any other simple correlation tested for depletion volume (Fig. 5).
Multiple regression improved correlations of fractal parameters with depletion volume for 3D and root projection data over all separately analysed time points (Fig. 5). Correlations in planar intersection data were also improved by using multiple regression, but the benefit decreased with time and distance from the root origin (Fig. 5). For pooled time data, only in 5‐cm intersections did multiple regression make correlations equivalent to the regression of log(depletion volume) with log(FA). Using all three fractal parameters in multiple regression did not improve correlations for 3D, projection or any planar intersection data (not shown).
Correlations with competition volume
Scatter plots for competition volume versus root length and fractal parameters are presented in Fig. 6. The diffusion coefficient had some effect on the correlations, but not on the patterns among fractal parameters or across time, so only the results for De = 10–8 are presented.

Fig. 6. Competition volume versus root length, fractal dimension, fractal abundance and lacunarity. Diffusion coefficient equals 10–8 cm2 s–1. Regression lines are fitted for each time.
Root length had better correlation with competition volume than any of the 3D fractal parameters, at each separately analysed time point (Figs 6 and 7). Simple regression of FD, FA or L with competition volume at any one time point was much worse than the regression of length with competition volume. When time data were pooled, the plot of competition volume with FA was nonlinear (Fig. 6). To make it linear, a log–log transformation was employed. The regression of log(competition volume) with log(FA) using pooled data resulted in correlation that was equivalent to the correlation between length and competition volume in 3D, and at least as good as any other correlations for projection and planar intersection data (Fig. 7).

Fig. 7. Coefficient of simple determination (r2) or multiple determination (R2) for correlation of competition volume with root length, fractal dimension, fractal abundance and lacunarity. Times 240 and 336 are omitted for clarity. * Fractal abundance and competition volume are untransformed when time points are analysed separately, but they are each log‐transformed when time points are pooled.
Multiple regression improved correlations for 3D fractal data with competition volume to the extent that fractal parameters became equivalent to root length at any single time point (Fig. 7). There was also an improvement of correlations using root projection data over all time points. Correlations in planar intersection data were improved by using multiple regression, but the benefit decreased with time and distance from the root origin (Fig. 7). For pooled time data, only in 5‐cm intersections did multiple regression make correlations equivalent to the log(competition volume) with log(FA) regression. Using all three fractal parameters in multiple regression did not improve correlations for 3D, projection, or any planar intersection data (not shown).
Correlations with relative competition
Scatter plots for relative competition versus root length and fractal parameters are presented in Fig. 8. The diffusion coefficient had some effect on the correlations, but not on the patterns among fractal parameters or across time, so only the results for De = 10–8 are presented.

Fig. 8. Relative competition versus root length, fractal dimension, fractal abundance and lacunarity. Diffusion coefficient equals 10–8 cm2 s–1. Regression lines are fitted for each time.
Root length had better correlation with relative competition than any single 3D fractal parameter, regardless of time (Figs 8 and 9). Correlation of FD with relative competition improved with time, and became similar to the correlation of root length with relative competition when time was pooled. Multiple regression improved correlations for 3D fractal data with relative competition, to the extent that fractal parameters became slightly better than root length (Fig. 9). There was also an improvement of correlations using multiple regression with root projection data over all time points. Correlations in planar intersection data were improved by using multiple regression, but the benefit decreased with time and distance from the root origin (Fig. 9). Using all three fractal parameters in multiple regression did not improve correlations for 3D, projection or any planar intersection data (not shown).

Fig. 9. Coefficient of simple determination (r2) or multiple determination (R2) for correlation of relative competition with root length, fractal dimension, fractal abundance and lacunarity. Times 240 and 336 are omitted for clarity.
Field measurements
There were significant differences (critical P = 0·1) in FD among genotypes, but not between P treatments (Fig. 10). Genotypic and P effects were observed with FA (Fig. 10). The P‐efficient RILS, 7 and 17, had the higher FD and FA in comparison with the matched P‐inefficient RILs, 38 and 24, respectively. The P‐inefficient RIL 38 had significantly lower FD and FA than RIL 7 in medium P. In the other test, the P‐inefficient RIL 24 had lower FD than the efficient RIL 17 in both medium and high P, along with a lower FA in high P. The FD and FA of mixed plots were always similar to the values obtained from plots of the P‐efficient RIL grown in monoculture. Lacunarity did not vary except for a significantly lower L of RILs 7 and 38 grown together in high P compared with RIL 7 grown in monoculture in medium P.

Fig. 10. Fractal analysis of root trench data from four RILs grown in the field in South China (Rubio et al., 2003). Error bars represent standard error of the mean. Bars within a single graph with the same letter above are not significantly different when compared by LSMean separation with critical P = 0·10.
DISCUSSION
This study provides evidence that fractal analysis can be improved by including FA or L along with FD when conducting research with plant roots. Fractal dimension has been correlated with topological and architectural traits (Fitter et al., 1992; Lynch and van Beem, 1993), but the physiological significance of these correlations has not been clearly established. Here, it is shown that fractal parameters may be correlated with uptake of diffusion‐limited nutrients. Fractal dimension is most closely correlated with relative competition, while fractal abundance is most closely correlated with depletion volume. This is in accordance with the hypothesis presented in the Introduction that FD is associated with relative measures of exploration, while FA is associated with absolute measures.
The most relevant application of fractal analysis to the study of roots appears to be when more than one fractal parameter is used. Lacunarity alone appears to be of little use, but when combined with FD or FA, it may add significantly to correlations with measures of soil exploration. Similarly, FD alone has poor correlation with measures of soil exploration, but it adds significantly to correlations when combined with FA or L.
The only fractal parameter that appears to be useful by itself is FA, and then only when data from root harvests over time are combined. In these situations, log(FA) might be a relevant parameter to explore as a variable that can explain differences in nutrient acquisition. When roots of one age are observed, FA may be of most use when combined with FD or L.
The hypothesis that depletion volume is more closely correlated with root length at low diffusion coefficients, and with fractal abundance at high diffusion coefficients was not observed with the diffusion coefficients tested in this study. Root length was highly correlated with depletion volume and competition volume regardless of diffusion coefficient. Therefore, root length may always be relevant for understanding soil depletion and root exploration. However, it is often difficult to measure. In this study, evidence is presented that fractal analysis of planar intersect data can be correlated with soil exploration. Planar intersection data appears to be most suitable when collected from <5 cm from the stem and early in the season, or with collection dates spread out over a week or more. Further testing in field situations would help clarify the validity and accuracy of these conclusions.
Field data provided some support for the validity of the modelling results. In spite of being collected at 5 weeks and from trenches 10 cm distant from the row, the analysed field data revealed genotypic variation for FD and FA. In addition, genotypes that are efficient in P acquisition had the highest FD and FA, which is consistent with hypothesized correlations of FD and FA with spatial exploration, as well as previous results (Nielsen et al., 1998). Finally, L varied in only one case. This is consistent with the fact that heterogeneity of root distribution is not necessarily related to exploration efficiency. Modelling indicated that there could be situations where FA or L correspond with genotypic variation when FD does not. For example, increased basal root gravitropism could be offset by decreased lateral root density. In that case FD would remain constant, while FA would decrease. No trends like this were observed in this limited field study. Inclusion of more genotypes would increase the chances of observing such cases.
The correlation of projection and planar intersection FD with 3D FD confirms and extends previous results (Nielsen et al., 1997). The previous results were for horizontal slices, while the results in this study are for vertical slices. The combination of these results indicates that planar FD can be correlated with 3D FD by slicing either way. On the other hand, 3D FA and L are correlated with projection FA and L, but not with planar intersection FA and L. This suggests that fractal analysis of 2D intersections may be good for estimating 3D FD, but not 3D FA or L. However, correlations with depletion and competition are still improved by calculating all three fractal parameters from planar intersections. In the field, genotypic and nutrient availability differences may be associated with differences in FD and FA calculated from the intersection of roots with trench faces.
In summary, this study supports previous reports of the validity of applying fractal analysis to the study of plant roots, and it extends our understanding of how the analysis applies to the biology of nutrient acquisition. Two parameters that are frequently neglected in fractal analysis, FA and L, significantly improve the relevance of fractal analysis for understanding biological functioning. In addition, FA and L are easily calculated using data and methods that are used for calculating FD. Plus, situations might arise where FA or L can differentiate among treatments that are not resolvable by FD. Therefore, future fractal analysis of plant root systems may be most appropriately conducted when fractal abundance or lacunarity is calculated along with fractal dimension.
ACKNOWLEDGEMENTS
We thank Mayuki Tanaka for insightful discussion of fractal analysis, particularly regarding lacunarity, and Howie Weiss who provided comments on theoretical aspects of fractal analysis. This research was supported by the National Science Foundation under Grant No. 9602255 and by a NASA Space Grant Fellowship administered through the Pennsylvania Space Grant Consortium.
Received: 22 December 2003; Returned for revision: 9 February 2004; Accepted: 13 March 2004. Published electronically: 14 May 2004
References
- EghballB, Settimi JR, Maranville JW, Parkhurst AM.1993. Fractal analysis for morphological description of corn roots under nitrogen stress. Agronomy Journal 85: 287–289. [Google Scholar]
- EshelA.1998. On the fractal dimensions of a root system. Plant Cell and Environment 21: 247–251. [Google Scholar]
- FitterAH, Stickland TR.1992. Fractal characterization of root‐system architecture. Functional Ecology 6: 632–635. [Google Scholar]
- GeZY, Rubio G, Lynch JP.2000. The importance of root gravitropism for inter‐root competition and phosphorus acquisition efficiency: results from a geometric simulation model. Plant and Soil 218: 159–171. [DOI] [PubMed] [Google Scholar]
- IzumiY, Kono Y, Yamauchi A, Iijima M1995. Analysis of timecourse changes in root‐system morphology of rice in excised root culture. Japanese Journal of Crop Science 64: 636–643. [Google Scholar]
- LynchJ, van Beem JJ.1993. Growth and architecture of seedling roots of common bean genotypes. Crop Science 33: 1253–1257. [Google Scholar]
- LynchJP, Brown KM.2001. Topsoil foraging: an architectural adaptation to low phosphorus availability. Plant and Soil 237: 225–237. [PubMed] [Google Scholar]
- LynchJP, Nielsen KL, Davis RD, Jablokow AG.1997. SimRoot: modelling and visualization of root systems. Plant and Soil 188: 139–151. [Google Scholar]
- MasiCEA, Maranville JW.1998. Evaluation of sorghum root branching using fractals. Journal of Agricultural Science 131: 259–265. [Google Scholar]
- NeterJ, Wasserman W, Kutner MH.1989.Applied linear regression models, 2nd edn. Homewood, IL: Richard D. Irwin. [Google Scholar]
- NielsenKL, Lynch JP, Weiss HN1997. Fractal geometry of bean root systems: correlations between spatial and fractal dimension. American Journal of Botany 84: 26–33. [PubMed] [Google Scholar]
- NielsenKL, Miller CR, Beck D, Lynch JP.1998. Fractal geometry of root systems: field observations of contrasting genotypes of common bean (Phaseolus vulgaris L.) grown under different phosphorus regimes. Plant and Soil 206: 181–190. [Google Scholar]
- PucheH, Su N Y.2001a. Application of fractal analysis for tunnel systems of subterranean termites (Isoptera: Rhinotermitidae) under laboratory conditions. Environmental Entomology 30: 545–549. [Google Scholar]
- PucheH, Su N Y.2001b. Population density of subterranean termites (Isoptera: Rhinotermitidae) on tunnel formation in laboratory arenas. Sociobiology 38: 523–530. [Google Scholar]
- RubioG, Liao H, Yan XL, Lynch JP.2003. Topsoil foraging and its role in plant competitiveness for phosphorus in common bean. Crop Science 43: 598–607. [Google Scholar]
- RubioG, Walk T, Ge ZY, Yan XL, Liao H, Lynch JP.2001. Root gravitropism and below‐ground competition among neighbouring plants: a modelling approach. Annals of Botany 88: 929–940. [Google Scholar]
- SchenkMK, Barber SA.1979. Phosphate uptake by corn as affected by soil characteristics and root morphology. Soil Science Society of America Journal 43: 880–883. [Google Scholar]
- SmithTG Jr, Lange GD, Marks WB.1996. Fractal methods and results in cellular morphology – dimensions, lacunarity and multifractals. Journal of Neuroscience Methods 69: 123–136. [DOI] [PubMed] [Google Scholar]
- TatsumiJ, Yamauchi A, Kono Y.1989. Fractal analysis of plant root systems. Annals of Botany 64: 499–503. [Google Scholar]