

Abstract
The maize (Zea mays L.) kernel undergoes large changes in water content during its development. Whether such changes regulate the pattern of kernel development or are simply a consequence of it has not yet been established because other factors, such as assimilate supply, can also affect the rate and duration of kernel growth. This study was conducted to determine whether variation in kernel weight (KW) in response to source–sink treatments is mediated by a change in kernel water relations. Two hybrids were sown at three stand densities (one, eight and 18 plants m–2), and kernel numbers were restricted to control the post‐flowering source–sink ratio within each stand density. Kernel development and water relations [water content, water potential (ψw), osmotic potential (ψs) and turgor] were monitored throughout grain filling. Final KW varied from 253 to 372 mg per kernel in response to source–sink treatments. For both genotypes, variation in KW was a result of a change in kernel growth rate (r2 = 0·91; P < 0·001) and not in the duration of kernel filling. Final KW was closely correlated with maximum kernel water content (r2 = 0·94; P < 0·001) achieved during rapid dry matter accumulation. However, variation in KW was not reflected in kernel water status parameters (ψw, ψs or turgor), which remained fairly stable across treatments. These results indicate that maximum water content provides an easily quantifiable measure of kernel sink capacity in maize. Kernel water status parameters may affect the duration of grain filling, but have no discernible impact on kernel growth rate.
Key words: Zea mays L., maize, kernel weight, kernel water content, water potential, source–sink ratio, kernel sink capacity, kernel development
INTRODUCTION
In cereals, final grain yield is determined primarily by the number of harvested kernels per unit area (Fisher, 1975). Kernel weight is considerably more stable (Fisher, 1975; Slafer and Savín, 1994), but variation in kernel size does impact grain yield, particularly in stressful environments (Blum, 1998). Factors such as drought (Brooks et al., 1982), assimilate availability (Egharevba et al., 1976; Blum, 1998) and temperature (Wardlaw and Wrigley, 1994) affect kernel development, limiting the achievement of maximum weight.
The final weight achieved by maize (Zea mays L.) kernels is largely genetically determined (Reddy and Daynard, 1983). However, kernel weight (KW) has been shown to vary with kernel number per plant (KNP) (Kiniry et al., 1990), particularly in response to changes in post‐flowering source–sink ratio (Borrás and Otegui, 2001). Such results support the notion that final KW is a product of the ‘sink capacity’ of individual kernels and the availability of assimilates to fill these sinks. The two main factors thought to control kernel sink capacity in maize are endosperm cell number and starch granule number (Brocklehurst, 1977; Reddy and Daynard, 1983; Jones et al., 1996). Related studies in wheat (Triticum aestivum L.) (Gleadow et al., 1982; Singh and Jenner, 1984), maize (Cirilo and Andrade, 1996), sorghum (Sorghum bicolor L. Moench) (Kiniry, 1988) and soybean (Glycine max L. Merrill) (Egli et al., 1981, 1985, 1987) indicate that final seed size also depends on cell expansion. Therefore, kernel volume, which integrates cell number and size, should provide an estimate of the potential sink capacity of the developing kernel, as proposed by Tollenaar and Daynard (1978a). However, data confirming this relationship for maize are scarce (Saini and Westgate, 2000).
Rapid water uptake occurs early in maize kernel growth, and once maximum water content is achieved the maximum kernel volume is determined (Westgate and Boyer, 1986). In wheat, KW and maximum volume are closely correlated, probably because kernel density at physiological maturity is very stable (Millet and Pinthus, 1984). But the relationship appears to be less consistent in maize (Saini and Westgate, 2000). This discrepancy between crops might be the result of differences in source limitations experienced by each crop during the post‐flowering period. After wheat kernels achieve maximum water content, assimilate availability is usually sufficient for optimal kernel growth (Slafer and Savin, 1994). Maize kernels, however, have been shown to experience source limitations during the later phases of grain filling, resulting in decreased kernel weight (Egharevba et al., 1976; Tollenaar and Daynard, 1978b; Jones and Brenner, 1987; Kiniry et al., 1990; Uhart and Andrade, 1995). Under such conditions, final KW probably reflects the source–sink ratio during the effective grain‐filling period (Borrás and Otegui, 2001) to a greater extent than the effective sink capacity established early in grain filling (Jones et al., 1996).
The mechanisms by which kernel water relations might regulate kernel development have not been established, but probably involve close coordination between water content and assimilate supply. Water uptake early in kernel development involves large osmotic forces since it is preceded by a rapid decrease in kernel osmotic potential (ψs) (Westgate and Boyer, 1986), and water entering the kernel must expand a cellularized endosperm (Singh and Jenner, 1984; Egli and TeKrony, 1997). During rapid grain filling, water relations within the developing kernels are largely independent of changes in plant water status; kernel water status is determined primarily by internal metabolic activity associated with storage product deposition (Westgate and Boyer, 1986; Westgate, 1994; Saini and Westgate, 2000). Replacement of water with these products (primarily starch granules) during grain filling causes a progressive desiccation of the endosperm, which eventually limits the capacity for metabolism late in grain fill (Westgate, 1994; Egli and TeKrony, 1997; Saini and Westgate, 2000).
Drought during the grain‐filling period causes the natural process of desiccation to begin prematurely in maize (Westgate, 1994), as well as in wheat and barley (Hordeum vulgare L.) (Barlow et al., 1980; Brooks et al., 1982), and shortens the duration of the effective grain‐filling period. The shorter filling period does not seem to result from a lack of assimilates, as kernels on droughted and well‐watered plants are reported to have similar sucrose concentrations (Brooks et al., 1982; Nicolas et al., 1985; Ouattar et al., 1987a; Ober et al., 1991; Westgate, 1994). Lack of adequate moisture to maintain grain filling apparently limited final KW despite a large sink capacity established early in kernel development (Westgate, 1994).
This study was conducted to determine whether variation in final kernel weight in maize in response to source–sink treatments is mediated by a change in the water relations of the developing kernel. We hypothesized that kernel water volume would limit KW at low source–sink ratios and that desiccation would limit KW at high source–sink ratios. A combination of plant density and hand pollination treatments was imposed to provide wide variation in plant growing conditions and source–sink ratio during the post‐flowering period. Of particular interest were the relationships between kernel water relations and the rate and duration of grain filling.
MATERIALS AND METHODS
Two maize hybrids, Dekalb DK611 and Holdens LH198 × LH185, were sown on 10 May 2001 at Ames, IA, USA. Three plant population densities were used: one, eight and 18 plants m–2. Each genotype × stand density combination was sown in strip plots of eight rows, 0·76 m apart, and 36 m long. Each plot was divided into three sub‐plots, 12 m long, within which pollination treatments were imposed on individual plants. The experimental area was fertilized with 150 kg N ha–1 between the fourth‐ and sixth‐leaf stages (ligulated leaves), and kept free of weeds and pests. Plants experienced no visible signs of water or nutrient stress from flowering to physiological maturity. Barren plants that occurred at the highest stand density of 18 plants m–2 were not used for experimentation.
Restricted and natural pollination treatments were imposed within each stand density to alter the number of reproductive sinks per plant. At least 15 plants per treatment combination (hybrid × stand density × pollination treatment) were selected at random and tagged 10 d before silking (first silks visible on the apical ear) in each sub‐plot. The day of silking of the apical ear was registered for each tagged plant. For restricted pollination, ears were covered 1 d after silking to prevent further pollination. The sub‐apical ear (when present) was covered before silking to prevent pollination. Apical and sub‐apical ears of naturally pollinated plants were not covered. These plants were expected to have a greater kernel number (KN) than those in the restricted pollination treatments (Kiniry et al., 1990). Ears with irregular kernel set along the ear‐row were discarded to avoid the confounded effect of atypically large kernels adjacent to unpollinated florets.
Beginning 7 d after silking (DAS) and continuing until harvest maturity, the apical ear of one plant per sub‐plot was harvested every 4 to 8 d from each treatment combination. The entire ear with surrounding husks was immediately enclosed in an airtight plastic bag and transported to the laboratory in an insulated container. Husks were removed in a humidified box, and kernels from floret positions 10 to 15, from the bottom of the rachis, were sampled for development and water status measurements. Ten kernels were sampled to determine fresh and dry weight, three to ten kernels (depending on stage of development) were sampled to determine water potential (ψw), and osmotic potential was determined on an additional three to ten kernels. Fresh weights were determined immediately and dry weights were measured after drying the kernels in a forced air oven at 80 °C for at least 96 h. Grain ψw was measured by thermocouple psychrometry at 25 °C using isopiestic technique corrected for the heat of tissue respiration (Westgate and Boyer, 1986; Westgate, 1994). After freezing on dry ice and thawing the tissue, ψs was measured on expressed sap using a vapour pressure osmometer (VAPRO 5520; Wescor Co., Logan, Utah, USA) against sucrose standard solutions. When kernels became too dry to express sufficient liquid for the osmometer reading (approx. 25 DAS), ψs was determined using the isopiestic technique on frozen/thawed kernels. Preliminary tests showed that both techniques (expressed sap and whole kernels) gave comparable values for kernel ψs to –3·0 MPa (Fig. 1). Equilibration time for the ψw and ψs measurements was approx. 3 h. Kernel turgor was calculated as the difference between ψw and ψs.

Fig. 1. Comparison of osmotic potential values obtained for maize kernels and embryos using intact tissues measured in a thermocouple psychrometer or expressed cell sap measured with a vapour pressure osmometer. Duplicate samples were excised from the same region of the ear, frozen immediately on dry ice, and thawed prior to measurement. Bars represent ± s.d. of the mean.
The rate of grain filling and grain‐filling duration were determined by fitting a bilinear model [eqns (1) and (2)] to the kernel dry weight data plotted against thermal time (TT) from silking to harvest maturity:
WK = a + bTT for TT ≤ c[1]
WK = bcfor TT > c[2]
where WK is kernel weight, a is the Y‐intercept (mg), b is the rate of grain filling (mg °Cd–1) and c is the total duration of grain filling (in °Cd). The bilinear model was fitted to the kernel dry weight data using the iterative optimization technique in Table Curve V 3.0 (Jandel, 1991). Mean daily air temperature was calculated as the average of daily maximum and minimum air temperatures measured at a weather station 320 m from the experimental site. Daily thermal time values were calculated using a base temperature of 0 °C (Muchow, 1990). The duration of the lag phase (in °Cd) was calculated from silking to the TT value where eqn (1) intercepted the x‐axis. This calculation was performed by transposing both axes in eqn (1) rather than extrapolating the linear model to the x‐axis in order to generate a confidence interval for lag phase duration.
Maximum kernel water content was taken as the maximum value measured within each hybrid × stand density × pollination treatment combination during the grain‐filling period (between 350 and 700 °Cd from silking). Differences among treatments in the rate of grain filling during the effective grain‐filling period (b in the model) were compared using a t‐test of the slopes (P < 0·05; Steel and Torrie, 1960). Differences among treatments in duration of the grain‐filling period (i.e. from silking until physiological maturity) were based on the confidence intervals for equation parameters (P < 0·05) generated by the curve fitting software (Jandel, 1991).
At the end of the effective grain‐filling period, i.e. when kernels on all harvested ears achieved 85 % milk line (Muchow, 1990) as an indication of endosperm desiccation, two plants per sub‐plot were harvested in each hybrid × stand density × pollination treatment (i.e. six plants per combination) to determine plant biomass. Plants were divided into above‐ground component parts, and dried in a forced air oven at 65 °C until a constant weight was achieved. Plant stem dry weight was measured after removing leaf sheath and tassel. Harvest index was calculated as total kernel dry weight divided by total above‐ground plant dry weight.
RESULTS
Kernel weight and water content
Field treatments were established to alter the growing conditions experienced by developing kernels. This was accomplished using a combination of plant population density and hand pollination treatments, both known to affect final KW (Poneleit and Egli, 1979; Kiniry et al., 1990). Plant population densities provided a wide range of plant growing conditions in naturally pollinated plants for both genotypes. Total above‐ground plant dry weight at physiological maturity of naturally pollinated plants ranged from 650 to 150 g per plant, at stand densities of one and 18 plants m–2, respectively (Table 1). At commercial stand densities of eight plants m–2, plants yielded about 130 g per plant of grain. This corresponds to 10·5 T ha–1, which is typical for modern corn hybrids under favourable environmental conditions (Duvick and Cassman, 1999). Plants in the extreme stand densities yielded approx. 350 and 80 g per plant at densities of one and 18 plants m–2.
Table 1.
Kernel number per plant (KNP), total above‐ground plant dry weight, total kernel weight per plant, mean kernel weight per plant, harvest index and stem dry weight at physiological maturity for Holdens LH198 × LH185 and Dekalb DK611 maize plants sown at three stand densities (one, eight and 18 plants m–2) and exposed to natural or restricted pollination
| Stand density(plants m–2) | Pollination treatment | KNP (kernels per plant) | Plant dry weight (g per plant) | Kernel dry weight (g per plant) | Kernel weight (mg per kernel) | Harvest index (g g–1) | Stem dry weight (g per stem) |
| Holdens LH198 × LH185 | |||||||
| 1 | Natural | 1056 | 665·2 | 354·2 | 336·8 | 0·53 | 108·1 |
| Restricted | 278* | 482·9* | 96·9* | 365·7 | 0·19* | 144·7* | |
| 8 | Natural | 491 | 251·4 | 133·4 | 271·0 | 0·53 | 43·4 |
| Restricted | 195* | 240·3 | 70·8* | 356·0* | 0·29* | 75·1* | |
| 18 | Natural | 310 | 153·2 | 75·0 | 244·2 | 0·49 | 28·5 |
| Restricted | 180* | 155·5 | 54·1* | 303·3* | 0·35* | 43·4* | |
| Dekalb DK611 | |||||||
| 1 | Natural | 1210 | 659·5 | 337·0 | 279·3 | 0·51 | 101·2 |
| Restricted | 213* | 480·0* | 75·1* | 353·0* | 0·16* | 149·9* | |
| 8 | Natural | 542 | 277·3 | 131·7 | 243·0 | 0·47 | 56·3 |
| Restricted | 253* | 248·8 | 88·7* | 345·8* | 0·36* | 67·2 | |
| 18 | Natural | 385 | 186·3 | 91·6 | 240·4 | 0·49 | 35·1 |
| Restricted | 122* | 159·3 | 40·4* | 339·7* | 0·24* | 51·1* |
Statistical comparisons are made within each hybrid × stand density combination.
* Significantly different from natural pollination at P < 0·05.
The reduction in total grain dry weight per plant in response to increasing stand density was accomplished mainly by changes in kernel number per plant, in agreement with the general concept that kernel number is the most important yield component in cereals (Fisher, 1975). The high stand density of 18 plants m–2 decreased KNP by 69 % in both genotypes relative to the low stand density of one plant m–2 (Table 1). Mean kernel dry weight at physiological maturity was also affected by stand density. In both genotypes, final KW decreased with increasing stand density.
The restricted pollination treatment reduced KNP by more than 50 % within each genotype × stand density combination (Table 1). As a consequence of the reduced number of growing sinks, plants with restricted pollination yielded less grain per plant, despite the increase in mean KW. The restricted KNP treatment did not affect total plant dry weight at physiological maturity for the high stand densities of eight and 18 plants m–2; however, it did decrease dry weight in the low stand density (Table 1). Harvest index from naturally pollinated plants was remarkably stable, ranging from 0·49 to 0·53 across all genotype × stand density combinations. As expected, the restricted KNP treatment decreased grain yield per plant, and significantly reduced harvest index in all treatment combinations.
Restricting KNP increased stem dry weight at physiological maturity in all genotype × stand density combinations (Table 1). Changes in source–sink ratio during grain filling in maize are frequently accompanied by dramatic changes in stem dry weight (Kiniry et al., 1992), as the supply of assimilates by the source and the demand by the sinks are buffered by assimilates temporarily stored in the stem (Tollenaar, 1977). The increase in stem dry weight in response to a reduced number of growing sinks confirms that assimilate availability per kernel was enhanced in all the genotype × stand density combinations, even at a stand density of one plant m–2.
To avoid possible confounding effects associated with floret position on the rachis, only apical ears were used, and only kernels from floret positions 10 to 15 from the bottom of the rachis were sampled. Decreased kernel set enhanced final KW of these kernels at stand densities of eight and 18 plants m–2, but had no effect at the lowest stand density (Table 2; Figs 2A and 3A). Increases in final KW were a consequence of changes in kernel growth rate during the effective grain‐filling period. The duration of grain filling, and the length of the lag phase were not altered in any of the hybrid × stand density combinations. The highest kernel growth rates corresponded to the greatest final KW, and the lowest rates corresponded to the smallest KW from both genotypes. These results agree with in vitro (Cobb et al., 1988) and in vivo (Borrás and Otegui, 2001) studies in which assimilate availability per kernel was altered during grain filling.
Table 2.
Final kernel weight, maximum water content, duration of the lag phase and of the grain‐filling period, and growth rate of kernels from floret positions 10 to 15
| Stand density (plants m–2) | Pollination treatment | Final kernel weight (mg per kernel) | Maximum water content (mg per kernel) | Duration of the grain filling period (°Cd) | Duration of the lag phase (°Cd) | Kernel growth rate (mg 10–2 °Cd–1) |
| HoldensLH198 × LH185 | ||||||
| 1 | Natural | 364·4 | 314·4 | 1094 | 249 | 42·9 |
| Restricted | 364·3 | 306·2 | 1034 | 259 | 46·9* | |
| 8 | Natural | 310·7 | 249·4 | 1046 | 254 | 39·5 |
| Restricted | 371·8* | 309·7* | 1084 | 275 | 45·9* | |
| 18 | Natural | 291·4 | 230·7 | 1084 | 252 | 34·9 |
| Restricted | 337·8* | 272·3* | 1082 | 255 | 40·7* | |
| Dekalb DK611 | ||||||
| 1 | Natural | 349·9 | 270·1 | 1091 | 255 | 41·8 |
| Restricted | 364·7 | 283·9 | 1074 | 247 | 43·9 | |
| 8 | Natural | 268·8 | 192·6 | 1092 | 253 | 31·8 |
| Restricted | 333·0* | 262·3* | 1101 | 272 | 40·1* | |
| 18 | Natural | 252·7 | 179·5 | 1093 | 261 | 30·2 |
| Restricted | 313·9* | 232·5* | 1079 | 270 | 38·7* |
Holdens LH198 × LH185 and Dekalb DK611 maize plants were sown at three stand densities and exposed to natural and restricted pollination. Final kernel weight, duration of the phase, and kernel growth rate were calculated with a bilinear plateau model. Maximum water content was determined as the maximum value registered within each treatment combination. Statistical comparisons are for each hybrid × stand density combination.
* Significantly different from natural pollination at P < 0·05.

Fig. 2. Development pattern for kernel weight and water content (A), turgor, ψw and ψs (B), and moisture content (C) of kernels of maize hybrid Holdens LH198 × LH185 grown at three stand densities (one, eight and 18 plants m–2) and exposed to natural (solid symbols and lines) or restricted (open symbols and dotted lines) pollination treatments. Base temperature for thermal time was 0 °C. Bars represent ± s.e. of the mean of three replicates.
In all genotype × stand density combinations, kernel water content increased rapidly early in grain filling, reached a maximum value between 350 and 700 °Cd, then decreased gradually during the later stages of filling (Figs 2A and 3A). This developmental pattern of water content was similar to that reported earlier for other maize genotypes (Westgate and Boyer, 1986; Westgate, 1994). Increased stand density reduced the maximum water content that kernels achieved, whereas restricted pollination enhanced their maximum water content, except at the lowest stand density (Table 2).
When KW and water content data from all the genotype × stand density × pollination treatments are considered, variation in final KW was closely correlated (r2 = 0·94; P < 0·001) with the maximum water content kernels reached during the grain‐filling period (Fig. 4). A single linear model described the relationship for both genotypes.

Fig. 4. Relationship between final kernel weight and maximum water content of Holdens LH198 × LH185 (closed symbols) and Dekalb DK611 (open symbols) maize plants. Differences in kernel weight and water content were achieved by varying stand densities and pollination treatments in order to alter the post‐flowering source–sink ratio. Final kernel weight was calculated using a bi‐linear with plateau model, and maximum water content was determined as the maximum value measured within each treatment.
Kernel growth rate also was closely and linearly correlated (r2 = 0·91; P < 0·001) with maximum water content across all treatment combinations (Fig. 5A). There was no apparent relationship, however, between maximum water content and the duration of the grain‐filling period (Fig. 5B) or the duration of the lag phase between silk emergence and linear grain fill (Fig. 5C).
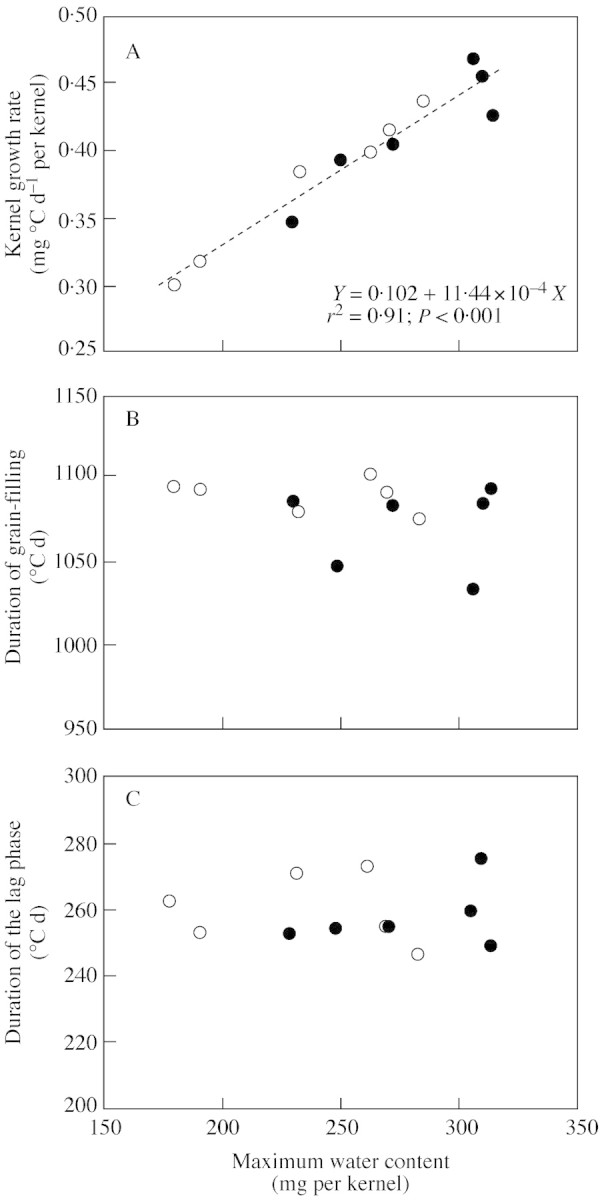
Fig. 5. Relationship between maximum water content and (A) kernel growth rate, (B) duration of the grain‐filling period and (C) duration of the lag phase of Holdens LH198 × LH185 (closed symbols) and Dekalb DK611 (open symbols) maize plants. Differences in kernel weight and maximum water content were achieved by varying stand densities and pollination treatments to alter the post‐flowering source–sink ratio.
ψw, ψs and turgor development
The water potential and osmotic potential of kernels sampled from naturally pollinated plants decreased during the early phase of rapid water uptake (100 to 350 °Cd), remained fairly stable during rapid grain filling (350 to 1000 °Cd), and then decreased rapidly after kernels reached maximum dry weight (Figs 2B and 3B). Kernel turgor was more stable, decreasing slightly during the period of rapid water uptake, then increased to approx. 0·6 MPa during the remainder of grain filling (Figs 2B and 3B). These values are in general agreement with developmental patterns reported earlier for maize kernels (Westgate and Boyer, 1986; Ouattar et al., 1987b; Westgate, 1994). Varying plant density from one to 18 plants m–2 had little, if any, impact on these kernel water status parameters in naturally pollinated plants.
The large increase in kernel water content caused by decreasing KNP did not affect the developmental pattern of kernel ψw, ψs or turgor of plants grown at eight and 18 plants m–2 for either hybrid (Figs 2B and 3B). At the lowest stand density, however, decreasing KNP caused kernel ψw and ψs values to fall below those of the naturally pollinated plants during the later half of grain fill. This shift in ψs evidently reflects the enhanced post‐flowering source–sink ratio since kernel water content did not vary between natural and restricted pollination treatments at the lowest plant density. Overall, differences in kernel mass and water content achieved by modifying stand density and/or KNP were not reflected in kernel ψw and ψs or turgor values during the early stages of kernel development (Figs 2 and 3). Only at the lowest stand density did kernels show a more rapid decrease in ψs during the later phases of grain filling.

Fig. 3. Development pattern for kernel weight and water content (A), turgor, ψw and ψs (B), and moisture content (C) of kernels of maize hybrid Dekalb DK611 grown at three stand densities (one, eight and 18 plants m–2) and exposed to natural (solid symbols and lines) or restricted (open symbols and dotted lines) pollination treatments. Base temperature for thermal time was 0 °C. Bars represent ± s.e. of the mean of three replicates.
Moisture content decreased throughout the season, in agreement with earlier reports (Westgate and Boyer, 1986). Seasonal patterns were nearly identical for all stand densities and KNP treatments. Minor variations in percentage moisture between KNP treatments late in kernel development were also evident in kernel ψw and ψs values (Figs 2C and 3C).
Environmental variations in kernel size due to stand density or pollination treatments had no impact on the underlying relationship between kernel moisture and dry weight accumulation in both genotypes (Fig. 6A). Treatment combinations with the highest final kernel weights had heavier kernels throughout grain filling. This is in accordance with our observation that variation in final KW was achieved by changes in kernel growth rate and not in the duration of grain filling (Table 2). When KW was normalized to the maximum KW achieved within each genotype × stand density × pollination treatment combination, there were no differences between treatments in dry matter accumulation (Fig. 6B).

Fig. 6. Relationship between relative kernel moisture during grain filling and (A) kernel dry weight accumulation and (B) accumulation of percentage maximum dry weight achieved within each treatment combination. Holdens LH198 × LH185 (closed symbols) and Dekalb DK611 (open symbols) maize plants were grown at three stand densities (one, eight and 18 plants m–2) and exposed to natural or restricted pollination treatments that altered the post‐flowering source–sink ratio.
DISCUSSION
The combination of plant population densities and restricted pollinations imposed in this study provided wide variation in source–sink ratios during kernel development. The resulting increase in stem biomass when kernel numbers were restricted (Table 1) supports the conclusion that assimilate supply was in excess of requirements for kernel development in these treatments. The fact that the increase in kernel size resulted from a faster rate of filling rather than an increase in the effective‐filling period (Fig. 5) also implies that assimilate supply relative to the growing sinks did not limit the duration of grain development, even in the open‐pollinated treatments at a population density of 18 plants m–2.
Final KW reacted positively to a reduction in the number of growing kernels per plant within each stand density, in agreement with earlier reports (Kiniry et al., 1990; Borrás and Otegui, 2001). Increased KW was observed in plants grown at 18 and eight plants m–2, but not in those grown at one plant m–2 when KNP was restricted (Table 2). This KW response is similar to that found by Borrás and Otegui (2001), who reported an increase in KW up to a threshold in assimilate supply per kernel, beyond which no further increase occurred. Kernel development in the hybrids used in this study was most responsive to change in source–sink ratio when grown at commercial stand densities of eight plants m–2. Investigations are underway to examine this phenomenon in a broader range of hybrids that vary genetically for final KW.
Variation in final KW in response to source–sink ratio was closely related to maximum kernel water content achieved during grain filling (Fig. 4). As such, the maximum water content achieved during grain filling was a good predictor of final KW, as suggested by Saini and Westgate (2000). Tollenaar and Daynard (1978a) reported a similar trend among floret positions within the maize ear. Apical kernels that achieved smaller volumes also had slower growth rates during rapid grain filling compared with heavier basal kernels. The changes in maximum kernel water content and KW associated with an altered source–sink ratio had no impact on the relationship between kernel moisture content and dry weight accumulation (Fig. 6). Moreover, when KW development was normalized relative to final KW and plotted against moisture content, a single pattern of development emerged for all treatments (Fig. 6B). These results indicate that dry matter accumulation in maize kernels follows a predictable pattern associated with internal changes in kernel water relations. Similar conclusions have been reached for the developing wheat grain (Calderini et al., 2000) and soybean embryo (Swank et al., 1987). The stability of this relationship indicates that regulation of water uptake and water loss by the kernel are important determinants of kernel development and, therefore, final KW. Presumably, these processes are driven by osmotic gradients (Singh and Jenner, 1984; Westgate and Boyer, 1986; Bradford, 1994; Egli and TeKrony, 1997), but direct evidence for their regulation is lacking.
Variation in kernel water content and mass during grain filling caused by the source–sink ratio treatments were not reflected in grain water status parameters (Ψw, Ψs and turgor) known to regulate water transport in plant tissues. For example, in maize leaves and roots, changes in growth rate associated with development, or in response to drought, are clearly reflected in the osmotic gradients between the water supply and the growing tissues (Westgate and Boyer, 1984, 1985). It is possible that rate of water uptake into the kernels was simply too slow (and our measurement techniques too crude) to distinguish treatment effects on osmotic gradients between the plant and the developing kernels. Assuming 20 °C in heat units accumulated per day, the maximum rate of water uptake by kernels was about 165 pL s–1 (estimated for kernels of plants grown at the lowest stand density in Fig. 2A). Similar rates can be calculated from fresh weight accumulation rates presented in Lur and Setter (1993). These rates of water uptake are an order of magnitude slower than that those observed in expanding maize roots, and more than two orders of magnitude slower than the rate of water uptake by rapidly expanding maize leaves (Westgate and Boyer, 1985). Increasing the source–sink ratio after flowering increased the rate of water uptake by kernels of plants grown at medium and high stand densities (Figs 2A and 3A). But the greatest difference in uptake rate between treatments was only about 50 pL s–1. Thus, while kernels in all treatments exhibited the rapid decrease in Ψs and Ψw after pollination needed to establish the osmotic gradients required for rapid water uptake, the values were nearly identical across treatments (Figs 2B and 3B). Therefore, these whole‐kernel measurements do not explain why water uptake by kernels was more rapid in the restricted pollination treatments. More sensitive techniques are needed to estimate the water potential of the tissues along the path of water flow from the water supply within the pedicel to the expanding cells of the endosperm.
Nonetheless, the present results confirm that the osmotic environment within the developing maize kernel remains fairly stable across a range of growing conditions far more extreme that those typically encountered in the field (Barlow et al., 1980; Ouattar et al., 1987b; Westgate, 1994). They support the concept that accumulation of water and solutes is closely coordinated during development such that fresh weight growth is suppressed—or stimulated—to maintain a favourable concentration of metabolic intermediates (Setter, 1993; Setter et al., 2001). Although the mechanism of such coordinated regulation of water and solute concentration remains elusive (but see Bradford, 1994), it is an intriguing possibility that could explain why maize kernels maintain a consistent pattern of Ψw, Ψs and turgor during development despite large variation in kernel number per plant and final kernel weight (Table 1).
Treatment effects of final KW resulted from variation in kernel growth rate, which was closely correlated with maximum kernel volume (Fig. 5). A number of studies have shown that the rate of kernel dry matter accumulation depends upon the number of starch granules (or their surface area) available for assimilate deposition (Shannon, 1974; Reddy and Daynard, 1983; Ober et al., 1991; Jones et al., 1996). Maximum granule number is determined at about the same time that maximum water content is achieved (Jones et al., 1996). As such, it is likely that the variation in KW observed in the present study reflects treatment effects on starch granule number (Shannon, 1974; Jones et al., 1996). If so, maximum water content would serve as a functional measure of sink strength in terms of a kernel’s potential capacity to incorporate assimilates into starch. The results of this study suggest that metabolic events within the kernel at the end of the lag phase (250–300 °Cd after anthesis) may establish this potential. The increase in kernel Ψs at this point marked the transition to rapid starch synthesis, the rate of which was closely correlated to maximum kernel volume and final KW.
There was no discernible effect of the source–sink treatments on the duration of the effective filling period (Fig. 5). Because stem weight also increased with kernel weight in response to restricted pollination (Tables 1 and 2), it is reasonable to conclude that the supply of assimilates did not limit the duration of grain development in these treatments. Recent studies indicate that decreasing moisture content late in grain filling limits the duration of dry matter accumulation in cereal grains (Saini and Westgate, 2000). For example, premature desiccation of kernels developing on droughted plants shortens the duration of grain filling because kernels reach limiting moisture contents sooner after anthesis (Barlow et al., 1980; Brooks et al., 1982; Westgate, 1994). However, there was no indication in the present study that altering the source–sink ratio during grain filling affected the natural process of grain desiccation (Figs 2A and 3A). In fact, a single pattern was sufficient to describe the relationship between kernel water content and dry matter accumulation for all source–sink treatments (Fig. 6B). Despite a large range of maximum water contents and final kernel weights, kernels in all treatments ceased accumulating dry weight at about the same relative moisture content. These results confirm that our source–sink ratio treatments exerted their effect on final kernel weight by altering metabolic processes early in kernel development.
CONCLUSIONS
The results of this study expose the link between kernel water relations and final kernel weight. Modifications in kernel weight were explained by changes in kernel growth rate, which was closely correlated to maximum water content achieved during rapid grain filling. As such, maximum water content serves as an independent measure of maize kernel sink capacity. Understanding the metabolic factors that determine how maximum kernel water content is achieved and regulated is essential to increase sink strength under favourable conditions.
ACKNOWLEDGEMENTS
The authors thank J. Lundvall, E. Argotsinger, K. Kaiser, J. Peterson, R. Zhou, A. Fonseca, L. Echarte and J. Cárcova for help with the experiments, and R. A. Sánchez for critically reading the manuscript. This work was partially supported by FOMEC. L.B. held a grant from CONICET, and M.E.O. is member of CONICET, the Research Council of Argentina.
Supplementary Material
Received: 1 October 2002; Returned for revision: 17 December 2002 Published electronically: 15 April 2003; Accepted: 17 February 2003
References
- BarlowEWR, Lee JW, Munns R, Smart MG.1980. Water relations of the developing wheat grain. Australian Journal of Plant Physiology 7: 519–525. [Google Scholar]
- BlumA.1998. Improving wheat grain filling under stress by stem reserve mobilization. Euphytica 100: 77–83. [Google Scholar]
- BorrásL, Otegui ME.2001. Maize kernel weight response to post‐flowering source–sink ratio. Crop Science 41: 1816–1822. [DOI] [PMC free article] [PubMed] [Google Scholar]
- BrocklehurstPA.1977. Factors controlling grain weight in wheat. Nature 266: 348–349. [Google Scholar]
- BradfordKJ.1994. Water stress and the water relations of seed development: a critical review. Crop Science 34: 1–11. [Google Scholar]
- BrooksA, Jenner CF, Aspinall D.1982. Effects of water deficit on endosperm starch granules and on grain physiology of wheat and barley. Australian Journal of Plant Physiology 9: 423–436. [Google Scholar]
- CalderiniDF, Abeledo LG, Slafer GA.2000. Physiological maturity in wheat based on kernel water and dry matter. Agronomy Journal 92: 895–901. [Google Scholar]
- CiriloAG, Andrade FH.1996. Sowing date and kernel weight in maize. Crop Science 36: 325–331. [Google Scholar]
- CobbBG, Hole DJ, Smith JD, Kent MW.1988. The effects of modifying sucrose concentration on the development of maize kernels grown in vitro Annals of Botany 62: 265–270. [Google Scholar]
- DuvickDN, Cassman KG.1999. Post‐green revolution trends in yield potential of temperate maize in the North‐Central United States. Crop Science 39: 1622–1630. [Google Scholar]
- EgharevbaPN, Horrocks RD, Zuber MS.1976. Dry matter accumulation in maize in response to defoliation. Agronomy Journal 68: 40–43. [Google Scholar]
- EgliDB, TeKrony DM.1997. Species differences in seed water status during seed maturation and germination. Seed Science Research 7: 3–11. [Google Scholar]
- EgliDB, Duncan WG, Crafts‐Brandner SJ.1987. Effect of physical restraint on seed growth in soybeans. Crop Science 27: 289–294. [Google Scholar]
- EgliDB, Fraser J, Leggett JE, Poneleit CG.1981. Control of seed growth in soya beans [Glycine max (L.) Merrill]. Annals of Botany 48: 171–176. [Google Scholar]
- EgliDB, Guffy RD, Meckerl LW, Leggett JE.1985. The effect of source–sink alterations on soybeans seed growth. Annals of Botany 55: 395–402. [Google Scholar]
- FisherRA.1975. Yield potential of dwarf spring wheat and the effect of shading. Crop Science 15: 607–613. [Google Scholar]
- GleadowRM, Dalling MJ, Halloran GM.1982. Variation in endosperm characteristics and nitrogen content in six wheat lines. Australian Journal of Plant Physiology 9: 539–551. [Google Scholar]
- Jandel Scientific.1991.Table curve V. 3.0. User’s manual version 3.0 AISN software. Corte Madera, CA: Jandel Scientific. [Google Scholar]
- JonesRJ, Brenner ML.1987. Distribution of abscisic acid in maize kernel during grain filling. Plant Physiology 83: 905–909. [DOI] [PMC free article] [PubMed] [Google Scholar]
- JonesRJ, Schreiber BMN, Roessler JA.1996. Kernel sink capacity in maize: genotypic and maternal regulation. Crop Science 36: 301–306. [Google Scholar]
- KiniryJR.1988. Kernel weight increase in response to decreased kernel number in sorghum. Agronomy Journal 80: 221–226. [Google Scholar]
- KiniryJR, Tischler CR, Rosenthal WD, Gerik TJ.1992. Nonstructural carbohydrate utilization by sorghum and maize shaded during grain growth. Crop Science 32: 131–137. [Google Scholar]
- KiniryJR, Wood CA, Spanel DA, Bockholt AJ.1990. Seed weight response to decreased seed number in maize. Agronomy Journal 54: 98–102. [Google Scholar]
- LurH‐S, Setter TL.1993. Role of auxin in maize endosperm development. Timing of nuclear DNA endoreduplication, zein expression, and cytokinin. Plant Physiology 103: 273–280. [DOI] [PMC free article] [PubMed] [Google Scholar]
- MilletE, Pinthus MJ.1984. The association between grain volume and grain weight in wheat. Journal of Cereal Science 2: 31–35. [Google Scholar]
- MuchowRC.1990. Effect of high temperature on grain‐growth in field‐grown maize. Field Crops Research 23: 145–158. [Google Scholar]
- NicolasME, Gleadow RM, Dalling MJ.1985. Effect of post‐anthesis drought on cell division and starch accumulation in developing wheat grains. Annals of Botany 55: 433–444. [Google Scholar]
- OberES, Setter TL, Madison JT, Thompson JF, Shapiro PS.1991. Influence of water deficit on maize endosperm development. Enzyme activities and RNA transcripts of starch and zein synthesis, abscisic acid, and cell division. Plant Physiology 97: 154–164. [DOI] [PMC free article] [PubMed] [Google Scholar]
- OuattarS, Jones RJ, Crookston RK.1987a. Effect of water deficit during grain filling on the pattern of maize kernel growth and development. Crop Science 27: 726–730. [Google Scholar]
- OuattarS, Jones RJ, Crookston RK, Kajeiou M.1987b. Effect of drought on water relations of developing maize kernels. Crop Science 27: 730–735. [Google Scholar]
- PoneleitCG, Egli DB.1979. Kernel growth rate and duration in maize as affected by plant density and genotype. Crop Science 19: 385–388. [Google Scholar]
- ReddyVM, Daynard TB.1983. Endosperm characteristics associated with rate of grain filling and kernel size in corn. Maydica 28: 339–355. [Google Scholar]
- SainiHS, Westgate ME.2000. Reproductive development in grain crops during drought. Advances in Agronomy 68: 59–96. [Google Scholar]
- SetterTL.1993. Assimilate allocation in response to water deficit stress. In: Buxton DR, Shibles R, Forsberg RA, Blad BL, Asay KH, Paulsen GM, Wilson RF, eds. International crop science I Wisconsin: CSSA, 733–739. [Google Scholar]
- SetterTL, Flannigan BA, Melkonian J.2001. Loss of kernel set due to water deficit and shade in maize: carbohydrate supplies, abscisic acid, and cytokinins. Crop Science 41: 1530–1540. [Google Scholar]
- ShannonJC.1974.In vivo incorporation of carbon‐14 into Zea mays L. starch granules. Cereal Chemistry 51: 798–808. [Google Scholar]
- SinghBK, Jenner CF.1984. Factors controlling endosperm cell number and grain dry weight in wheat: effects of shading on intact plants and of variation in nutritional supply to detached, cultured ears. Australian Journal of Plant Physiology 11: 151–163. [Google Scholar]
- SlaferGA, Savin R.1994. Source–sink relationships and grain mass at different positions within the spike in wheat. Field Crops Research 37: 39–49. [Google Scholar]
- SteelRGD, Torrie JH.1960.Principles and procedures of statistics. McGraw‐Hill, New York. [Google Scholar]
- SwankJC, Egli DB, Pfeiffer TW.1987. Seed growth characteristics of soybean genotypes differing in duration of seed fill. Crop Science 27: 85–89. [Google Scholar]
- TollenaarM.1977. Source–sink relationships during reproductive development in maize. A review. Maydica 22: 49–75. [Google Scholar]
- TollenaarM,Daynard TB.1978a. Kernel growth and development at two positions on the ear of maize (Zea mays). Canadian Journal of Plant Science 58: 189–197. [Google Scholar]
- TollenaarM,Daynard TB.1978b. Effect of defoliation on kernel development in maize. Canadian Journal of Plant Science 58: 207–212. [Google Scholar]
- UhartSA, Andrade FH.1995. Nitrogen and carbon accumulation and remobilization during grain filling in maize under different source/sink ratios. Crop Science 35: 183–190. [Google Scholar]
- WardlawIF, Wrigley CW.1994. Heat tolerance in temperate cereals: an overview. Australian Journal of Plant Physiology 21: 695–703. [Google Scholar]
- WestgateME.1994. Water status and development of the maize endosperm and embryo during drought. Crop Science 34: 76–83. [Google Scholar]
- WestgateME, Boyer JS.1984. Transpiration‐induced and growth‐induced water potentials in maize. Plant Physiology 74: 882–889. [DOI] [PMC free article] [PubMed] [Google Scholar]
- WestgateME, Boyer JS.1985. Osmotic adjustment and the inhibition of leaf, roots, stems, and silk growth at low water potential in maize. Planta 164: 540–549. [DOI] [PubMed] [Google Scholar]
- WestgateME, Boyer JS.1986. Water status and the developing grain of maize. Agronomy Journal 78: 714–719. [Google Scholar]
Associated Data
This section collects any data citations, data availability statements, or supplementary materials included in this article.