

Abstract
An increase in leaf mass per area (MLA) of plants grown at elevated [CO2] is often accompanied by accumulation of non‐structural carbohydrates, and has been considered to be a response resulting from source–sink imbalance. We hypothesized that the increase in MLA benefits plants by increasing the net assimilation rate through maintaining a high leaf nitrogen content per area (NLA). To test this hypothesis, Polygonum cuspidatum was grown at ambient (370 µmol mol–1) and elevated (700 µmol mol–1) [CO2] with three levels of N supply. Elevated [CO2] significantly increased MLA with smaller effects on NLA and leaf mass ratio (fLM). The effect of change in MLA on plant growth was investigated by the sensitivity analysis: MLA values observed at ambient and elevated [CO2] were substituted into a steady‐state growth model to calculate the relative growth rate (R). At ambient [CO2], substitution of a high MLA (observed at elevated [CO2]) did not increase R, compared with R for a low MLA (observed at ambient [CO2]), whereas at elevated [CO2] the high MLA always increased R compared with R at the low MLA. These results suggest that the increase in MLA contributes to growth enhancement under elevated [CO2]. The optimal combination of fLM and MLA to maximize R was determined for different [CO2] and N availabilities. The optimal fLM was nearly constant, while the optimal MLA increased at elevated [CO2], and decreased at higher N availabilities. The changes in fLM of actual plants may compensate for the limited plasticity of MLA.
Key words: Elevated [CO2], growth model, leaf mass per area, leaf mass ratio, leaf nitrogen, optimal allocation, root : shoot ratio, sensitivity analysis
INTRODUCTION
The effect of elevated [CO2] on plant growth is strongly influenced by nutrient availabilities (Bazzaz, 1990; Jackson and Reynolds, 1996; Lloyd and Farquhar, 1996; Stitt and Krapp, 1999). Elevated [CO2] stimulates growth to a lesser extent when plants are grown with a limited supply of nutrients (e.g. Pettersson et al., 1993; Rogers et al., 1996; Curtis and Wang, 1998; Lutze and Gifford, 1998; Yin, 2002). Elevated [CO2] has been shown to increase shoot activity (C uptake), but not root activity (N uptake), leading to a reduction in plant N concentration (e.g. Wong, 1979; Conroy et al., 1992; Norby et al., 1999). Since N is an essential constituent of proteins, a decrease in the plant N concentration may lead to a reduction in plant functions, particularly in photosynthetic capacity (Field and Mooney, 1986; Luo et al., 1994).
Plants respond to an alteration of N availability or C/N balance in the environment by changing their root : shoot ratio (R : S; for a review, see Wilson, 1988). Brouwer (1962) and Davidson (1969) proposed the ‘functional equilibrium’ theory, namely that R : S changes to maintain the activity ratio between the shoot and root, e.g. at low N availability R : S increases to compensate for decreased N uptake. However, this theory does not hold in the strict sense, because plant nitrogen concentration is not constant across growth conditions (Thornley, 1975; Brouwer, 1983; Hirose, 1986). Hilbert (1990) established a model for optimal allocation of biomass to the root and shoot that maximizes the relative growth rate, R (symbols used in this paper are listed in the Appendix). In his model, photosynthetic activity per unit shoot mass is a function of shoot N concentration. Allocation of more dry mass to roots increases the shoot N concentration via increased N uptake, but decreases shoot mass. The optimal allocation to roots increases with decreasing N availability, as has been observed in actual plants. It is believed that plasticity in dry matter allocation contributes to increasing fitness of plants growing in environments with changing C : N supply ratios (Hirose, 1987; Wilson, 1988).
The functional equilibrium theory predicts an increase in the R : S ratio and a reduction in leaf mass ratio, fLM (the fraction of plant mass in the leaf) in plants growing at elevated [CO2] (Wilson, 1988). However, fLM in actual plants does not necessarily respond to elevated [CO2] as expected (Stulen and den Hertog, 1993; Luo et al., 1999). While there have been several reports that elevated [CO2] decreases fLM (e.g. Larigauderie et al., 1988; Wilson, 1988; Bazzaz, 1990; Dippery et al., 1995), other studies have shown that fLM is unaffected by elevated [CO2] (Pettersson et al., 1993; Curtis and Wang, 1998; Atkin et al., 1999; Norby et al., 1999). The lack of an optimal response to elevated [CO2] has been attributed to the evolutionary history of plants. Prior to the Industrial Revolution in the 19th century, atmospheric CO2 concentrations had been stable for 200 000 years, at less than 30 Pa (Barnola et al., 1987), and plants had no opportunity to develop mechanisms that would benefit growth at elevated [CO2] (Tissue et al., 1995).
Plant growth has been analysed using relative growth rate, which is factorized as R = E (fLM/MLA), where E is net assimilation rate, and MLA leaf mass per area. This equation indicates that plant growth is influenced by a structural variable MLA, other than R : S or fLM, such that an increase in MLA leads to a reduction in R, unless E and fLM change simultaneously. Many studies have shown that MLA consistently increases under elevated [CO2] (Poorter et al., 1996; Yin, 2002) and this increase has been primarily explained by accumulation of non‐structural carbohydrates (Poorter et al., 1997). Since the increase in MLA leads to a reduction in R, it has been considered as a response resulting from source–sink imbalance. However, Luo et al. (1994) suggested a possible advantage of increasing MLA under elevated [CO2], because it would contribute to increasing leaf N content on an area basis (NLA): NLA = NLMMLA, where NLM is leaf N concentration on a mass basis. The decrease in NLM as a result of elevated [CO2] may be compensated for by an increase in MLA, to maintain a high NLA (Luo et al., 1994; Peterson et al., 1999a). More than half the nitrogen in a leaf is in the photosynthetic apparatus (Hikosaka and Terashima, 1996), and E is an increasing function of NLA (Hirose, 1984). Therefore, an increase in MLA may lead to an increase in E and, consequently, in R.
In previous studies on the optimal allocation under elevated [CO2], the effect of MLA has been ignored. For example, the model of Hilbert et al. (1991) assumed constant MLA irrespective of [CO2] levels. Although Luo et al. (1994) indicated that MLA was important, their model did not explain the extent to which plant growth rate changes depending on MLA. On the other hand, Hirose (1987, 1988) demonstrated the importance of MLA for regulating R under different N availabilities, but the implication of this at elevated [CO2] was not considered.
The present study aims to evaluate the importance of the increase in MLA on plant growth under elevated [CO2]. Polygonum cuspidatum was grown with different levels of N availability at ambient and at elevated [CO2], and growth, dry mass allocation and N concentration were determined. Incorporating the relationships between NLA and E at ambient and elevated [CO2], a steady‐state growth model was constructed to predict relative growth rate in response to changes in fLM and MLA. Sensitivity analyses were carried out on this model to assess the effects of changes in MLA on R.
MATERIALS AND METHODS
Plant material and growth conditions
A perennial herb Polygonum cuspidatum Sieb. et Zucc. (Japanese knotweed; syn. Reynoutria japonica Houttuyn) was used for the experiment. This species is distributed over a wide altitudinal range in Japan, and grows rapidly in fertile environments but shows slow but steady growth in nutrient‐poor environments (Chiba and Hirose, 1993).
Seeds of P. cuspidatum, collected from a single clone growing on Mt Fuji, Japan, in November 1999, were sown on wet filter paper on 12 May 2000, and allowed to germinate in a growth chamber at 25 °C with light. On 17 May, they were transplanted to 4·0‐l plastic pots, 16 cm in diameter, filled with washed river sand to a depth of 16 cm. Each pot contained four seedlings. Plants were grown under natural light conditions in two 2 × 2 × 2 m open‐top chambers in which the CO2 concentration was either ambient (370 µmol mol–1) or elevated (700 µmol mol–1). An earlier experiment had shown no significant difference between the two chambers other than in [CO2] (Nagashima et al., 2003). Air temperature, photosynthetic photon flux density (PPFD) and [CO2] in the chamber were monitored during the experimental period. Actual [CO2] in the chamber was 320–400 µmol mol–1 for the ambient treatment, and 670–730 for the elevated [CO2] treatment. Daily maximum and minimum air temperatures ranged from 16·8–38·3 °C and 8·0–22·0 °C, respectively. Hori zontal PPFD at noon ranged from 180 (on a rainy day) to 1900 µmol m–2 s–1. Each chamber contained 36 pots, which were divided into three groups. Each group received a nutrient solution differing in its NO3– content: N1 (lowest N), N2 and N3 (highest N). The composition of N1, in mol m–3, was: 0·60 NO3–, 1·5 SO42–, 1·33 PO43–, 0·05 BO33–, 0·20 K+, 0·20 Ca2+, 1·50 Mg2+, 1·43 Na+, 0·05 Fe(III)EDTA, 0·01 Mn2+, 0·01 Zn2+, 0·10 Cl–, 0·001 Cu2+, 0·0005 MoO42– and 0·0002 Co2+. The composition of N2 and N3 was the same as that for N1, except for NO3–, which was five (N2) and 25 (N3) times richer than in N1, respectively. Fifty millilitres of nutrient solution was added to pots every 5 d from 22 May. Plants were watered as needed with tap water. Pots were rotated periodically to minimize differences in growth conditions among pots.
Sampling and measurements
Three pots per [CO2] and N treatment were sampled at 10‐d intervals, on 11 and 21 June and on 1 and 11 Jul. 2000 (25, 35, 45 and 55 d after transplanting, respectively). Four plants in each pot were processed separately and there were 12 plants per treatment. Plant material was divided into the following groups: leaves (including petioles), stems and roots (including hypocotyls). Leaf area was measured using a leaf area meter (LI 3100; Li‐Cor, Lincoln, NB, USA). Dry weights were determined for plant parts after drying at 70 °C for 3 d in a ventilated oven. Dried materials were ground in a Wiley mill, and their N concentrations were determined using an NC‐analyzer (NC‐80; Shimadzu, Kyoto, Japan).
Growth analysis and steady‐state‐growth model
The model of Hirose (1987, 1988) was used, after modification, in the present study. Average leaf area, dry mass and N concentration were estimated between two successive harvests: day 25 to 35, day 35 to 45 and day 45 to 55 (denoted as day 30, 40 and 50, respectively). Means of leaf area and dry mass were estimated by assuming exponential growth at each harvest interval: X̄ = (X2 – X1)/lnX2 – lnX1), where X̄ is the mean for the period between times 1 and 2, and is derived from X1 and X2, the values at times 1 and 2, respectively. N concentrations were estimated as the arithmetic mean between two successive harvests. Variables in growth analysis were also calculated as the arithmetic mean for the period between two successive harvests.
The relative growth rate (R) is the product of the net assimilation rate (E) and the leaf area ratio (F):
R = EF(1)
The ratio of leaf area to whole plant dry mass is expressed as the leaf mass ratio (fLM) divided by leaf mass per area (MLA):
F = fLM/MLA(2)
E is a rectangular hyperbolic function of leaf N content on an area basis (NLA):
E = a(NLA – b)/(NLA – b + c)(3)
where a, b and c are constants (Hirose, 1984). NLA is a product of leaf N concentration on a mass basis (NLM) and MLA:
NLA = NLMMLA(4)
NLM is a linear function of whole plant N concentration (NP):
NLM = dNP + e(5)
where d and e are constants (Kachi and Rorison, 1989).
The plant was considered to be composed of three organs (leaves, stems and roots), and the sum of the dry mass ratio of each organ is 1:
fLM + fSM + fRM = 1(6)
where fLM, fSM, and fRM are the mass fractions in the leaf, stem and root, respectively. In the present model, the fSM value was fixed at 0·10, because fSM was nearly constant across [CO2] and N treatments (mean ± s. d., 0·107 ± 0·018). Then, eqn (6) is simplified:
fRM = 0·9 – fLM(7)
Assuming steady‐state growth (Thornley, 1972), the whole plant N concentration (NP) is expressed as the ratio of the rate of N absorption per plant mass (= σNfRM) to the relative growth rate (= EfLM/MLA):
where σN is the rate of net N uptake per unit root mass. σN is expected to increase with increasing N availability. The value of σN was obtained experimentally.
Both E and F, the two components of R [eqn (1)], may change in response to a change in MLA. As MLA increases, F decreases [eqn (2)], whereas E may increase through increases in NP, NLM and NLA [eqns (3)–(5) and (8)]. Combining eqns (1)–(8) gives R as a function of three independent variables (σN, fLM and MLA) with five constants, a–e, which are determined from the experiment for each CO2 concentration.
Statistical analyses
ANOVA was used to test for the effects of [CO2], N supply, age and their interactions on variables of plant dry mass, R, E, F, fLM, MLA, σN, NLM and NLA. Variance was calculated for 12 plants per treatment (n = 12). For the effects of [CO2], a t‐test was also used. Effects of [CO2] on the relationships between E and NLA and between NP and NLM were tested by analysis of covariance (ANCOVA). Statistical significance was assessed using Stat‐View version 5.0 (SAS Institute Inc.). Mathematica 4.0 (Wolfram Research Inc.) was used for model calculations.
RESULTS
Growth, allocation and nitrogen concentration
Elevated [CO2] significantly increased plant dry mass, and the [CO2] effect was larger at higher rates of N supply (Tables 1 and 2): 24·4 % (N1), 45·6 % (N2) and 91·5 % (N3). While the net assimilation rate, E, increased (by +27 % on average, although there were some exceptions: N1 on day 30, and N3 on day 50), the relative growth rate, R, decreased at elevated [CO2] (–5·2 % on average) owing to a significant reduction in the leaf area ratio, F [–5 % on average; see eqn (1)]. Accordingly, the increase in dry mass accumulation seen at elevated [CO2] should be ascribed to growth stimulation at a stage prior to the first harvest.
Table 1.
ANOVA for the effect of [CO2], N level, plant age and their interactions on plant dry mass (M), relative growth rate (R), net assimilation rate (E), leaf area ratio (F), leaf mass ratio (fLM), leaf mass per area (MLA), specific absorption rate (σN), leaf nitrogen concentration on a dry mass basis (NLM) and on an area basis (NLA)
| M | R | E | F | f LM | M LA | σN | N LM | N LA | |
| CO2 | 115·1*** | 12·1*** | 60·7*** | 804·5*** | 24·1*** | 859·7*** | 71·2*** | 653·1*** | 7·9** |
| N | 594·8*** | 151·4*** | 79·6*** | 81·6*** | 57·6*** | 92·0*** | 189·5*** | 237·2*** | 433·8*** |
| Age | 424·7*** | 209·9*** | 25·5*** | 544·2*** | 340·2*** | 153·4*** | 274·0*** | 244·8*** | 15·9*** |
| CO2 × N | 62·2*** | 0·7 | 2·9 | 2·3 | 0·7 | 4·3* | 4·8** | 6·0** | 0·9 |
| CO2 × age | 24·4*** | 17·6*** | 10·5*** | 1·4 | 3·8* | 7·8*** | 5·7** | 0·8 | 0·8 |
| N × age | 186·1*** | 78·6*** | 53·5*** | 24·3*** | 9·1*** | 16·1*** | 69·7*** | 38·5*** | 26·0*** |
| CO2 × N × age | 14·5*** | 13·6*** | 13·7*** | 0·5 | 1·3 | 3·0* | 0·2 | 3·9** | 1·8 |
n = 12.
F‐values with their probabilities: ***P < 0·001, **P < 0·01 and *P < 0·05.
Table 2.
Plant dry mass (M), relative growth rate (R), net assimilation rate (E), leaf area ratio (F), leaf mass ratio (fLM), leaf mass per area (MLA), specific absorption rate (σN), leaf nitrogen concentration on a dry mass basis (NLM) and on an area basis (NLA) as influenced by [CO2] (ambient, 370 µmol mol–1; elevated, 700 µmol mol–1), N treatments (N1, low; N2, medium; N3, high) and age (days after transplanting)
| M (mg) | R (d–1) | E (g m–2 d–1) | F (m2 g–1) | f LM | MLA (g m–2) | σN (gN g–1 d–1) | NLM (gN g–1) | NLA (gN m–2) | ||||||||||||||||||||
| Ntreatment | Age | Ambi ent [CO2] | Ele vated [CO2] | Ambi ent [CO2] | Ele vated [CO2] | Ambi ent [CO2] | Ele vated [CO2] | Ambi ent [CO2] | Ele vated [CO2] | Ambi ent [CO2] | Ele vated [CO2] | Ambi ent [CO2] | Ele vated [CO2] | Ambi ent [CO2] | Ele vated [CO2] | Ambi ent [CO2] | Ele vated [CO2] | Ambi ent [CO2] | Ele vated [CO2] | |||||||||
| N1 | 30 | 9·6 | 12·9 | * | 0·113 | 0·078 | *** | 5·46 | 4·84 | n.s. | 0·0208 | 0·0161 | *** | 0·642 | 0·629 | n.s. | 30·8 | 39·1 | *** | 0·0086 | 0·0052 | *** | 0·0310 | 0·0230 | *** | 0·91 | 0·86 | n.s. |
| 40 | 18·8 | 22·6 | n.s. | 0·032 | 0·039 | n.s. | 1·57 | 2·53 | n.s. | 0·0202 | 0·0154 | *** | 0·637 | 0·607 | * | 31·6 | 39·6 | *** | 0·0059 | 0·0043 | n.s. | 0·0277 | 0·0222 | *** | 0·87 | 0·87 | n.s. | |
| 50 | 37·5 | 44·8 | * | 0·099 | 0·095 | n.s. | 6·15 | 7·96 | *** | 0·0162 | 0·0120 | *** | 0·537 | 0·519 | n.s. | 33·2 | 43·4 | *** | 0·0051 | 0·0033 | ** | 0·0278 | 0·0213 | *** | 0·90 | 0·89 | n.s. | |
| N2 | 30 | 26·0 | 37·8 | * | 0·137 | 0·113 | ** | 6·56 | 6·84 | n.s. | 0·0210 | 0·0168 | *** | 0·673 | 0·665 | n.s. | 32·1 | 39·8 | *** | 0·0120 | 0·0079 | * | 0·0331 | 0·0268 | *** | 1·00 | 1·00 | n.s. |
| 40 | 69·8 | 102·3 | ** | 0·075 | 0·089 | n.s. | 4·79 | 7·49 | *** | 0·0160 | 0·0120 | *** | 0·597 | 0·583 | n.s. | 37·4 | 48·6 | *** | 0·0063 | 0·0048 | n.s. | 0·0272 | 0·0205 | *** | 1·01 | 0·99 | n.s. | |
| 50 | 141·8 | 205·6 | *** | 0·070 | 0·060 | * | 5·43 | 6·77 | ** | 0·0130 | 0·0089 | *** | 0·511 | 0·483 | * | 39·5 | 54·4 | *** | 0·0027 | 0·0017 | * | 0·0260 | 0·0188 | *** | 1·02 | 1·01 | n.s. | |
| N3 | 30 | 42·2 | 78·9 | *** | 0·150 | 0·167 | * | 6·61 | 9·38 | *** | 0·0229 | 0·0178 | *** | 0·708 | 0·715 | n.s. | 31·0 | 40·4 | *** | 0·0268 | 0·0204 | ** | 0·0432 | 0·0348 | *** | 1·30 | 1·31 | n.s. |
| 40 | 153·6 | 327·3 | *** | 0·117 | 0·127 | n.s. | 6·08 | 9·29 | *** | 0·0193 | 0·0138 | *** | 0·666 | 0·619 | *** | 34·5 | 45·1 | *** | 0·0137 | 0·0096 | ** | 0·0372 | 0·0260 | *** | 1·28 | 1·18 | *** | |
| 50 | 448·8 | 783·7 | *** | 0·101 | 0·060 | *** | 6·53 | 5·36 | *** | 0·0154 | 0·0112 | *** | 0·591 | 0·544 | *** | 38·3 | 48·5 | *** | 0·0052 | 0·0021 | *** | 0·0294 | 0·0224 | *** | 1·11 | 1·07 | n.s. |
Mean values are presented (n = 12). Effects of [CO2] are tested by t‐test. ***P < 0·001, **P < 0·01, *P < 0·05, n.s., not significant.
The effect of elevated [CO2] on the leaf mass ratio, fLM, was not consistent. Whilst no significant effect was found in five out of nine treatments (Table 2), small but significant reductions were observed at N1 on day 40, N2 on day 50, and N3 on days 40 and 50 (–3·7 % on average). On the other hand, elevated [CO2] significantly increased leaf mass per area, MLA, at all N levels and ages (+29 % on average). Therefore, the reduction in F is attributable to the increase in MLA rather than the decrease in fLM [Table 2; eqn (2)].
The reduction in σN with elevated [CO2] (–34 % on average; Table 2) may be ascribed to a more rapid depletion of N owing to growth enhancement at elevated [CO2] (see dry mass in Table 2). Although NLM was significantly decreased by elevated [CO2] at all N levels and ages (–27 % on average), NLA was not affected by [CO2] except for the high‐N treatment on day 40 (–8 %), due to the significant increase in MLA [eqn (4)].
Modelling relative growth rate
All constants in the growth model [a, b, c, d and e in eqns (3) and (5)] were determined from the experiment. The difference in regression of E as a function of NLA [eqn (3), Fig. 1A] was not significant for the two [CO2] treatments (P > 0·1, ANCOVA). However, the effect of [CO2] on E was highly significant (P < 0·001, ANOVA; Table 1) with E being 27 % higher at elevated [CO2] (Table 2), and correlations between NLA and E were significant (P < 0·05). Using regression equations calculated separately for both [CO2] levels by assuming b = 0·60 (derived from Hirose, 1984) for both [CO2] levels, values of a = 10·3 and c = 0·37 were obtained for ambient [CO2] and a = 21·0 and c = 0·86 for elevated [CO2]. Figure 1B shows the relationships between plant (NP) and leaf N concentration (NLM). By fitting to eqn (5), the constants d and e were determined: d = 1·03, e = 0·0027 for ambient [CO2], and d = 1·03, e = 0·0012 for elevated [CO2]. The slope of the two lines did not differ significantly (P > 0·1, ANCOVA), but the y‐intercept did (P < 0·001, ANCOVA).
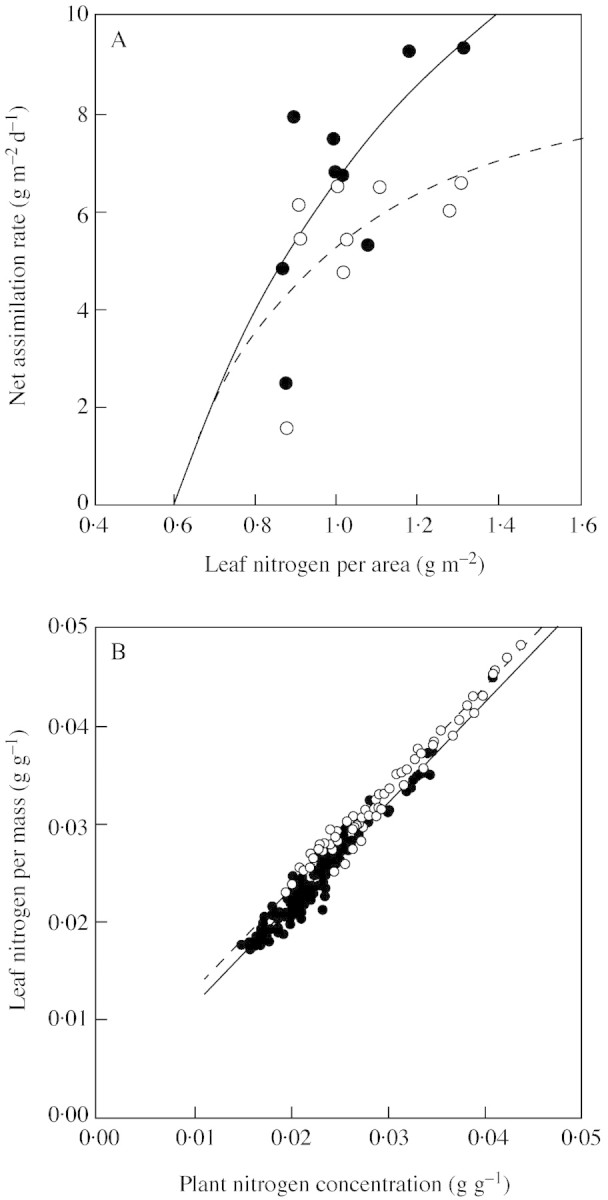
Fig. 1. Relationships between net assimilation rate (E) and leaf nitrogen content per area (NLA) (A) and between leaf nitrogen per mass (NLM) and plant nitrogen concentration (NP) (B) in Polygonum cuspidatum grown at 370 (open symbols, dashed line) or 700 µmol mol–1 CO2 (closed symbols, solid line) with different rates of N supply. A, Each point is the mean for each N level and plant age. Data were fitted to a rectangular hyperbolic function [eqn (3)]: y = 10·3(x – 0·60)/(x – 0·23) (r = 0·58), ambient [CO2]; y = 21·0(x – 0·60)/(x + 0·26) (r = 0·71), elevated [CO2]. B, Each point represents an individual plant (n = 108). Data were fitted to linear functions [eqn (5)]: y = 1·03x + 0·0027 (r = 0·98), ambient [CO2]; y = 1·03x + 0·0012 (r = 0·97), elevated [CO2].
Sensitivity analyses
To assess whether the observed increase in MLA contributed to the growth enhancement under elevated [CO2], R was calculated with the model using both values of MLA observed at ambient and at elevated [CO2]. Because the effect of [CO2] on fLM was small (Table 2), the value of fLM averaged over the two [CO2] treatments in each N level and age was used for model calculations to study the effect of MLA on R. For σN, values observed in each [CO2], N and age treatment were used.
Sensitivity analyses are exemplified for the data on day 30 in Table 3. At ambient [CO2], the high MLA (observed at elevated [CO2]) slightly increased R at N1 (4 %) and N2 (0·01 %), but decreased it at N3 (–8 %). Similar results were obtained for days 40 and 50 (see below). Across all combinations of N levels and ages, the high MLA led, on average, to a 0·1 % reduction in R at ambient [CO2]. On the other hand, at elevated [CO2], the high values of MLA always increased R (by 15, 11 and 6 % at N1, N2 and N3, respectively), as compared with the low MLA observed at ambient [CO2]. Similar results were also obtained for days 40 and 50 (see below). Across all combinations of N levels and ages, the high MLA led, on average, to a 13·0 % increase in R at elevated [CO2] as compared with the lower MLA observed at ambient [CO2].
Table 3.
Sensitivity analyses of the effect of leaf mass per area (MLA) on leaf N content on an area basis (NLA), net assimilation rate (E), leaf area ratio (F), and relative growth rate (R)
| N | CO2 | σN (g N g–1d–1) | f LM | MLA (g m–2) | NLA (g N m–2) | E (g m–2 d–1) | F(m2 g–1) | R (g g–1 d–1) |
| N1 | Ambient | 0·0086 | 0·64 | 30·8 | 0·87 | 4·34 | 0·0208 | 0·090 |
| 0·64 | 39·1 | 1·06 | 5·75 | 0·0164 | 0·094 | |||
| Elevated | 0·0052 | 0·64 | 30·8 | 0·74 | 2·94 | 0·0208 | 0·061 | |
| 0·64 | 39·1 | 0·82 | 4·28 | 0·0164 | 0·070 | |||
| N2 | Ambient | 0·0120 | 0·67 | 32·1 | 0·95 | 5·03 | 0·0209 | 0·105 |
| 0·67 | 39·8 | 1·18 | 6·30 | 0·0168 | 0·106 | |||
| Elevated | 0·0079 | 0·67 | 32·1 | 0·79 | 3·83 | 0·0209 | 0·080 | |
| 0·67 | 39·8 | 0·89 | 5·29 | 0·0168 | 0·089 | |||
| N3 | Ambient | 0·0268 | 0·71 | 31·0 | 1·20 | 6·38 | 0·0229 | 0·146 |
| 0·71 | 40·4 | 1·68 | 7·67 | 0·0176 | 0·135 | |||
| Elevated | 0·0204 | 0·71 | 31·0 | 0·94 | 5·98 | 0·0229 | 0·137 | |
| 0·71 | 40·4 | 1·16 | 8·24 | 0·0176 | 0·145 |
Observed values of specific absorption rate (σN) for each [CO2] and N‐supply at day 30 were used for calculations. Leaf mass ratios (fLM) were averaged across ambient and elevated CO2 treatments.
Results of the sensitivity analysis are summarized in Fig. 2, in which R, calculated by substitution of the high (observed at elevated [CO2]) MLA for plants on day 30, 40 and 50 is plotted against R for the low (observed at ambient [CO2]) MLA. Open and closed circles denote plants growing at ambient and elevated [CO2], respectively. The diagonal line indicates that R for low MLA is equal to that for high MLA, i.e. there is no effect of MLA on R. Circles below the diagonal represent plants whose relative growth rate decreased with higher MLA, while circles above the diagonal represent plants whose relative growth rate increased with higher MLA. Plants growing at ambient [CO2] were distributed along the diagonal line, indicating that some plants had higher R and others lower R with the high MLA. All plants growing at elevated [CO2] were distributed above the diagonal, indicating that they all benefited by the high MLA.

Fig. 2. Scattergram of the relative growth rate (R) calculated by substitution of a high leaf mass per area (MLA) against R calculated with a low MLA for plants growing at ambient (open symbols) and at elevated [CO2] (closed symbols). High and low MLA are observed values for plants grown for 30, 40 and 50 d with three N levels at elevated and ambient [CO2], respectively. The diagonal line indicates calculated R being equal for the two MLA values.
Maximization of relative growth rate
Using the values of σN observed at ambient and at elevated [CO2], R was calculated for various combinations of fLM and MLA (Fig. 3). There was an optimal combination of fLM and MLA that maximized R. Figure 3 shows the optimal combinations calculated for σN‐values observed in N3 on day 30, i.e. 0·0268 and 0·0204 g N g–1 d–1 at ambient and elevated [CO2]. The optimal fLM was similar (around 0·46) for both [CO2] levels, whereas the optimal MLA was higher at elevated than at ambient [CO2] (24·5 and 15·0 g m–2, respectively).
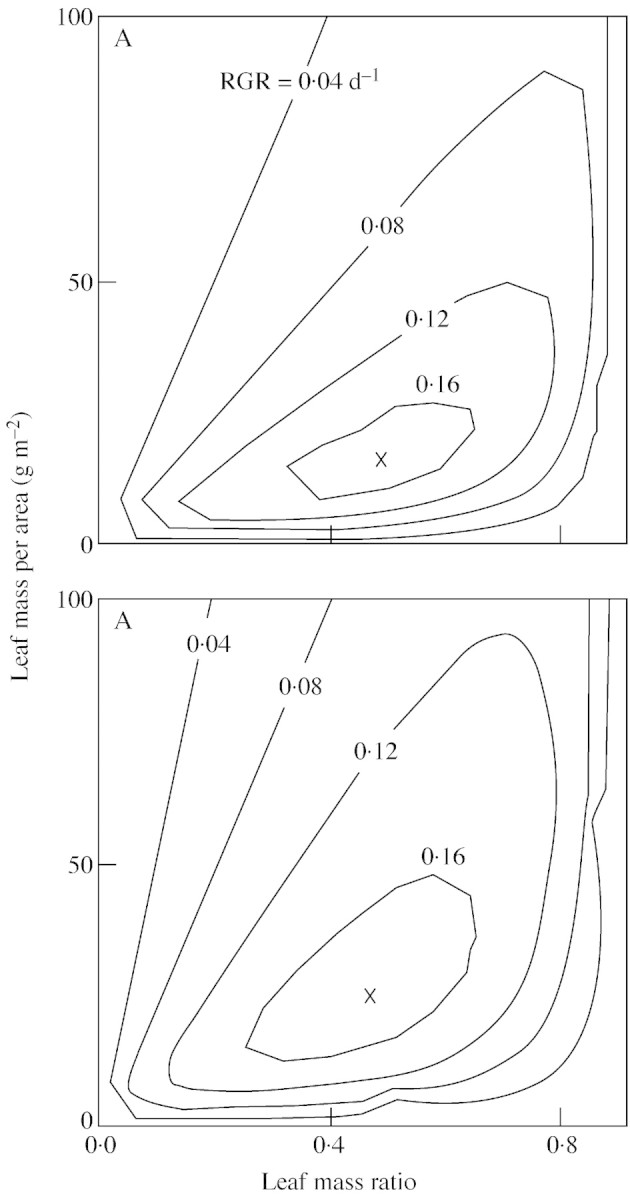
Fig. 3. Relative growth rate (R, contours) calculated by the steady‐state growth model for different combinations of leaf mass ratio (fLM) and leaf mass per area (MLA). A, Ambient [CO2]; B, elevated [CO2]. The specific absorption rates (σN) observed in plants grown at high N supply (N3) on day 30 are used for the calculation: 0·0268 g N g–1 d–1, ambient [CO2]; 0·0204 g N g–1 d–1, elevated [CO2]. Crosses represent the coordinates that maximize R. Constants: a = 10·3, b = 0·60, c = 0·37, d = 1·03 and e = 0·0027, ambient [CO2]; a = 21·0, b = 0·60, c = 0·86, d = 1·03 and e = 0·0012, elevated [CO2].
The optimal fLM and MLA, and the maximized R, were plotted against σN together with values actually observed in the experiment (Fig. 4). The optimal fLM differed little between the two [CO2] levels, and was nearly constant across σN. The optimal MLA, on the other hand, was higher at elevated than at ambient [CO2] and decreased with increasing σN. For a given σN, the maximized R was higher at elevated [CO2].
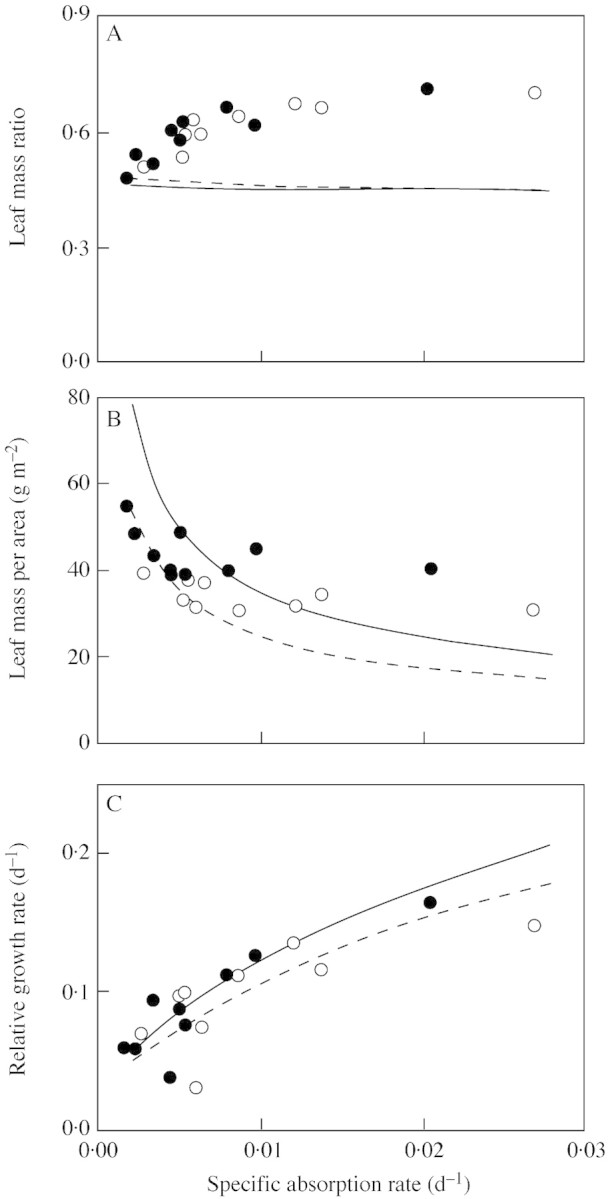
Fig. 4. The optimal leaf mass ratio (fLM, A) and leaf mass per area (MLA, B) that maximize the relative growth rate (R, C), plotted against specific absorption rate (σN). Lines are the theoretical optimum calculated from the model for 370 (dashed) and 700 µmol mol–1 CO2 (solid). Values observed at 370 (open symbols) and 700 µmol mol–1 CO2 (closed symbols). Constants are the same as in Fig. 3.
DISCUSSION
The effects of elevated [CO2] on plants observed in the present experiment (Table 2) are mostly in accord with those reported previously (for a review, see Poorter et al., 1996). [CO2] elevation increased plant dry mass, but did not increase R. This discrepancy could be ascribed to the stimulation of growth at the stage earlier than the first harvest. Such transient stimulation of R has often been observed in other studies (e.g. Bazzaz et al., 1989; Dippery et al., 1995). E was increased by elevated [CO2], while F was decreased, as has been documented in a number of studies (e.g. Norby and O’Neill, 1991; Lutze and Gifford, 1998; Atkin et al., 1999). Small effects of elevated [CO2] on fLM are also consistent with previous studies which showed that elevated [CO2] either decreased or had no effect on fLM (e.g. Stulen and den Hertog, 1993; Luo et al., 1999; Norby et al., 1999). On the other hand, a significant increase in MLA is well documented (e.g. Arp, 1991; Luo et al., 1994; Atkin et al., 1999). Thus the reduction in F at elevated [CO2] was attributable mainly to the increase in MLA, rather than the reduction in fLM (Poorter et al., 1996).
R declined faster with age at elevated [CO2] in the present experiment (Table 2). Previous studies ascribed such a decline in growth stimulation to a reduction in E and photosynthesis by long‐term exposure to elevated [CO2] (e.g. Bazzaz et al., 1989; Thomas and Strain, 1991). However, our results did not show a reduction in E because NLA was not decreased (Table 2; see Luo et al., 1994); rather, the reduction in R should be attributed to a significant decrease in σN (Table 2). Because nutrients were not added exponentially but at a constant rate, it is likely that enhanced growth at elevated [CO2] led to a more rapid reduction in σN (Table 2), which might have decreased R via a reduction in fLM (Figs 3C and 4A).
The adaptive significance of dry mass allocation has been assessed by using sensitivity analyses (Hirose 1987, 1988) and optimization models of plant growth (Hilbert, 1990; Hilbert et al., 1991; Lloyd and Farquhar, 1996). However, there seems to be no theoretical study in which both fLM and MLA have been treated as independent variables to examine their effects on plant growth at elevated [CO2]. In the present study, we tested whether the [CO2] response of actual plants benefited growth at a given [CO2] level. The present steady‐state growth model described R as a function of three independent variables, σN, fLM and MLA, with five constants (a–e) determined for ambient and elevated [CO2]. The main effect of [CO2] was exhibited in the relationship between NLA and E [eqn (3) and Fig. 1A]. We assumed different equations for the relationship at both [CO2] levels, because E was significantly higher at elevated [CO2] (Tables 1 and 2) and because rates of photosynthesis per unit leaf nitrogen have been found to increase with [CO2] elevation (Hirose et al., 1997; Peterson et al., 1999b). E is the rate of leaf photosynthesis from which daily plant respiration is subtracted. Since [CO2] elevation increases the rate of photosynthesis with little effect on respiration (Amthor, 1997), E is expected to increase with elevated [CO2]. As the rate of respiration increases with increasing protein content, E shows a more strongly curvilinear relationship with NLA (Hirose, 1984) than the light‐saturated rate of photosynthesis (Field and Mooney, 1986). Another seemingly less important effect of [CO2] was found in the relationship between NP and NLM [eqn (5) and Fig. 1B].
Sensitivity analyses have suggested that an increase in MLA enhances R at elevated [CO2], while this is not the case at ambient [CO2] (Table 3; Fig. 2). This result is somewhat surprising because an increase in MLA leads to a reduction in F [eqn (2)] and, consequently, in R [eqn (1)]. Increased MLA may be disadvantageous because a large amount of dry mass is not used to expand leaf area. For a constant leaf N content, however, leaf area expansion is coupled with a lowering of NLA (Hirose, 1984; Hikosaka and Terashima, 1995). If a plant produces a large leaf area with a limited N content, photosynthesis on a per area basis would decrease owing to a reduction in NLA [eqn (3)]. The increase in MLA compensated for the reduction in NLM, and increased NLA (Table 3), as indicated by Luo et al. (1994) [eqn (4)]. Thus, the increase in MLA benefited the plant by increasing E [eqn (3)]; this effect was larger at elevated than at ambient [CO2] (Fig. 1A). R was not increased by an increase in MLA at ambient [CO2] where the benefit of the increase in E was just offset by a simultaneous reduction in F (Table 3). On the other hand, R was increased at elevated [CO2] where an increase in MLA increased E, which more than compensated for the reduction in F (Table 3). These results are in accord with those of Peterson et al. (1999a) who showed that whilst [CO2] elevation decreased NLM in most species, it increased MLA and consequently had little effect on NLA. These authors demonstrated that a higher photosynthetic capacity at elevated [CO2] was dominated by the reduction in [CO2] limitation.
The increase in MLA under elevated [CO2] may result from the accumulation of non‐structural carbohydrates in leaves owing to source–sink imbalance and/or limitation in the phloem‐loading process (Cure et al., 1991; Sims et al., 1998). However, several studies have suggested that the increase in MLA under elevated [CO2] was accompanied by thicker mesophyll tissues (Thomas and Harvey, 1983; Arp, 1991; Luo et al., 1994). When P. cuspidatum was grown under conditions similar to those used in the present experiment, the starch‐free leaf mass per area increased significantly (27 %) with elevated [CO2] (Y. Onoda, unpubl. res.). This may contribute to developing a large photosynthetic apparatus per unit leaf area with lower NLM at elevated [CO2]. Even if an increase in MLA were the result of accumulation of non‐structural carbohydrates (Poorter et al., 1997), plants could have used these to expand their leaf area, but with a reduction in E. The present analysis suggests that the increase in MLA contributed to increasing R with an increase in E at elevated [CO2] but not at ambient [CO2] (Table 3).
The present results are also informative on the issue of optimization. An optimal combination of fLM and MLA was calculated to maximize R. The optimal fLM was found to differ only slightly between the two [CO2] levels, and was nearly constant across σN (Fig. 4A). The optimal MLA, on the other hand, decreased with increasing σN, and was higher at elevated than at ambient [CO2] for a common σN (Fig. 4B). These predictions explain the [CO2] responses in actual plants, where fLM was only slightly affected by [CO2] elevation, whilst MLA was much increased (Table 2). However, the model predictions do not explain the actual responses to N levels (σN): the observed fLM increased with increasing σN whilst the optimal fLM remained constant, and the observed MLA did not have such a wide range as that of the optimal MLA (Fig. 4). A possible explanation for these discrepancies may lie in the constraint on plasticity in MLA. MLA is related to leaf thickness as well as leaf density, which changes with non‐structural carbohydrate content (Poorter et al., 1997). Leaf thickness and density are determined by several biological aspects other than leaf N and non‐structural carbohydrates, for example, the content of defensive compounds, chlorophylls, [CO2] diffusion in the leaf, heat capacitance, transpiration, physical toughness and leaf longevity. Extremely thick leaves would be disadvantageous because the bulk resistance to [CO2] diffusion within the leaf would increase, thus lowering the efficiency of photosynthesis by reducing the CO2 concentration in the chloroplast (Evans, 1999; Terashima et al., 2001). Extremely thin leaves, on the other hand, may be fragile and may lose water easily (Gutschick, 1999). Therefore, canopy leaves that are exposed to strong light should have thick mesophyll (Terashima et al., 2001). Moreover, thin leaves have a limited volume in which to accommodate chloroplasts (Oguchi et al., 2003), and may also be less resistant to herbivory because the amount of defensive compounds, such as lignin and tannin, would be lower (Nabeshima et al., 2001). These constraints may be involved in the optimal MLA not being realized in actual plants. The plastic change in fLM might have evolved as a substitute mechanism to maintain high growth rates despite the limited plasticity in MLA.
Although the plants used in this experiment were not selected for in an atmosphere with high [CO2], they do respond positively to elevated [CO2]. How do plants sense a change in [CO2]? The primary effect of elevated [CO2] on a plant may be an increase in C uptake, which could also be caused by changes in other environment factors, such as high light intensity. This enhancement in C uptake changes the C/N uptake balance. To maintain a C/N balance within a plant, MLA may increase when the environment favours C uptake (e.g. elevated [CO2] and high light conditions), whilst allocation to roots may increase when the environment limits N uptake (e.g. lower nutrient availability). Even if the dry mass allocation pattern did not change as a direct response to elevated [CO2], it could change as a secondary response through the change in C/N uptake balance.
In conclusion, the present steady‐state growth model has demonstrated that the increase in leaf mass per area leads to a growth enhancement under elevated [CO2], which has otherwise been considered to be a result of source–sink imbalance. The model predicted an optimal combination of leaf mass ratio and leaf mass per area, where the leaf mass ratio does not change in response to [CO2] and N availability if the leaf mass per area can change plastically enough. Actual plants may have developed plasticity in their leaf mass ratio to compensate for the limited plasticity in their leaf mass per area.
ACKNOWLEDGEMENTS
We thank Ken‐ichi Sato, Hisae Nagashima, Toshihiko Kinugasa and Yusuke Onoda for help in the experimental set‐up, and Satoki Sakai for valuable comments. Y. Onoda kindly allowed us to cite his unpublished data. This study was supported in part by Grants‐in‐aid of the Japan Ministry of Education, Science and Culture.
APPENDIX
Table A1.
List of symbols used in equations
| Symbols | Explanation (unit) | |
| E | Net assimilation rate | Rate of dry mass increase per unit leaf area (g m–2 d–1) |
| F | Leaf area ratio | Ratio of leaf area to plant mass (m2 g–1) |
| f LM | Leaf mass ratio | Fraction of plant mass in leaf (g g–1) |
| f RM | Root mass ratio | Fraction of plant mass in root (g g–1) |
| f SM | Stem mass ratio | Fraction of plant mass in stem (g g–1) |
| M LA | Leaf mass per area | Leaf mass per unit leaf area (g m–2) |
| N LA | Leaf N per area | Leaf N per unit leaf area (g N m–2) |
| N LM | Leaf N concentration | Leaf N per unit leaf mass (g N g–1) |
| N P | Plant N concentration | Plant N per plant mass (g N g–1) |
| R | Relative growth rate | Rate of dry mass increase per unit plant mass (g g–1 d–1) |
| σN | Specific absorption rate | Rate of N uptake per unit root mass (g N g–1 d–1) |
| Equations | ||
| R = EF | ||
| F = fLM / MLA | ||
| E = a(NLA – b)/(NLA – b + c) | ||
| NLA = NLMMLA | ||
| NLM = dNP + e | ||
| fLM + fSM + fRM = 1 | ||
| NP = (σ NfRMMLA) / (E. fLM) | ||
Supplementary Material
Received: 23 October 2002; Returned for revision: 17 December 2002; Accepted: 28 February 2003 Published electronically: 15 April 2003
References
- AmthorJS.1997. Plant respiratory responses to elevated CO2 partial pressure. In: Allen LH Jr, Kirkham MB, Olszyk DM, Whitman C, eds. Advances in carbon dioxide effects research. Madison, Wisconsin: American Society of Agronomy. [Google Scholar]
- ArpWJ.1991. Effects of source‐sink relations on photosynthetic acclimation to elevated CO2 Plant, Cell and Environment 14: 869–875. [Google Scholar]
- AtkinOK, Schortemeyer M, McFarlane N, Evans JR.1999. The response of fast‐ and slow‐growing Acacia species to elevated atmospheric CO2: an analysis of the underlying components of relative growth rate. Oecologia 120: 544–554. [DOI] [PubMed] [Google Scholar]
- BarnolaJM, Raynaud D, Korotkevich YS, Lorius C.1987. Vostok ice core provides 160 000 year record of atmospheric CO2 Nature 329: 408–414. [Google Scholar]
- BazzazFA.1990. The response of natural ecosystems to the rising global CO2 levels. Annual Review of Ecology and Systematics 21: 167–196. [Google Scholar]
- BazzazFA, Garbutt K, Reekie EG, Williams WE.1989. Using growth analysis to interpret competition between a C3 and C4 annual under ambient and elevated CO2 Oecologia 79: 223–235. [DOI] [PubMed] [Google Scholar]
- BrouwerR.1962. Nutritive influences on the distribution of dry matter in the plant. Netherlands Journal of Agricultural Science 10: 399–408. [Google Scholar]
- BrouwerR.1983. Functional equilibrium: sense or nonsense? Netherlands Journal of Agricultural Science 31: 335–348. [Google Scholar]
- ChibaN, Hirose T.1993. Nitrogen acquisition and use in three perennials in the early stage of primary succession. Functional Ecology 7: 287–292. [Google Scholar]
- ConroyJP, Milham PJ, Barlow EWR.1992. Effect of nitrogen and phosphorus availability on the growth response of Eucalyptus grandis to high CO2 Plant, Cell and Environment 15: 843–847. [Google Scholar]
- CureJD, Rufty TW Jr, Israel DW.1991. Assimilate relations in source and sink leaves during acclimation to a CO2‐enriched atmosphere. Physiologia Plantarum 83: 687–695. [Google Scholar]
- CurtisPS, Wang X.1998. A meta‐analysis of elevated CO2 effects on woody plant mass, form, and physiology. Oecologia 113: 299–313. [DOI] [PubMed] [Google Scholar]
- DavidsonRL.1969. Effect of root/leaf temperature differentials on root/shoot ratios in some pasture grasses and clover. Annals of Botany 33: 561–569. [Google Scholar]
- DipperyJK, Tissue DT, Thomas RB, Strain BR.1995. Effects of low and elevated CO2 on C3 and C4 annuals. I. Growth and biomass allocation. Oecologia 101: 13–20. [DOI] [PubMed] [Google Scholar]
- EvansJR.1999. Leaf anatomy enables more equal access to light and CO2 between chloroplasts. New Phytologist 143: 93–104. [Google Scholar]
- FieldCB, Mooney HA.1986. The photosynthesis‐nitrogen relationship in wild plants. In: Givnish TJ, ed. On the economy of plant form and function Cambridge: Cambridge University Press, 25–55. [Google Scholar]
- GutschickVP.1999. Biotic and abiotic consequences of differences in leaf structure. New Phytologist 143: 3–18. [Google Scholar]
- HikosakaK, Terashima I.1995. A model of the acclimation of photosynthesis in the leaves of C3 plants to sun and shade with respect to nitrogen use. Plant, Cell and Environment 18: 605–618. [Google Scholar]
- HikosakaK, Terashima I.1996. Nitrogen partitioning among photosynthetic components and its consequence in sun and shade plants. Functional Ecology 10: 335–343. [Google Scholar]
- HilbertDW.1990. Optimization of plant root : shoot ratios and internal nitrogen concentration. Annals of Botany 66: 91–99. [Google Scholar]
- HilbertDW, Larigauderie A, Reynolds JF.1991. The influence of carbon dioxide and daily photon‐flux density on optimal leaf nitrogen concentration and root : shoot ratio. Annals of Botany 68: 365–376. [Google Scholar]
- HiroseT.1984. Nitrogen use efficiency in growth of Polygonum cuspidatum Sieb. et Zucc. Annals of Botany 54: 695–704. [Google Scholar]
- HiroseT.1986. Nitrogen uptake and plant growth. II. An empirical model of vegetative growth and partitioning. Annals of Botany 58: 487–496. [Google Scholar]
- HiroseT.1987. A vegetative plant growth model: adaptive significance of phenotypic plasticity in matter partitioning. Functional Ecology 1: 195–202. [Google Scholar]
- HiroseT.1988. Nitrogen availability, optimal shoot/root ratios and plant growth. In: Werger MJA, van der Aart PJM, During HJ, Verhoeven JTA, eds. Plant form and vegetation structure The Hague: SPB Academic Publishing, 135–145. [Google Scholar]
- HiroseT, Ackerly DD, Traw MB, Ramseier D, Bazzaz FA.1997. CO2 elevation, canopy photosynthesis, and optimal leaf area index. Ecology 78: 2339–2350. [Google Scholar]
- JacksonRB, Reynolds HL.1996. Nitrate and ammonium uptake for single‐ and mixed‐species communities grown at elevated CO2 Oecologia 105: 74–80. [DOI] [PubMed] [Google Scholar]
- KachiN, Rorison IH.1989. Optimal partitioning between root and shoot in plants with contrasted growth rates in response to nitrogen availability and temperature. Functional Ecology 3: 549–559. [Google Scholar]
- LarigauderieA, Hilbert DW, Oechel WC.1988. Effect of CO2 enrichment and nitrogen availability on resource acquisition and resource allocation in a grass, Bromus mollis. Oecologia 77: 544–549. [DOI] [PubMed] [Google Scholar]
- LloydJ, Farquhar GD.1996. The CO2 dependence of photosynthesis, plant growth responses to elevated atmospheric CO2 concentrations and their interaction with soil nutrient status. I. General principles and forest ecosystems. Functional Ecology 10: 4–32. [Google Scholar]
- LuoY, Field CB, Mooney HA.1994. Predicting responses of photosynthesis and root fraction to elevated [CO2]a: interactions among carbon, nitrogen, and growth. Plant, Cell and Environment 17: 1195–1204. [Google Scholar]
- LuoY, Reynolds J, Wang Y, Wolfes D.1999. A search for predictive understanding of plant responses to elevated [CO2]. Global Change Biology 5: 143–156. [Google Scholar]
- LutzeJL, Gifford RM.1998. Acquisition and allocation of carbon and nitrogen by Danthonia richardsonii in response to restricted nitrogen supply and CO2 enrichment. Plant, Cell and Environment 21: 1133–1141. [Google Scholar]
- NabeshimaE, Murakami M, Hiura T.2001. Effects of herbivory and light conditions on induced defense in Quercus crispula Journal of Plant Research 114: 403–409. [Google Scholar]
- NagashimaH, Yamano T, Hikosaka K, Hirose T.2003. Effects of elevated CO2 on the size structure in even‐aged monospecific stands of Chenopodium album. Global Change Biology 9: 619–629. [Google Scholar]
- NorbyRJ, O’Neill EG.1991. Leaf area compensation and nutrient interactions in CO2‐enriched seedlings of yellow‐poplar (Lirio dendron tulipifera L.). New Phytologist 117: 515–528. [Google Scholar]
- NorbyRJ, Wullschleger SD, Gunderson CA, Johnson DW, Ceulemans R.1999. Tree responses to rising CO2 in field experiments: implications for the future forest. Plant, Cell and Environment 22: 683–714. [Google Scholar]
- OguchiR, Hikosaka K, Hirose T.2003. Does the photosynthetic light‐acclimation need change in leaf anatomy? Plant, Cell and Environment 26: 505–512. [Google Scholar]
- PetersonAG, Ball JT, Luo Y, Field CB, Curtis PS, Griffin KL, Gunderson CA, Norby RJ, Tissue DT, Forstreuter Met al.1999a. Quantifying the response of photosynthesis to changes in leaf nitrogen content and leaf mass per area in plants grown under atmospheric CO2 enrichment. Plant, Cell and Environment 22: 1109–1119. [Google Scholar]
- PetersonAG, Ball JT, Luo Y, Field CB, Reich PB, Curtis PS, Griffin KL, Gunderson CA, Norby RJ, Tissue DTet al.1999b. The photosynthesis – leaf nitrogen relationship at ambient and elevated atmospheric carbon dioxide: a meta‐analysis. Global Change Biology 5: 331–346. [Google Scholar]
- PetterssonR, McDonald AJS, Stadenberg I.1993. Responses of small birch plants (Betula pendula Roth.) to elevated CO2 and nitrogen supply. Plant, Cell and Environment 16: 1115–1121. [Google Scholar]
- PoorterH, Roumet C, Campbell BD.1996. Interspecific variation in the growth response of plants to elevated CO2: a search for functional types. In: Körner C, Bazzaz FA, eds. Carbon dioxide, populations, and communities San Diego: Academic Press, 375–412. [Google Scholar]
- PoorterH, Van Berkel Y, Baxter B, Den Hertog J, Dijkstra P, Gifford RM, Griffin KL, Roumet C, Roy J, Wong SC.1997. The effect of elevated CO2 on the chemical composition and construction costs of leaves of 27 C3 species. Plant, Cell and Environment 20: 474–482. [Google Scholar]
- RogersGS, Milham PJ, Gillings M, Conroy JP.1996. Sink strength may be the key to growth and nitrogen responses in N‐deficient wheat at elevated CO2 Australian Journal of Plant Physiology 23: 253–264. [Google Scholar]
- SimsDA, Luo Y, Seemann JR.1998. Comparison of photosynthetic acclimation to elevated CO2 and limited nitrogen supply in soybean. Plant, Cell and Environment 21: 945–952. [Google Scholar]
- StittM, Krapp A.1999. The interaction between elevated carbon dioxide and nitrogen nutrition: the physiological and molecular background. Plant, Cell and Environment 22: 583–621. [Google Scholar]
- StulenI, den Hertog J.1993. Root growth and functioning under atmospheric CO2 enrichment. Vegetation 104/105: 99–115. [Google Scholar]
- TerashimaI, Miyazawa S, Hanba YT.2001. Why are sun leaves thicker than shade leaves? Consideration based on analyses of CO2 diffusion in the leaf. Journal of Plant Research 114: 93–105. [Google Scholar]
- ThomasJF, Harvey CN.1983. Leaf anatomy of four species grown under continuous CO2 enrichment. Botanical Gazette 144: 303–309. [Google Scholar]
- ThomasRB, Strain BR.1991. Root restriction as a factor in photosynthetic acclimation of cotton seedlings grown in elevated carbon dioxide. Plant Physiology 96: 627–634. [DOI] [PMC free article] [PubMed] [Google Scholar]
- ThornleyJHM.1972. A balanced quantitative model for root : shoot ratios in vegetative plants. Annals of Botany, 36, 431–441. [Google Scholar]
- ThornleyJHM.1975. Comment on a recent paper by Hunt on shoot : root ratios. Annals of Botany 39: 1149–1150. [Google Scholar]
- TissueDT, Griffin KL, Thomas RB, Strain BR.1995. Effects of low and elevated CO2 on C3 and C4 annuals. II. Photosynthesis and leaf biochemistry. Oecologia 101: 21–28. [DOI] [PubMed] [Google Scholar]
- WilsonJB.1988. A review of evidence on the control of shoot:root ratio, in relation to models. Annals of Botany 61: 433–449. [Google Scholar]
- WongSC.1979. Elevated atmospheric partial pressure of CO2 and plant growth. I. Interactions of nitrogen nutrition and photosynthetic capacity in C3 and C4 plants. Oecologia 44: 68–74. [DOI] [PubMed] [Google Scholar]
- YinX.2002. Responses of leaf nitrogen concentration and specific leaf area to atmospheric CO2 enrichment: a retrospective synthesis across 62 species. Global Change Biology 8: 631–642. [Google Scholar]
Associated Data
This section collects any data citations, data availability statements, or supplementary materials included in this article.