

Abstract
It is important to investigate the molecular causes of the variation in ecologically important traits to fully understand phenotypic responses to climate change. In the Mississippi River Delta, two distinct, sympatric invasive lineages of common reed (Phragmites australis) are known to differ in several ecophysiological characteristics and are expected to become more salt resistant due to increasing atmospheric CO2 and temperature. We investigated whether different patterns of gene expression can explain their ecophysiological differences and increased vigor under future climatic conditions. We compared the transcript abundance of photosynthetic genes of the Calvin cycle (Rubisco small subunit, RbcS; Phosphoglycerate kinase, PGK; Phosphoribulokinase, PRK), genes related with salt transport (Na+/H+ antiporter, PhaNHA) and oxidative stress response genes (Manganese Superoxide dismutase, MnSOD; Glutathione peroxidase, GPX), and the total aboveground biomass production between two genotypes representing the two lineages. The two genotypes (Delta-type, Mediterranean lineage, and EU-type, Eurasian lineage) were grown under an ambient and a future climate scenario with simultaneously elevated CO2 and temperature, and under two different soil salinities (0‰ or 20‰). We found neither differences in the aboveground biomass production nor the transcript abundances of the two genotypes, but soil salinity significantly affected all the investigated parameters, often interacting with the climatic conditions. At 20‰ salinity, most genes were higher expressed in the future than in the ambient climatic conditions. Higher transcription of the genes suggests higher abundance of the protein they code for, and consequently increased photosynthate production, improved stress responses, and salt exclusion. Therefore, the higher expression of these genes most likely contributed to the significantly ameliorated salinity impact on the aboveground biomass production of both P. australis genotypes under elevated temperature and CO2. Although transcript abundances did not explain differences between the lineages, they correlated with the increased vigor of both lineages under anticipated future climatic conditions.
Keywords: Common reed, Delta-type, EU-type, Mississippi River Delta, Phragmites australis, US Gulf Coast
Introduction
Greenhouse gas concentrations in the atmosphere are rising significantly due to anthropogenic fuel burning, with concomitant increases in average global temperature (IPCC 2007; Meehl et al. 2012). The atmospheric CO2 concentration, one of the major greenhouse gases, has been predicted to reach 700 ppm by the end of the 21st century, double that of just two centuries ago (Barnola et al. 1995; IPCC 2007). Among the consequences of global warming are recurring storm events, the thermal expansion of the oceans and the melting of the polar ice caps (IPCC 2007). The resulting seawater expansion into coastal areas is a threat to coastal ecosystems, especially the fresher, upper marsh vegetation.
Elevated concentrations of atmospheric CO2 can mitigate salt stress in plants (Poorter and Perez-Soba 2001), as leaf transpiration is decreased at high CO2 levels, due to lower stomata conductance. As a result, plant water status can be improved. Moreover, in C3 plants, elevated CO2 often results in higher photosynthesis rates, which can lead to improved osmotic adjustment (Perez-Lopez et al. 2009a). The surplus of C-substrates supplied by elevated CO2 can also increase the synthesis and activity of enzymes involved in the detoxification of reactive oxygen species (ROS), and thus, reduce salinity damages caused by ROS (Perez-Lopez et al. 2009b; Geissler et al. 2010). As photosynthetic stimulation by elevated CO2 has been shown to be greater under higher temperature regimes (Ainsworth and Long 2004), future climatic conditions may be highly beneficial for plant resistance to salinity.
The common reed (Phragmites australis (Cav.) Trin. ex Steud.) is a robust perennial wetland grass with a broad ecological amplitude, as evidenced by its cosmopolitan distribution and diversity of habitats, ranging from fresh to brackish and even saline waters (Haslam 1972; Brix 1999; Chambers et al. 2003). Large phenotypical, morphological, anatomical, and ecophysiological differences between and within the distinct reed genotypes and lineages have previously been reported (Clevering et al. 2001; Lessmann et al. 2001; Bastlova et al. 2006; Hansen et al. 2007; Eller and Brix 2012; Eller et al. 2013, 2014; Nguyen et al. 2013).
Phragmites australis is a natural component of North American wetlands (Orson 1999), but over the last century a Eurasian lineage has been introduced and is spreading rapidly along the North American Atlantic coast (Saltonstall 2002; Meyerson et al. 2010). Differences in salt tolerance between the native and the Eurasian lineage may have allowed the colonization of habitats unavailable to the native lineage (Vasquez et al. 2005). In the Mississippi River Delta, many more exotic genotypes of different P. australis lineages have been spreading (Hauber et al. 2011; Lambertini et al. 2012a). These phenotypically distinguishable reeds occur within the Delta mostly in adjacent monoclonal patches, and hence, with limited genotypic variation within a patch (Fig. 1). Among these, a lineage originating in the arid Mediterranean regions of Europe, North Africa and the Middle East (Lambertini et al. 2012b), appears to be coping better with the brackish conditions of the Delta, given its dominance in the area over the other Phragmites lineages and its predominant occurrence in the outer marshes of the Delta. The native P. australis ssp. americanus is largely absent in the Mississippi River Delta, and the aggressively spreading Eurasian lineage has only recently been introduced to this area where it is competing mainly with the Mediterranean lineage (White et al. 2004; Hauber et al. 2011; Lambertini et al. 2012a).
Figure 1.
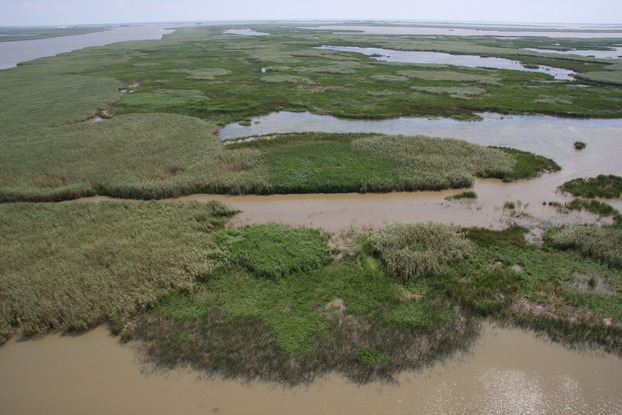
Phenotypically distinguishable, monoclonal patches of different invasive Phragmites australis types in the Mississippi River Delta. Photo: H. Brix.
These two exotic lineages do not only differ in the distribution in their native ranges, but also in their morphology and physiology (Hauber et al. 2011; Lambertini et al. 2012a,b; Guo et al. 2013; Nguyen et al. 2013). We have previously shown that a genotype of the Mediterranean lineage had superior photosynthetic traits and higher salt resistance than a genotype of the Eurasian lineage (Eller et al. 2014). In that study, we also found that simulated future climatic conditions with elevated CO2 and temperature favoured growth, photosynthesis, water use-efficiency and several other ecophysiological traits of these two competing exotic reed lineages. Overall, these observations have shown that both invasive lineages will benefit from future climatic conditions and that their invasive vigor will be enhanced.
However, to fully understand the phenotypic responses to climate change, it is important also to investigate the molecular causes of the variation in ecologically important traits. Differences in gene expression between the two exotic reed lineages are likely to cause, or underlie, the different phenotypic traits. Differences in salt tolerance between distinct P. australis genotypes have previously been ascribed to the differential expression of a potassium transporter gene (Takahashi et al. 2007), which shows how distinct physiological reed phenotypes can be explained by molecular studies. The transcript abundance is to a certain degree correlated with the abundance of the respective protein, and the abundance of an enzyme implies the level of its catalytic activity (Baerenfaller et al. 2008; Maier et al. 2009; Vogel and Marcotte 2012). We would thus expect the alleviated salinity impact and the higher photosynthetic rates of the genotypes under a future climate scenario to be caused by increased expression of the involved genes.
In this study, we compared the transcript abundance of genes involved in photosynthesis, salt transport, and oxidative stress response between two salt-exposed genotypes of the two invasive lineages (represented by the Delta-type, Mediterranean lineage and the EU-type, Eurasian lineage) under an ambient and a future climate scenario with simultaneously elevated CO2 and temperature. Previous studies (Lambertini et al. 2012a; Nguyen et al. 2013; Eller et al. 2014) showed clearly that these two genotypes are highly representative of their respective lineage, and that any variation within lineages was considerably smaller than between. In general, multifactorial effects on gene expression are rarely investigated but can elucidate how plants are responding to naturally interacting factors on the molecular level. We first hypothesized that a higher expression of the photosynthetic and salinity-related genes is responsible for the previously observed higher photosynthetic capacity and salt tolerance of the Mediterranean compared with the Eurasian genotype. Secondly, we hypothesized that under elevated CO2 and temperature, the expression of salinity-related genes would be increased in both invasive lineages due to the expected ameliorated salinity impact in the future climate scenario.
Materials and Methods
Plant material
Rhizomes of Phragmites australis with EU and Delta phenotypes (sensu Hauber et al. 2011; Lambertini et al. 2012a) were collected in the Mississippi River Delta in June 2009 and grown in a common environment at Aarhus University, Denmark (56°13′N; 10°07′E), for at least one year prior to the study. The two phenotypes were genotyped with chloroplast and nuclear DNA as haplotype M, Eurasian lineage, and haplotype M1, Mediterranean lineage, respectively (Lambertini et al. 2012a). One genotype that had previously been found to be a good representative of each lineage was chosen for this experiment: ROM2 (Eurasian lineage, hereafter called EU-type) and ROMS4 (Mediterranean lineage, hereafter called Delta-type), following the nomenclature in Nguyen et al. (2013).
Shoots were layered horizontally in water for five weeks to initiate adventitious shoot growth at the stem nodes, to produce replicates of genetically identical shoots of the two genotypes. When the adventitious shoots had developed roots and had reached a height of approximately 0.15–0.20 m, the stems were cut at both sides of the nodes, and the resulting replicate plants were planted in 3.5 L pots with commercial peat. The pots were placed in rectangular plastic containers (0.55 m l × 0.12 m h × 0.36 m d) with tap water to ensure well-watered conditions throughout the acclimation period, on tables in two walk-in growth chambers in the climate phytotron ʻRisø Environmental Risk Assessment Facilityʼ (RERAF, DTU, Denmark). The tables and pots were rotated within the chambers on a weekly basis to counteract chamber and edge effects. All plants were fertilized weekly with 0.5 L of a nutrient solution containing a commercial fertilizer (Substral®, The Scotts Company, Nordics A/S, Glostrup, Denmark). Extra micronutrients were supplied from a micronutrient stock solution (Pioner Mikro Plus Fe, Brøste, Lyngby, Denmark). Additional iron was added as Fe(II)SO4 to the nutrient solution immediately before every fertilization, to avoid the often occurring chlorosis in young P. australis leaves.
Climatic treatment
The plants were grown at either (1) a CO2 concentration of 390 ppm and a 19/12 °C day/night temperature regime (ambient climatic conditions) or at (2) a CO2 concentration of 700 ppm and a 24/17 °C day/night temperature regime (elevated climatic conditions) in two physically and electronically separated, gas tight walk-in growth chambers (6 m w, 4 m l, 3.1 m h). The treatment conditions in the elevated climatic conditions were chosen to conform to the forecast global atmospheric CO2 and temperature changes by the end of the 21st century (IPCC 2007; Meehl et al. 2012). We focused on the combined effect of CO2 and temperature only, as the effects of CO2 and temperature as single factors on P. australis vary considerably from their combined effect (Eller et al. 2013). Hence, the “ambient climatic conditions” and “elevated climatic conditions” were considered as single treatments. The chosen temperature regimes resembled cooler seasons which the reeds also face at the early onset of the growing season in the Mississippi River Delta region. Under these relatively mild temperature regimes, we assured that photosynthesis was limited by Rubisco activity and not by a decreased activation state of Rubisco due to too hot conditions, because heat stress was not the focus of this study.
Each chamber was equipped with independent ventilation systems and individually controlled light, temperature, humidity, and CO2. The air within each chamber was mixed by two opposite fans. High pressure mercury and halogen lamps supplemented the natural sunlight entering through the transparent roof, providing an irradiance of approximately 400 μmol/m2/s (photosynthetic photon flux density, PPFD) at shoot base. The day/night regime was 12/12 h. During the first and last hour of the day, sunrise and sunset were simulated by a gradually changing light intensity. The relative air humidity was set to be 55/70% (day/night). The monitored environmental conditions were stable throughout the experimental period (data not shown).
Salinity treatment
After one week of acclimation in the growth chambers, half of the plants (n = 8) in each climate treatment were exposed to increased soil water salinity. The pots of the salt-treated plants were thoroughly flushed with a 10‰ salt solution prepared from a commercial salt (98.5% NaCl) in tap water. The outer plastic containers holding the salt-treated plants were then filled to 7 cm height with the salt solution. After 1 week, salinity was increased to 20‰ and the pots thoroughly flushed, first with tap water to leach the previous salts from the soil, and then with the saline solution. Control plants (0‰ salinity) were flushed with tap water instead of saltwater but otherwise treated in a similar way as the salt-treated plants. The 20‰ salinity level was chosen based on the current understanding of the salt tolerance of P. australis (Lissner and Schierup 1997; Moore et al. 2012) to make sure that the plants were affected, but not killed. The flushing of the pots was repeated every 7 days to ensure a close to constant salt concentration in the pots, and the solution in the plastic containers holding the pots was completely replaced. Between the flushing, the plants were watered with tap water to replace water lost by evapotranspiration.
Experimental set-up
The experimental setup was a 2 × 2 × 2 factorial design with the factors genotype (“EU-type” vs. “Delta-type”), climatic conditions (“ambient” vs. “elevated”), and soil salinity (“0‰ salinity” vs. “20‰ salinity”) with eight replicates in each treatment combination. Only three of the replicates were used for gene expression analysis, but all were used to determine the aboveground biomass.
RNA extraction and quantification
After 66 days of growth under the treatment conditions, three to four young, fully developed leaves (taken from two to three shoots of similar age) per plant of three replicates within each treatment were harvested and immediately frozen in liquid nitrogen. The leaves were then pulverized in liquid nitrogen using a porcelain mortar and pestle. RNA of each replicate was extracted from the leaf material using the NucleoSpin® RNAII Kit (Macherey-Nagel, Düren, Germany) following the manufacturer′s instructions. The purity of the total RNA extracted was determined as the 260/280 nm and 260/230 nm absorbance ratio, and the integrity of the RNA was checked by electrophoresis in a 0.8% agarose gel.
Reverse transcription
The cDNA was reverse transcribed using the First-Strand cDNA Synthesis Kit, including DNase treatment (GE Healthcare Life Sciences Pittsburgh, PA, USA), from 4 μg of total RNA following the manufacturer's instructions.
Genes studied and primer design
The genes selected for this study are nuclear genes involved in photosynthesis, salt resistance and oxidative stress response. The photosynthesis-related genes code for the small subunit of Rubisco (RbcS), Phosphoglycerate kinase (PGK), and Phosphoribulokinase (PRK), which are enzymes involved in the Calvin Cycle. The salt resistance-related genes code for the Na+/H+ antiporter (PhaNHA), which is involved in Na+ transport, and for Manganese Superoxide dismutase (MnSOD) and Glutathione peroxidase (GPX), which are ROS detoxifying enzymes. The gene coding for Ubiquitin-conjugating enzyme (UBC) is a housekeeping gene, and this gene was used as reference of stable gene expression throughout the different treatments. Gene sequences were obtained from sequences in Genbank of P. australis (Davies et al. 2009; Takahashi et al. 2009), and from other species of the Poaceae family (Smith et al. 1983; White and Scandalios 1988; Longstaff et al. 1989; Raines et al. 1989; Churin et al. 1999; Chen et al. 2004; Sreenivasulu et al. 2004; Kumari et al. 2009; Wu et al. 2011). The gene sequences were aligned with the sequence alignment software MultAlin (Corpet 1988), and forward (fwd) and reverse (rev) primers were designed in the regions that scored the highest homology among alignments of up to 12 different Poaceae genera (Oryza, Zea, Hordeum, Triticum, Secale, Setaria, Sorghum, Bambusa, Lolium, Phyllostachys, Agropyron, Puccinellia). The primers were located to include an intron, to avoid the amplification of possible genomic DNA in the cDNA. The targeted gene regions were sequenced both from the cDNA and the genomic DNA. Primers used for real-time quantitative PCR (RT-qPCR) are listed in Table 2. The identity of the RT-qPCR products was confirmed by Sanger sequencing in an ABI sequencer (Applied Biosystems, Foster City, CA). The resulting sequences were edited with the sequence alignment program BioEdit v7.0.9 (Hall 1999).
RT-qPCR and gene expression data analysis
Real-time quantitative PCR (RT-qPCR) with the target and reference gene-specific primers was performed with a LightCycler® 480 (Roche Molecular Diagnostics Pleasanton, CA, USA) using LightCycler 480 SYBR Green I Master (Roche Molecular Biochemicals) and 1 μL of 25-fold diluted cDNA template for each RT-qPCR reaction. Each 20 μL reaction mixture contained 10 μL of 2 × SYBR Green I Master mix, 1 μL of each primer (10 μmol/L), 1 μL of sample cDNA, and 7 μL of sterilized ultra-pure H2O. PCR conditions were denaturation at 95 °C for 10 min, the respective annealing temperature for the primer pair for 5 s (Table 1), followed by 55 elongation cycles at 72 °C for 10 s, and the respective melting temperature for the primer pair for 1 s (Table 1). No-template controls were included in each run using sterilized ultra-pure H2O instead of template cDNA. Each replicate sample was run three times in the RT-qPCR (technical replicates).
Table 1.
Primers designed for real-time quantitative PCR of genes of invasive Phragmites australis.
| Gene | Primer | Primer sequence | Ta (°C) | Tm (°C) |
|---|---|---|---|---|
| RbcS | rbcS-fwd | 5′ GAT CAG GTG CAT GCA GGT GTG G 3′ | 56 | 84 |
| rbcS-rev | 5′ CCG ACC TTG CTG AAC TCG AGG 3′ | |||
| PGK | Phgly-fwd | 5′ GTT TGC TGT AGG AAC TGA GGC TGT 3′ | 57 | 82 |
| Phgly-rev | 5′ CAC CTC CCG TTG AAA TGT GGC TCA 3′ | |||
| PRK | Phori-fwd | 5′ GAC TCT TAC TTC GGC CAT GAG GTA TCA G 3′ | 55 | 80 |
| Phori-rev | 5′ GAA GAG ACC TGT TCC ATT GTT GCT 3′ | |||
| PhaNHA | NaH-fwd | 5′ GTG CGG CTT TTG AAT GGT GTG CA 3′ | 55 | 79 |
| NaH-rev | 5′ GGG AAC TGG ACA CTG GAC TGT AAA 3′ | |||
| GPX | GPX-fwd | 5′ GAA TTC CCT ATT TTT GAC AAG GTT GA 3′ | 55 | 77 |
| GPX-rev | 5′ GCG CAT AGC GAT CCA CAA C 3′ | |||
| MnSOD | SOD-fwd | 5′ CAA GGA TCT GGA TGG GTG TGG C 3′ | 55 | 80 |
| SOD-rev | 5′ GTA GTA CGC ATG CTC CCA GAC AT 3′ | |||
| UBC | UBC-fwd | 5′ CTT CAA GCC RCC AAA GGT MTC 3′ | 55 | 80 |
| UBC-rev | 5′ GAT ATT GTC AAA GCA GGG CTC CA 3′ |
Ta, annealing temperature of primer pair; Tm, melting temperature of primer pair.
Melting curves were run to identify the crossing point (Cp) of all samples. To ensure an equal concentration of cDNA, all samples were diluted to reach the same Cp (±1 cycle). A standard serial dilution series of a mixture of cDNA from all samples of the analysis (called calibrator) was made to correct for the PCR efficiency. To determine the relative transcript abundance of each gene, the quantification software (Roche Molecular Biochemicals) was used, which incorporated the correction for PCR efficiency, and Cp values for normalization of the target to the reference gene UBC.
The geometric means (Vandesompele et al. 2002) of the relative expression ratios for the three biological and three technical replicates were calculated. Data were transformed to the natural logarithm for analysis with Statgraphics Centurion XVI (Statpoint Technologies, Inc., Warrenton VA, USA) and tested for variance homogeneity using Bartlett's test. The General Linear Models (GLM) procedure was used with the factors “genotype”, “climatic conditions” and “soil salinity” and their interactions (n = 3). To detect differences due to treatment effects, post hoc comparisons of means at the 95% confidence level were made by Tukey's honestly significant differences (HSD) procedure. As no significant effect or interaction was found for the factor “genotype”, data for both genotypes were subsequently pooled and analyzed by a two-way Analysis of Variance (ANOVA) using ln-transformed data, to specify and simplify the analysis. The variance homogeneity was tested using Bartlett's test. Tukey's HSD tests were made post hoc to detect differences between the means. The untransformed data are shown as expression relative to the ambient climatic conditions and 0‰ salinity, which was chosen to show a relative expression of 100.
Aboveground biomass analysis
After 70 days of growth, the aboveground plant parts of all replicates (n = 8 for each treatment and genotype) were harvested and dried to constant weight at 80°C in a ventilated oven to determine their final biomass. Aboveground biomass data were analyzed by GLM as described for the gene expression data. Also for the aboveground biomass, no significant effect or interaction was found for “genotype”. Hence, data for both genotypes were pooled, and the log-transformed data were analyzed by a two-way Analysis of Variance (ANOVA) (n = 8) as described above.
Results
RNA purity and integrity
The RNA obtained from the P. australis leaves was of good quality and suitable for RT-qPCR, as suggested by Udvardi et al. (2008). The average concentration of RNA extracted was 238 ng RNA/μl. The average A260/A280 ratio of 2.1 indicated that there was no protein contamination in the preparation. Also, the agarose gels proved high integrity of the isolated RNA (not shown).
Gene sequences
All sequences obtained from the RT-qPCRs could be aligned with the respective mRNA sequences of other Poaceae species in Genbank. The accession numbers and gene product function for the P. australis partial gene sequences obtained are summarized in Table 2. There were no differences in the cDNA sequences between the EU-type and the Delta-type.
Table 2.
Genes of invasive Phragmites australis analyzed by real-time quantitative PCR. Plants were grown under ambient or elevated climatic conditions, at 0‰ or 20‰ salinity, for 70 days before harvesting.
| Gene | Name | Function | Type | Accession numbers |
|---|---|---|---|---|
| RbcS | Rubisco small subunit | CO2 fixation in 3-Phosphoglycerate | Genomic DNA; EU-type | KC130867 |
| Genomic DNA; Delta-type | KC130866 | |||
| mRNA | KC130859 | |||
| PGK | Phosphoglycerate kinase | Phosphorylation of 3-Phosphoglycerate | Genomic DNA | KC130864 |
| mRNA | KC130856 | |||
| PRK | Phosphoribulokinase | Phosphorylation of Ribulose-5-phosphate, regenerating Rubisco substrate RuBP | Genomic DNA | KC130865 |
| mRNA | KC130857 | |||
| PhaNHA | Na+/H+ antiporter | Membrane protein, Na+ translocation | Genomic DNA | KC130863 |
| mRNA | KC130855 | |||
| MnSOD | Mn2+ Superoxide dismutase | Dismutation of superoxide into O2 and H2O2 | Genomic DNA | KC130862 |
| mRNA | KC130854 | |||
| GPX | Glutathione peroxidase | Reduction of H2O2 to H2O | mRNA | KC130853 |
Expression of photosynthesis-related genes
Ubiquitin-conjugating enzyme (UBC) was stably expressed in all treatments and hence served as reliable reference gene (data not shown). The GLM revealed that the transcript abundance of the three photosynthesis-related genes was not statistically different between the two genotypes (Tables S1 and S2). As a result, the genotypes were pooled in the further statistical analysis. The two-way ANOVA showed that “climatic conditions” significantly affected the expression of PRK, while “soil salinity” affected the expression of all photosynthesis-related genes. However, the effects of soil salinity on the expressions of RbcS and PRK depended on the climatic treatment, as indicated by the significant interaction terms in the ANOVA (Table 3).
Table 3.
F-ratios of two-way Analysis of Variance (ANOVA) of aboveground biomass and transcript abundance of genes expressed in two invasive genotypes of Phragmites australis from the Mississippi River Delta. Data from the two genotypes did not differ statistically significantly for any of the parameters; hence, data are pooled in this analysis. The main factors are “climatic conditions” (Clim; ambient climatic conditions vs. elevated climatic conditions) and “soil salinity” (Sal; 0‰ salinity vs. 20‰ salinity).
| Parameter | Main factors | Interactions | |
|---|---|---|---|
| Clim (df = 1) | Sal (df = 1) | Clim × Sal (df = 1) | |
| RbcS | 0.40 | 6.63* | 12.94** |
| PGK | 3.50 | 4.42* | 4.04 |
| PRK | 4.80* | 9.70** | 4.51* |
| PhaNHA | 0.92 | 6.82* | 2.03 |
| MnSOD | 1.14 | 20.50*** | 4.40* |
| GPX | 0.32 | 21.61*** | 45.53*** |
| Aboveground biomass | 405.78*** | 565.51*** | 0.10 |
RbcS, Rubisco small subunit; PGK, Phosphoglycerate kinase; PRK, Phosphoribulokinase; PhaNHA, P. australis Na+/H+ antiporter; MnSOD, Manganese Superoxide dismutase; GPX, Glutathione peroxidase; df, degrees of freedom.
Statistically significant values are shown in bold: *<0.05 probability level, **<0.01, ***<0.001.
The expression of RbcS was not significantly affected by soil salinity under the ambient climatic conditions. Under the elevated climatic conditions, however, RbcS transcript abundance was 49% higher at 20‰ compared to 0‰ salinity (Fig. 2A). The 20‰ salinity decreased the transcript abundance of PGK by 26% under the ambient climatic conditions, but only by ∼1% under the elevated climatic conditions (Fig. 2B). Also, the expression of PRK was decreased at 20‰ salinity, but only under the ambient climatic conditions, where the transcript abundance was about 27% lower compared to 0‰ salinity (Fig. 2C).
Figure 2.
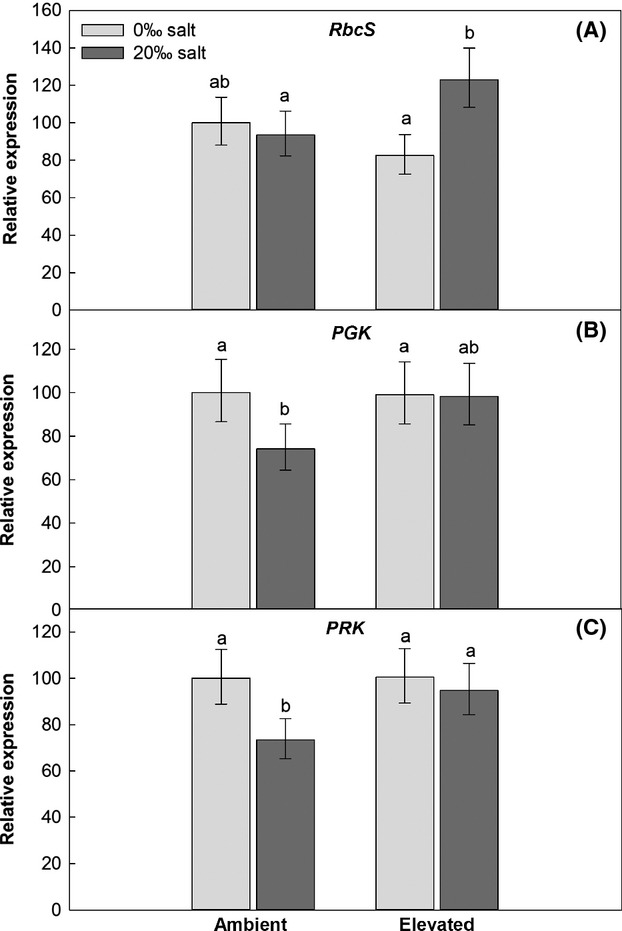
Relative expression of photosynthesis-related genes, pooled averages of two genotypes belonging to two invasive Phragmites australis lineages, grown under “ambient” and “elevated” climatic conditions, and at 0‰ or 20‰ salinity. Error bars show Tukey's HSD intervals, letters indicate statistically significant differences. Rubisco small subunit (RbcS) (A) Phosphoglycerate kinase (PGK) (B), Phosphoribulokinase (PRK) (C).
Expression of salt resistance-related genes
The GLM showed that the transcript abundances of the two genotypes did not differ for any of the three salt resistance-related genes (Tables S1 and S2). The two-way ANOVA of the pooled data showed that “soil salinity” significantly affected the expression of all three salt resistance-related genes, and that MnSOD and GPX expression were affected by a “climatic conditions × soil salinity” interaction (Table 3).
The PhaNHA transcript abundance was higher in the salt-treated plants compared with nonsalt-treated plants, in the ambient climatic conditions about 16%, and in the elevated climatic conditions about 68% (Fig. 3A).
Figure 3.
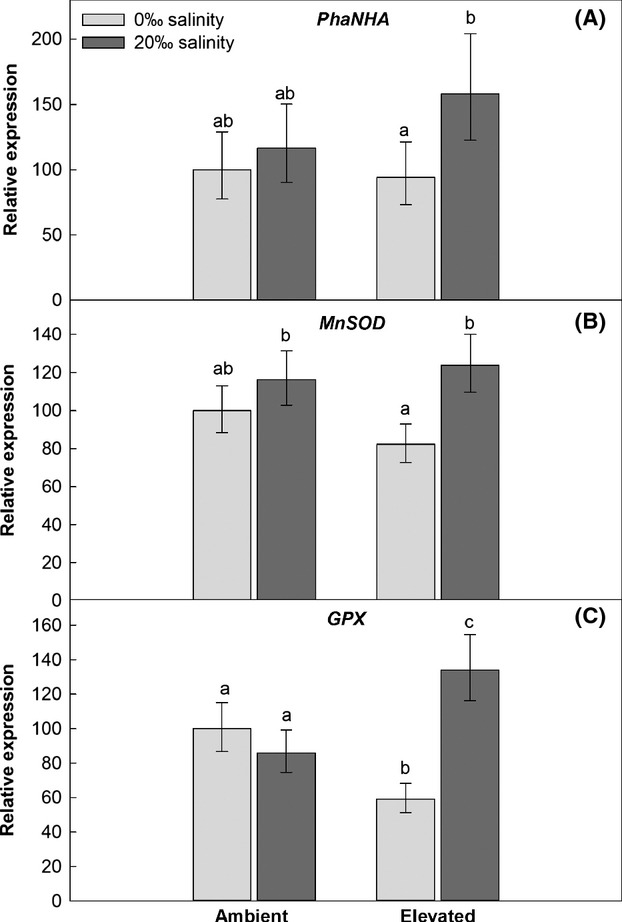
Relative expression of salt resistance-related genes, pooled averages of two genotypes belonging to two invasive Phragmites australis lineages grown under “ambient” and “elevated” climatic conditions, and at 0‰ or 20‰ salinity. Error bars show Tukey's HSD intervals, letters indicate statistically significant differences. Na+/H+ antiporter (PhaNHA) (A), Manganese Superoxide dismutase (MnSOD) (B), Glutathione peroxidase (GPX) (C).
Under the ambient climatic conditions, the transcript abundance of MnSOD was ∼16% higher at 20‰ salinity compared to 0‰ salinity. However, the difference was more pronounced under the elevated climatic conditions, with 51% higher expression in the salt-treated plants (Fig. 3B).
In plants without salt treatment, GPX expression was 41% lower at elevated than at ambient climatic conditions. In the salt-treated plants, the transcript abundance was 56% higher at elevated compared with ambient climatic conditions (Fig. 3C).
Total aboveground biomass
The GLM showed that there was no significant difference between the aboveground biomass production of the two genotypes (Tables S1 and S2). The two-way ANOVA of the pooled data showed that “soil salinity” and “climatic conditions” significantly affected the aboveground biomass (Table 3). The biomass production was about five times higher at elevated compared to ambient climatic conditions, mainly due to the large production of runners, also called “legehalme”. Salinity negatively affected biomass development in both climatic treatments, and the salt-treated plants had about four times less biomass than the plants grown at 0‰ salinity (Fig. 4).
Figure 4.
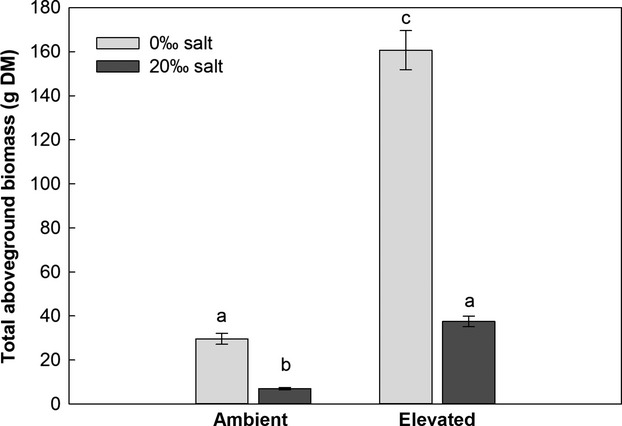
Total aboveground biomass (g dry mass, DM; n = 8; mean ± 1 SE), pooled averages of two genotypes belonging to two invasive Phragmites australis lineages, grown under “ambient” and “elevated” climatic conditions, and at 0‰ or 20‰ salinity. Letters indicate statistically significant differences.
Discussion
The aim of our study was to investigate the effect of climatic conditions on the gene expression of two genotypes, representing two invasive Phragmites australis lineages from the Mississippi River Delta, to detect possible differences between the genotypes. The two lineages, the Eurasian haplotype M and the Mediterranean haplotype M1, were previously shown to differ significantly in their salt resistance and ecophysiology (Nguyen et al. 2013; Eller et al. 2014). We hypothesized that genotypic differences in the transcript abundance of genes related to salt resistance and photosynthesis would be the underlying reason for this observation, assuming that the mRNA concentration is a proxy for the concentration and activity of the corresponding proteins (de Sousa Abreu et al. 2009). However, we could not detect any differences in the expression of the investigated genes between the two genotypes. Our two climatic treatments were less hot and humid than the conditions in the Mississippi River Delta. However, according to Guo et al. (2013), both lineages have a wide environmental tolerance and can occupy a broader climatic niche in North America than anticipated so far, also including areas with temperate climatic regimes as used in this study. Moreover, the two genotypes have previously been shown to differ in several photosynthetic traits under the same conditions as used here (Eller et al. 2014). This suggests that the chosen climatic conditions cannot account for our inability to confirm our first hypothesis. It is more likely that other factors were responsible for the phenotypic dissimilarities of the plants, such as other genes than those investigated here, epigenetic influences, or differences in protein turnover.
Although changes in gene expression are rapid and can even be more pronounced than changes in protein abundance and metabolic activity (Osuna et al. 2007), the correlation between the amount of mRNA and the gene product may be weak in certain organisms due to post-transcriptional modifications and other regulatory processes (Vogel and Marcotte 2012). Also, local gradients of transcriptional differences within plant tissue have previously been observed (Li et al. 2010) and could explain why we did not detect any differences between the two genotypes, as we analyzed pooled leaf material.
Despite the similar transcript abundances of the two genotypes, the expression of all the genes investigated was significantly affected by at least one of the two treatment factors. The RbcS, PGK, and PRK transcripts of the two P. australis genotypes were similar in the ambient and the elevated climatic conditions at 0‰ salinity. Like RbcS, PGK is involved in carbon fixation, following Rubisco as the next enzymatic step in the Calvin Cycle. PRK is related to the regeneration of the Rubisco substrate and catalyses the last enzymatic step of the Calvin Cycle. A common response of C3 plants grown at elevated CO2 is photosynthetic acclimation, implemented by downregulation of the RbcS transcript abundance, compared with the RbcS transcript abundance of plants grown at ambient CO2 (Paul and Driscoll 1997; Gesch et al. 2003). The Rubisco protein content and activity decrease correspondingly, although not to the same extent as the gene expression (Gesch et al. 2003). Our results indicate that the two genotypes showed no photosynthetic acclimation under the elevated climatic conditions, as the photosynthetic genes were not downregulated. Our elevated climatic treatment also included elevated temperature, which may have affected the transcription level and plant development (Taylor et al. 2005; Ainsworth et al. 2006; Li et al. 2008). This would explain the previously observed photosynthetic increase at elevated CO2 and temperature (Eller et al. 2014) as well as the large aboveground biomass production in the elevated climatic conditions observed in the present study.
In contrast to the climatic conditions, soil salinity significantly affected the transcript abundance of all three photosynthetic genes, and twice in interaction with the climatic treatment. The major constraints of salinity on plants are osmotic stress, gas exchange restrictions, ion toxicity, and nutritional imbalance (Greenway and Munns 1980). Plants experiencing osmotic stress due to high soil salinity face a trade-off between decreasing transpiration to minimize water loss and opening their stomata for CO2 uptake (Parida and Das 2005). CO2 assimilation may thus become limited and the transcription of photosynthesis-related genes may be downregulated. This could be seen in the present study, where the 20‰ salinity at ambient climatic conditions resulted in a lower transcript abundance of the PRK and PGK genes, whereas the transcript abundance of the RbcS gene was hardly affected. In the elevated climatic conditions, however, the expression of PGK and PRK was not negatively affected by the salt treatment, and the RbcS expression was even upregulated. The atmospheric CO2 concentration is, however, not the only factor which can affect the assimilation of salt-exposed plants. Lissner et al. (1999) found that temperature also has a significant effect, and showed that reed populations grown in a warmer climate were less affected by salinity than populations from colder areas. Also in our study, the negative salt effect on the aboveground biomass production was ameliorated in the warmer future climate scenario.
Phragmites australis tolerates low to intermediate salt concentrations, and some genotypes are even capable of surviving salinity levels as high as 72‰ (Achenbach et al. 2013). By producing osmotically active solutes in its leaves, P. australis can improve its osmoregulation and achieve salt exclusion (Lissner and Schierup 1997). However, as this tolerance mechanism includes the investment of photosynthates, it is accomplished only at the expense of biomass production, as seen in the present study.
In the salt-treated plants, particularly under the elevated climatic conditions, the Na+/H+ antiporter gene, PhaNHA, was upregulated, indicating a higher biosynthesis of the antiporter and hence increased Na+ exclusion at high salinity. Extrusion of Na+ has been shown to be an important ion-detoxification mechanism for P. australis (Matoh et al. 1988). As P. australis does not have excreting salt glands, Na+ is actively exported to the rhizosphere after retranslocation from the leaves to the roots (Matsushita and Matoh 1991). As this mechanism of salt tolerance is energy dependent, factors which affect the plant energy balance, such as photosynthesis, will also affect the resistance to salinity.
Also the expression of the MnSOD and GPX genes was higher in salt-treated plants, for GPX especially at elevated CO2 and temperature, confirming our second hypothesis. When high soil salinity reduces CO2 uptake, the internal CO2/O2 ratio decreases and photoreducing capacity accumulates. Oxygen can then be the consequent electron acceptor, generating reactive oxygen species (ROS) that can cause oxidative damage to bio-molecules (Turkan and Demiral 2009). Antioxidative molecules and specific ROS-scavenging enzymes, like those coded for by the MnSOD and GPX genes, provide protection against oxidative damage (Parida and Das 2005).
The high transcript abundance of MnSOD and GPX may be an explanation for the ameliorated salt effect under the future climate scenario. This has also been shown in Aster tripolium, where the gene expression of different antioxidant enzymes, including SOD and Ascorbate peroxidase, was increased under saline conditions and elevated CO2 compared to ambient CO2. At the same time, the resulting protein abundances and enzyme activities were increased (Geissler et al. 2009, 2010). Contrary to this, the gene expression of antioxidant enzymes in salt-stressed barley was upregulated at ambient CO2 but not at elevated CO2 (Perez-Lopez et al. 2009b). Our simulated future climate treatment did not only involve elevated CO2 but also higher temperature, which may have contributed to a faster protein turnover and an acceleration of enzymatic activities, reflected in the higher transcription of the genes. Such an energetically costly higher expression and activation of salt-tolerance mechanisms could have been facilitated by a higher photosynthetic activity (Geissler et al. 2010). This, in turn, may have been provided by an increased expression of enzymes involved with photosynthesis, like the RbcS gene in the present study.
Plants without salt treatment showed a lower expression of ROS-scavenging enzymes under the elevated compared to the ambient climatic conditions. This probably reflected the diminished need for antioxidative protection in general, as at elevated CO2 and higher temperature, ROS formation due to photorespiration is considerably reduced (Leakey et al. 2012).
Although we did not include the North American native P. australis ssp. americanus in our study, previous research has shown that the native lineage is ecophysiologically inferior to the invasive Eurasian lineage under a range of environmental conditions, including elevated CO2 (Vasquez et al. 2005; Mozdzer and Zieman 2010; Mozdzer and Megonigal 2012; Mozdzer et al. 2013). Thus, there is good reason to believe that the two genotypes investigated here and their lineages will remain the more vigorous reeds also under future climate changes at the Gulf Coast of North America.
Overall, the predicted future rise in temperature and atmospheric CO2 will facilitate an improvement in salt resistance of the two invasive P. australis genotypes investigated here. Sea level rise is a potential threat to the Gulf Coast, and although a higher salt resistance may facilitate invasive vigor of P. australis, it may also help the reeds to sustain the marshes in this area. The increased salinity resistance under a future climate scenario can be ascribed to the higher expression of genes for photosynthesis-related and antioxidant enzymes as well as the Na+/H+ antiporter for salt exclusion. However, the previously observed ecophysiological differences between the two co-occurring invasive genotypes cannot be explained by differences in the transcript abundance of these genes. Our study addressed a climate change scenario with milder, early-season temperatures. As supra-optimal temperatures may occur in the Gulf Coast following climate change, there is also a need for studies that address the effect of heat on the invasive lineages to draw further conclusions on future reed expansion.
Acknowledgments
We thank the Risø Environmental Risk Assessment Facility (RERAF) for hosting the experiment. We also thank the Danish Council for Independent Research – Natural Sciences, the Aarhus Graduate School of Science and Technology, and INCREASE (Integrated Network on Climate Research Activities on Shrub land Ecosystems), who funded this research.
Conflict of Interest
None declared.
Supporting Information
Additional Supporting Information may be found in the online version of this article:
Table S1. F-ratios of General Linear Model (GLM) analysis of aboveground biomass and transcript abundance of genes expressed in two invasive genotypes of Phragmites australis from the Mississippi River Delta.
Table S2. Results for gene expression and aboveground biomass of each of the two invasive genotypes of P. australis.
References
- Achenbach L, Eller F, Nguyen LX, Brix H. Differences in salinity tolerance of genetically distinct Phragmites australis clones. AoB Plants. 2013;5:plt019. doi: 10.1093/aobpla/plt019. [Google Scholar]
- Ainsworth EA, Long SP. What have we learned from 15 years of free-air CO2 enrichment (FACE)? A meta-analytic review of the responses of photosynthesis, canopy. New Phytol. 2004;165:351–371. doi: 10.1111/j.1469-8137.2004.01224.x. [DOI] [PubMed] [Google Scholar]
- Ainsworth EA, Rogers A, Vodkin LO, Walter A, Schurr U. The effects of elevated CO2 concentration on soybean gene expression. An analysis of growing and mature leaves. Plant Physiol. 2006;142:135–147. doi: 10.1104/pp.106.086256. [DOI] [PMC free article] [PubMed] [Google Scholar]
- Baerenfaller K, Grossmann J, Grobei MA, Hull R, Hirsch-Hoffmann M, Yalovsky S, et al. Genome-scale proteomics reveals Arabidopsis thaliana gene models and proteome dynamics. Science. 2008;320:938–941. doi: 10.1126/science.1157956. [DOI] [PubMed] [Google Scholar]
- Barnola JM, Anklin M, Porcheron J, Raynaud D, Schwander J, Stauffer B. CO2 evolution during the last millennium as recorded by Antarctic and Greenland ice. Tellus Ser. B. 1995;47B:264–272. [Google Scholar]
- Bastlova D, Bastl M, Cizkova H, Kvet J. Plasticity of Lythrum salicaria and Phragmites australis growth characteristics across a European geographical gradient. Hydrobiologia. 2006;570:237–242. [Google Scholar]
- Brix H. Genetic diversity, ecophysiology and growth dynamics of reed (Phragmites australis) – Introduction. Aquat. Bot. 1999;64:179–184. [Google Scholar]
- Chambers RM, Osgood DT, Bart DJ, Montalto F. Phragmites australis invasion and expansion in tidal wetlands: interactions among salinity, sulphide and hydrology. Estuaries. 2003;26:398–406. [Google Scholar]
- Chen XF, Yu T, Xiong JH, Zhang YP, Hua Y, Li Y, et al. Molecular cloning and expression analysis of rice phosphoribulokinase gene that is regulated by environmental stresses. Mol. Biol. Rep. 2004;31:249–255. doi: 10.1007/s11033-005-2491-5. [DOI] [PubMed] [Google Scholar]
- Churin Y, Schilling S, Borner T. A gene family encoding glutathione peroxidase homologues in Hordeum vulgare (barley) FEBS Lett. 1999;459:33–38. doi: 10.1016/s0014-5793(99)01208-9. [DOI] [PubMed] [Google Scholar]
- Clevering OA, Brix H, Lukavska J. Geographic variation in growth responses in Phragmites australis. Aquat. Bot. 2001;69:89–108. [Google Scholar]
- Corpet F. Multiple sequence alignment with hierarchical-clustering. Nucleic Acids Res. 1988;16:10881–10890. doi: 10.1093/nar/16.22.10881. [DOI] [PMC free article] [PubMed] [Google Scholar]
- Davies L, Cabrita G, Ferreira R, Carias C, Novais J, Martins-Dias S. Integrated study of the role of Phragmites australis in azo-dye treatment in a constructed wetland: from pilot to molecular scale. Ecol. Eng. 2009;35:961–970. [Google Scholar]
- Eller F, Brix H. Different genotypes of Phragmites australis show distinct phenotypic plasticity in response to nutrient availability and temperature. Aquat. Bot. 2012;103:89–97. [Google Scholar]
- Eller F, Lambertini C, Nguyen LX, Achenbach L, Brix H. Interactive effects of elevated temperature and CO2 on two phylogeographically distinct clones of common reed (Phragmites australis. AoB Plants. 2013;5:pls051. doi: 10.1093/aobpla/pls051. [Google Scholar]
- Eller F, Lambertini C, Nguyen LX, Brix H. Increased invasive potential of non-native Phragmites australis: elevated CO2 and temperature alleviate salinity effects on photosynthesis and growth. Glob. Change Biol. 2014;20:531–543. doi: 10.1111/gcb.12346. [DOI] [PubMed] [Google Scholar]
- Geissler N, Hussin S, Koyro HW. Elevated atmospheric CO2 concentration ameliorates effects of NaCl salinity on photosynthesis and leaf structure of Aster tripolium L. J. Exp. Bot. 2009;60:137–151. doi: 10.1093/jxb/ern271. [DOI] [PMC free article] [PubMed] [Google Scholar]
- Geissler N, Hussin S, Koyro HW. Elevated atmospheric CO2 concentration enhances salinity tolerance in Aster tripolium L. Planta. 2010;231:583–594. doi: 10.1007/s00425-009-1064-6. [DOI] [PubMed] [Google Scholar]
- Gesch RW, Kang IH, Gallo-Meagher M, Vu JCV, Boote KJ, Allen LH, et al. Rubisco expression in rice leaves is related to genotypic variation of photosynthesis under elevated growth CO2 and temperature. Plant, Cell Environ. 2003;26:1941–1950. [Google Scholar]
- Greenway H, Munns R. Mechanisms of salt tolerance in nonhalophytes. Annu. Rev. Plant Physiol. 1980;31:149–190. [Google Scholar]
- Guo WY, Lambertini C, Li XZ, Meyerson L, Brix H. Invasion of Old World Phragmites australis in the New World: precipitation and temperature patterns combined with human influences redesign the invasive niche. Glob. Change Biol. 2013;19:3406–3422. doi: 10.1111/gcb.12295. [DOI] [PubMed] [Google Scholar]
- Hall TA. Bioedit: a user-friendly biological sequence alignment editor and analysis program for Windows 95/98/NT. Nucleic Acids Symp. Ser. 1999;41:95–98. [Google Scholar]
- Hansen DL, Lambertini C, Jampeetong A, Brix H. Clone-specific differences in Phragmites australis: effects of ploidy level and geographic origin. Aquat. Bot. 2007;86:269–279. [Google Scholar]
- Haslam SM. Phragmites Communis Trin. J. Ecol. 1972;60:585–610. [Google Scholar]
- Hauber DP, Saltonstall K, White DA, Hood CS. Genetic variation in the common reed, Phragmites australis, in the Mississippi River delta marshes: evidence for multiple introductions. Estuaries Coasts. 2011;34:851–862. [Google Scholar]
- Solomon S, Qin D, Manning M, Chen Z, Marquis M, Averyt KB, Tignor M, Miller HL, editors. IPCC. Climate change 2007: the physical science basis. Cambridge, U.K: Contribution of working group I to the fourth assessment report of the Intergovernmental Panel on Climate Change. Cambridge University Press; 2007. [Google Scholar]
- Kumari S, Sabharwal VP, Kushwaha HR, Sopory SK, Singla-Pareek SL, Pareek A. Transcriptome map for seedling stage specific salinity stress response indicates a specific set of genes as candidate for saline tolerance in Oryza sativa L. Funct. Integr. Genomics. 2009;9:109–123. doi: 10.1007/s10142-008-0088-5. [DOI] [PubMed] [Google Scholar]
- Lambertini C, Sorrell BK, Riis T, Olesen B, Brix H. Exploring the borders of European Phragmites within a cosmopolitan genus. AoB Plants. 2012a;2012:pls020. doi: 10.1093/aobpla/pls020. doi: 10.1093/aobpla/pls020. [DOI] [PMC free article] [PubMed] [Google Scholar]
- Lambertini C, Mendelssohn IA, Gustafsson MHG, Olesen B, Riis T, Sorrell BK, et al. Tracing the origin of gulf coast Phragmites (Poaceae): a story of long-distance dispersal and hybridization. Am. J. Bot. 2012b;99:538–551. doi: 10.3732/ajb.1100396. [DOI] [PubMed] [Google Scholar]
- Leakey AD, Ainsworth EA, Bernacchi CJ, Zhu X, Long SP. Photosynthesis in a CO2-rich atmosphere. In: Eatonrye JJ, Tripathy BC, Sharkey TD, Ort DR, editors. Photosynthesis: plastid biology, energy conversion and carbon assimilation. Dordrecht, the Netherlands: Springer; 2012. pp. 733–768. Advances in Photosynthesis and Respiration 34. [Google Scholar]
- Lessmann JM, Brix H, Bauer V, Clevering OA, Comin FA. Effect of climatic gradients on the photosynthetic responses of four Phragmites australis populations. Aquat. Bot. 2001;69:109–126. [Google Scholar]
- Li PH, Ainsworth EA, Leakey ADB, Ulanov A, Lozovaya V, Ort DR, et al. Arabidopsis transcript and metabolite profiles: ecotype-specific responses to open-air elevated [CO2] Plant, Cell Environ. 2008;31:1673–1687. doi: 10.1111/j.1365-3040.2008.01874.x. [DOI] [PubMed] [Google Scholar]
- Li P, Ponnala L, Gandotra N, Wang L, Si Y, Tausta SL, et al. The developmental dynamics of the maize leaf transcriptome. Nat. Genet. 2010;42:1060–1069. doi: 10.1038/ng.703. [DOI] [PubMed] [Google Scholar]
- Lissner J, Schierup HH. Effects of salinity on the growth of Phragmites australis. Aquat. Bot. 1997;55:247–260. [Google Scholar]
- Lissner J, Schierup HH, Comin FA, Astorga V. Effect of climate on the salt tolerance of two Phragmites australis populations. II. Diurnal CO2 exchange and transpiration. Aquat. Bot. 1999;64:335–350. [Google Scholar]
- Longstaff M, Raines CA, Mcmorrow EM, Bradbeer JW, Dyer TA. Wheat phosphoglycerate kinase – Evidence for recombination between the genes for the chloroplastic and cytosolic enzymes. Nucleic Acids Res. 1989;17:6569–6580. doi: 10.1093/nar/17.16.6569. [DOI] [PMC free article] [PubMed] [Google Scholar]
- Maier T, Güell M, Serrano L. Correlation of mRNA and protein in complex biological samples. FEBS Lett. 2009;583:3966–3973. doi: 10.1016/j.febslet.2009.10.036. [DOI] [PubMed] [Google Scholar]
- Matoh T, Matsushita N, Takahashi E. Salt tolerance of the reed plant Phragmites-Communis. Physiol. Plant. 1988;72:8–14. [Google Scholar]
- Matsushita N, Matoh T. Characterization of Na+ exclusion mechanisms of salt-tolerant reed plants in comparison with salt-sensitive rice plants. Physiol. Plant. 1991;83:170–176. [Google Scholar]
- Meehl GA, Washington WA, Arblaster JM, Hu A, Teng H, Tebaldi C, et al. Climate system response to external forcings and climate change projections in CCSM4. J. Clim. 2012;25:3661–3683. [Google Scholar]
- Meyerson LA, Lambert AM, Saltonstall K. A tale of three lineages: expansion of Common reed (Phragmites australis) in the U.S. Southwest and Gulf Coast. Invasive Plant Sci. Manag. 2010;3:515–520. [Google Scholar]
- Moore GE, Burdick DM, Peter CR, Keirstead DR. Belowground biomass of Phragmites australis in coastal marshes. Northeast. Nat. 2012;19:611–626. [Google Scholar]
- Mozdzer TJ, Megonigal JP. Jack-and-Master trait responses to elevated CO2 and N: a comparison of native and introduced Phragmites australis. PLoS ONE. 2012;7:e42794. doi: 10.1371/journal.pone.0042794. doi: 10.1371/journal.pone.0042794. [DOI] [PMC free article] [PubMed] [Google Scholar]
- Mozdzer TJ, Zieman JC. Ecophysiological differences between genetic lineages facilitate the invasion of non-native Phragmites australis in North American Atlantic coast wetlands. J. Ecol. 2010;98:451–458. [Google Scholar]
- Mozdzer TJ, Brisson J, Hazelton ELG. Physiological ecology and functional traits of North American native and Eurasian introduced Phragmites australis lineages. AoB Plants. 2013;5:plt048. doi: 10.1093/aobpla/plt048. [Google Scholar]
- Nguyen XL, Lambertini C, Sorrell BK, Eller F, Achenbach L, Brix H. Photosynthesis and leaf functional traits of co-existing Phragmites haplotypes at the Gulf Coast of North America: are the characteristics determined by adaptations derived from their native origin? AoB Plants. 2013;5:plt016. doi: 10.1093/aobpla/plt016. [Google Scholar]
- Orson RA. A paleoecological assessment of Phragmites australis in New England tidal marshes: changes in plant community structure during the last few millennia. Biol. Invasions. 1999;1:149–158. [Google Scholar]
- Osuna D, Usadel B, Morcuende R. Temporal responses of transcripts, enzyme activities and metabolite after adding sucrose to carbon-deprived Arabidopsis seedlings. Plant J. 2007;49:463–491. doi: 10.1111/j.1365-313X.2006.02979.x. [DOI] [PubMed] [Google Scholar]
- Parida AK, Das AB. Salt tolerance and salinity effects on plants: a review. Ecotoxicol. Environ. Saf. 2005;60:324–349. doi: 10.1016/j.ecoenv.2004.06.010. [DOI] [PubMed] [Google Scholar]
- Paul MJ, Driscoll SP. Sugar repression of photosynthesis: the role of carbohydrates in signalling nitrogen deficiency through source: sink imbalance. Plant, Cell Environ. 1997;20:110–116. [Google Scholar]
- Perez-Lopez U, Robredo A, Lacuesta M, Mena-Petite A, Munoz-Rueda A. The impact of salt stress on the water status of barley plants is partially mitigated by elevated CO2. Environ. Exp. Bot. 2009a;66:463–470. [Google Scholar]
- Perez-Lopez U, Robredo A, Lacuesta M, Sgherri C, Munoz-Rueda A, Navari-Izzo F, et al. The oxidative stress caused by salinity in two barley cultivars is mitigated by elevated CO2. Physiol. Plant. 2009b;135:29–42. doi: 10.1111/j.1399-3054.2008.01174.x. [DOI] [PubMed] [Google Scholar]
- Poorter H, Perez-Soba M. The growth response of plants to elevated CO2 under non-optimal environmental conditions. Oecologia. 2001;129:1–20. doi: 10.1007/s004420100736. [DOI] [PubMed] [Google Scholar]
- Raines CA, Longstaff M, Lloyd JC, Dyer TA. Complete coding sequence of wheat phosphoribulokinase – Developmental and light-dependent expression of the messenger-Rna. Mol. Gen. Genet. 1989;220:43–48. [PubMed] [Google Scholar]
- Saltonstall K. Cryptic invasion by a non-native genotype of the common reed, Phragmites australis, into North America. Proc. Natl Acad. Sci. USA. 2002;99:2445–2449. doi: 10.1073/pnas.032477999. [DOI] [PMC free article] [PubMed] [Google Scholar]
- Smith SM, Bedbrook J, Speirs J. Characterization of 3 cDNA clones encoding different messenger-RNAs for the precursor to the small subunit of wheat ribulosebisphosphate carboxylase. Nucleic Acids Res. 1983;11:8719–8734. doi: 10.1093/nar/11.24.8719. [DOI] [PMC free article] [PubMed] [Google Scholar]
- de Sousa Abreu R, Penalva LO, Marcotte EM, Vogel C. Global signatures of protein and mRNA expression levels. Mol. Bio. Syst. 2009;5:1512–1526. doi: 10.1039/b908315d. [DOI] [PMC free article] [PubMed] [Google Scholar]
- Sreenivasulu N, Miranda M, Prakash HS, Wobus U, Weschke W. Transcriptome changes in foxtail millet genotypes at high salinity: identification and characterization of a PHGPX gene specifically up-regulated by NaCl in a salt-tolerant line. J. Plant Physiol. 2004;161:467–477. doi: 10.1078/0176-1617-01112. [DOI] [PubMed] [Google Scholar]
- Takahashi R, Nishio T, Ichizen N, Takano T. High-affinity K+ transporter PhaHAK5 is expressed only in salt-sensitive reed plants and shows Na+ permeability under NaCl stress. Plant Cell Rep. 2007;26:1673–1679. doi: 10.1007/s00299-007-0364-1. [DOI] [PubMed] [Google Scholar]
- Takahashi R, Liu S, Takano T. Isolation and characterization of plasma membrane Na+/H+ antiporter genes from salt-sensitive and salt-tolerant reed plants. J. Plant Physiol. 2009;166:301–309. doi: 10.1016/j.jplph.2008.04.002. [DOI] [PubMed] [Google Scholar]
- Taylor G, Street NR, Tricker PJ, Sjödin A, Graham L, Skogström O, et al. The transcriptome of Populus in elevated CO2. New Phytol. 2005;167:143–154. doi: 10.1111/j.1469-8137.2005.01450.x. [DOI] [PubMed] [Google Scholar]
- Turkan I, Demiral T. Recent developments in understanding salinity tolerance. Environ. Exp. Bot. 2009;67:2–9. [Google Scholar]
- Udvardi MK, Czechowski T, Scheible WR. Eleven golden rules of quantitative RT-PCR. Plant Cell. 2008;20:1736–1737. doi: 10.1105/tpc.108.061143. [DOI] [PMC free article] [PubMed] [Google Scholar]
- Vandesompele J, De Preter K, Pattyn F, Poppe B, Van Roy N, De Paepe A, et al. Accurate normalization of real-time quantitative RT-PCR data by geometric averaging of multiple internal control genes. Genome Biol. 2002;3 doi: 10.1186/gb-2002-3-7-research0034. :research0034-research0034.11: doi: 10.1186/gb-2002-3-7-research0034. [DOI] [PMC free article] [PubMed] [Google Scholar]
- Vasquez EA, Glenn EP, Brown JJ, Guntenspergen GR, Nelson SG. Salt tolerance underlies the cryptic invasion of North American salt marshes by an introduced haplotype of the common reed Phragmites australis (Poaceae) Mari. Ecol. Prog. Ser. 2005;298:1–8. [Google Scholar]
- Vogel C, Marcotte EM. Insights into the regulation of protein abundance from proteomic and transcriptomic analyses. Nat. Genet. 2012;13:227–232. doi: 10.1038/nrg3185. [DOI] [PMC free article] [PubMed] [Google Scholar]
- White JA, Scandalios JG. Isolation and characterization of a cDNA for mitochondrial Manganese Superoxide-Dismutase (Sod-3) of maize and its relation to other Manganese Superoxide Dismutases. Biochim. Biophys. Acta. 1988;951:61–70. doi: 10.1016/0167-4781(88)90025-5. [DOI] [PubMed] [Google Scholar]
- White DA, Hauber DP, Hood CS. Clonal differences in Phragmites australis from the Mississippi River Delta. Southeast. Nat. 2004;3:531–544. [Google Scholar]
- Wu TH, Liao MH, Kuo WY, Huang CH, Hsieh HL, Jinn TL. Characterization of copper/zinc and manganese superoxide dismutase in green bamboo (Bambusa oldhamii): cloning, expression and regulation. Plant Physiol. Biochem. 2011;49:195–200. doi: 10.1016/j.plaphy.2010.11.011. [DOI] [PubMed] [Google Scholar]
Associated Data
This section collects any data citations, data availability statements, or supplementary materials included in this article.
Supplementary Materials
Table S1. F-ratios of General Linear Model (GLM) analysis of aboveground biomass and transcript abundance of genes expressed in two invasive genotypes of Phragmites australis from the Mississippi River Delta.
Table S2. Results for gene expression and aboveground biomass of each of the two invasive genotypes of P. australis.