

Abstract
Purpose
To compare performance of various tumor response criteria (TRC) in assessment of regorafenib activity in patients with advanced GIST with prior failure of imatinib and sunitinib.
Methods
Twenty participants in a phase II trial received oral regorafenib (median duration 47 weeks; IQR 24-88) with CT imaging at baseline and every two months thereafter. Tumor response was prospectively determined on using RECIST1.1, and retrospectively reassessed for comparison per RECIST1.0, WHO and Choi criteria, using the same target lesions. Clinical benefit rate [CBR; complete or partial response (CR or PR) or stable disease (SD) ≥16 weeks] and progression-free survival (PFS) were compared between various TRCs using kappa statistics. Performance of TRCs in predicting overall survival (OS) was compared by comparing OS in groups with progression-free intervals less than or greater than 20 weeks by each TRC using c-statistics.
Results
PR was more frequent by Choi (90%) than RECIST1.1, RECIST1.0 and WHO (20% each), however, CBR was similar between various TRCs (overall CBR 85-90%, 95-100% agreement between all TRC pairs). PFS per RECIST1.0 was similar to RECIST1.1 (median 44 weeks vs 58 weeks), and shorter for WHO (median 34 weeks) and Choi (median 24 weeks). With RECIST1.1, RECIST1.0 and WHO, there was moderate concordance between PFS and OS (c-statistics 0.596 to 0.679). Choi criteria had less favorable concordance (c-statistic 0.506).
Conclusions
RECIST1.1 and WHO performed somewhat better than Choi criteria as TRC for response evaluation in patients with advanced GIST after prior failure on imatinib and sunitinib.
Keywords: Gastrointestinal stromal tumor, regorafenib, tumor response criteria, RECIST, Choi
Introduction
Discovery of activating mutations of the KIT and PDGFR-α genes with subsequent therapeutic development of receptor tyrosine kinase inhibitors (TKIs) has revolutionized the treatment of patients with gastrointestinal stromal tumor (GIST) (1–3). In the past decade, survival of patients with GIST has improved with use of tyrosine kinase inhibitors such as imatinib (Gleevec®, Novartis, East Hanover, NJ) in first-line setting and sunitinib (Sutent®; Pfizer, New York, NY) in second-line setting (4–7). Regorafenib (Stivarga®; Bayer, Berlin, Germany), an inhibitor of multiple cancer-associated kinases including KIT and platelet-derived growth factor receptor (PDGFR), has recently been FDA approved in the US as a third-line agent for TKI-resistant GIST based on data from phase II and III trials (8,9).
Every clinical trial for a new anticancer agent incorporates some means of assessing response to the drug, using objective and standardized tumor response criteria (TRC). Several TRCs have been proposed, including the World Health Organization (WHO) criteria (10), Response Evaluation Criteria in Solid Tumors (RECIST) 1.0 (11), and its revised version RECIST 1.1 (12). In addition to these TRCs, which rely on changes in tumor size for assessment of response, certain TRC such as Choi criteria (13) have been proposed to take into consideration both changes in tumor size and lesion density on CT imaging. There is no uniformity in the use of TRCs across clinical trials, and the recommendations for use of TRCs vary (6–9,14,15). Several TKIs have provided data to support the postulate that durable stable disease (SD) represents true clinical benefit for patients, and this has caused a paradigm shift in tumor response assessment. With historic cytotoxic chemotherapy development, only objective response (either complete or partial response) was viewed as a surrogate for clinical benefit and likely tied to an impact on overall survival. Given the burgeoning interest in addressing mutations which confer resistance to first-line TKI therapy, there are many new second- and later-line agents in trials, with more complex patterns of imaging the activity of new drugs in diseases harboring polyclonal driver mutations. The medical need to image most reliably and accurately the activity of newer targeted agents after development of resistance to previous therapy has become more relevant, and it has become important to choose the TRC best suited to assess therapeutic activity in this setting.
Given the lack of uniformity in the choice of TRC in clinical trials, and since the TRC best suited to assess response of GIST after initial failure of first- and second-line agents remains unknown, this study was designed to assess the performance of various TRCs in assessment of regorafenib activity in the context of a prospective clinical trial of patients receiving this oral agent for advanced GIST after prior failure of imatinib and sunitinib. We compared the performance of RECIST 1.1, RECIST 1.0, WHO and Choi criteria in terms of clinical benefit rate [CBR, defined per protocol as complete response (CR), partial response (PR) or stable disease (SD) ≥16 weeks], progression-free survival (PFS), and the ability to predict overall survival based on PFS.
Patients and Methods
Patients and Drug Administration Protocol
The patients for this study represented the prospectively accrued, single-institution population participating in an academic investigator-initiated multicenter phase II trial of regorafenib for metastatic and/or unresectable GIST after failure of imatinib and sunitinib (8). The protocol was approved by the institutional review board, and the study was conducted in accordance with the ethical principles originating from the Declaration of Helsinki and Good Clinical Practice. All patients provided written informed consent before enrollment into the study. Of 34 patients enrolled in the phase II trial, 20 patients at the Dana-Farber/Harvard Cancer Center (19 at Dana-Farber Cancer Institute and one at Massachusetts General Hospital) were included in the present study based upon the fact that they underwent serial contrast-enhanced CT for follow-up. The study group was comprised of 14 men and 6 women with mean age 55 years, (range 26-69 years).
Patients received once daily dose of 160 mg regorafenib on days 1 through 21 of repetitive 28-day cycles (21 days on, 7 days off). Patients continued on regorafenib unless they exhibited progressive disease per RECIST 1.1 (athough there was an option for study drug therapy to continue in patients with ongoing clinical benefit per treating physician with approval of principal investigator), or developed unacceptable toxicity or chose to withdraw from the study. The median treatment duration was duration 47 weeks (interquartile range, IQR, 24-88).
Response Assessment
Patients had contrast-enhanced CT at baseline and after every two cycles; on average, eight imaging time-points were available (range, 2-17). Tumor response was determined prospectively using RECIST 1.1 (total 59 target lesions) (12). The comparative assessments by RECIST 1.0 (total 110 target lesions) (11), WHO (total 110 target lesions) (10) and Choi (total 59 target lesions) (13) criteria were made retrospectively by the same reader to preserve uniformity. The same target lesions used for the prospective RECIST 1.1 assessment were utilized for the assessment by other TRCs, with additional lesions and/or bi-dimensional measurements added for RECIST 1.0 and WHO criteria as required by the individual TRC. For Choi criteria, density changes were measured on the same 59 target lesions which were prospectively used for RECIST 1.1 assessment. Once target lesions were chosen and measured, the same dimensions were used for all TRCs to avoid measurement bias. The radiologist performing the measurements was blinded to all clinical information except the diagnosis of GIST.
Statistical Analysis
In the protocol, CBR was defined as the proportion of patients demonstrating CR, PR or SD ≥16 weeks. The trial was conducted using a one-stage design, and was planned to distinguish a 30% CBR from 10% null rate with 90% power and 10% type I error. PFS was defined as the duration of time from date of initiation of the drug to the date of disease progression or death, whichever occurred first. Patients alive without progression were censored at the date of last disease evaluation. The kappa statistic (16) was used to examine pairwise agreement between TRCs. Because we did six different pairwise comparisons, a p-value of 0.05/6, or 0.008 was considered statistically significant
Overall survival was defined as the time from initiation of study drug, regorafenib, to death from any cause. Performance of TRCs in predicting the overall survival was assessed using a c-statistic. First, we used each TRC to divide the cohort into two groups, those who progressed by 20 weeks and those who did not. Twenty weeks was chosen because it provided a balanced division of patients into the two groups. To calculate the c-statistic, pairs of patients are iteratively drawn at random, and the proportion of informative pairs in which the patient who is progression-free has the longer survival time is calculated, along with a 95% confidence interval. Analyses were conducted using SAS (version 9.2, SAS Institute, Cary, NC), Stata (version 12), and R (version 2.14).
Results
Assessment of Best Tumor Response by Different TRCs
None of the patients showed CR by any TRC (Table 1). Best observed response was seen in the form of PR in four patients (20% response rate) each by RECIST 1.1, RECIST 1.0 and WHO criteria, but in 18 patients (90% response rate) by Choi criteria. Use of Choi criteria more frequently led to PR than RECIST 1.1. Using RECIST 1.1, RECIST 1.0, WHO and Choi criteria, SD was seen in 15, 15, 14 and 1 patient, respectively; PD was seen in 1, 1,2, and 1 patient, respectively. Time to best response was also shorter for Choi criteria compared to RECIST 1.1 (Table 1). However, there was no difference in the CBR among various TRCs (overall CBR rates of 85 to 90%, 95 to 100% agreement between all pairs of TRCs, Table 1). Kappa statistics are shown in Table 2. There was high agreement between all pairs of TRCs in terms of clinical benefit (all p<0.008).
Table 1. Comparison of response assessment using RECIST 1.1, RECIST 1.0, WHO and Choi criteria.
| Tumor Response Criteria | RECIST1.1 | RECIST1.0 | WHO | Choi |
|---|---|---|---|---|
|
| ||||
| Number | Number | Number | Number | |
|
| ||||
| Best Response | ||||
| CR | 0 | 0 | 0 | 0 |
| PR | 4 | 4 | 4 | 18 |
| SD | 15 | 15 | 14 | 1 |
| PD | 1 | 1 | 2 | 1 |
|
| ||||
| Time to best response, weeks Median (IQR) | 16 (8-33) | 12 (8-24) | 15 (8-24) | 9 (8-16) |
|
| ||||
| Clinical Benefit | 18 (90%) | 18(90%) | 17 (85%) | 17(85%) |
|
| ||||
| Clinical Benefit Rate 95% CI | 70-97% | 70-97% | 64-95% | 64-95% |
|
| ||||
| PFS, weeks Median (IQR) | 66 (41-93) | 44 (33-88) | 34 (17-58) | 24 (17-33) |
Table 2. Concordance of Clinical Benefit Rates.
| Agreement | Expected | Kappa | Std Error | Z | P | |
|---|---|---|---|---|---|---|
| RECIST 1.1 vs. 1.0 | 100% | 90.5% | 1.0 | 0.224 | 4.47 | <0.0001 |
| RECIST 1.1 vs. WHO | 95% | 86.0% | 0.643 | 0.209 | 3.08 | 0.001 |
| RECIST 1.1 vs. Choi | 100% | 90.5% | 1.0 | 0.224 | 4.47 | <0.0001 |
| RECIST 1.0 vs. WHO | 95% | 86.0% | 0.643 | 0.209 | 3.08 | 0.001 |
| RECIST 1.0 vs. Choi | 100% | 90.5% | 1.0 | 0.224 | 4.47 | <O.0001 |
| WHO vs. Choi | 95% | 86.0% | 0.643 | 0.209 | 3.08 | 0.001 |
Progression-Free Survival
Table 3 shows PFS based on each system along with a breakdown of the survival and progression status categories. PFS was longest for RECIST 1.1 (median 58 weeks). PFS of RECIST 1.0 was similar to that of RECIST 1.1 (median 44 weeks. PFS by WHO criteria was shorter than RECIST 1.1 (median 34 weeks; Figure lb). PFS was shortest by Choi criteria (median 24 weeks; Figure lc).
Table 3. Progression-Free Survival by TRC.
| Alive w/o PD | Alive with PD | Died w/oPD | PDand Died | Median PFS (wks) | 95% CI | |
|---|---|---|---|---|---|---|
| RECIST 1.1 | 3 | 6 | 7 | 4 | 58.1 | 37.6–85.3 |
| RECIST 1.0 | 3 | 6 | 8 | 3 | 44.1 | 32.9–66.1 |
| WHO | 1 | 8 | 8 | 3 | 33.6 | 16.1–44.1 |
| Choi | 0 | 9 | 9 | 2 | 24.0 | 16.9–33.3 |
Figure 1. PFS by All Criteria and OS.
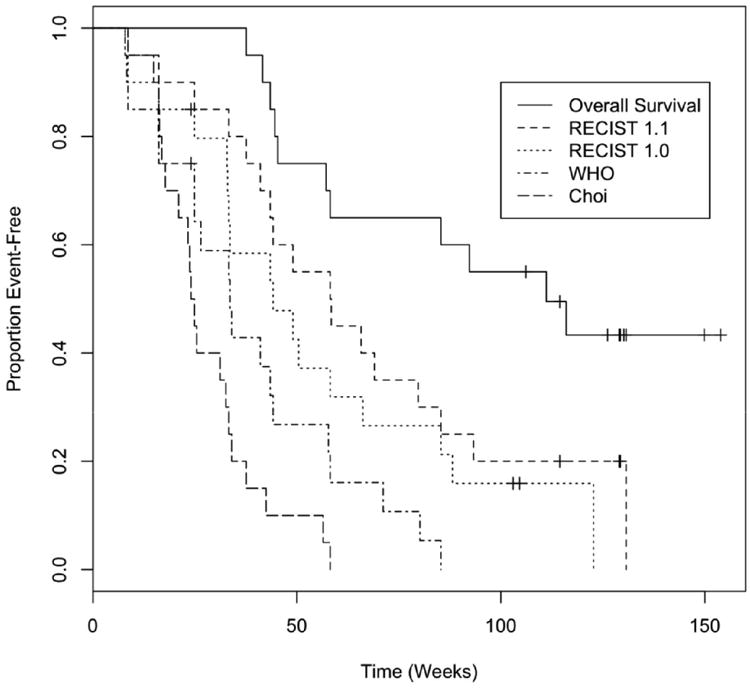
Overall Survival
The median OS was 111 weeks (95% LCL 45 weeks, 95% UCL not reached). Table 4 shows concordance between overall survival and progression within 20 weeks by each of the TRCs. The three standard solid tumor systems had better concordance with overall survival than the Choi criteria. RECIST 1.0 was numerically superior, but the confidence interval for this c-statistic also encompassed the estimate for RECIST 1.1 and WHO.
Table 4. Concordance Between Overall Survival and Progression Status at 20 Weeks.
| TRC | C-Statistic | 95% CI | Cox p |
|---|---|---|---|
| RECIST 1.0 | 0.679 | 0.533 – 0.824 | 0.0017 |
| RECIST 1.1 | 0.596 | 0.465 – 0.727 | 0.014 |
| WHO | 0.659 | 0.489 – 0.829 | 0.02 |
| Choi | 0.506 | 0.340 – 0.672 | 0.84 |
Discussion
We found that the currently used system, RECIST 1.1, was well suited for response evaluation in patients with GIST after failure of prior TKI therapy. WHO and the earlier version of RECIST were also effective. Choi criteria were far more sensitive in calling PR, and the time to best response was also shortest for Choi criteria. Essentially, this confirms prior data that the Choi criteria serve to reclassify stable disease as “responders.” However, CBR was similar with RECIST 1.1, RECIST 1.0, WHO and Choi criteria (85-90%). PFS was longest with RECIST 1.1 and RECIST 1.0 criteria and was significantly shorter by Choi criteria. Moreover, RECIST 1.1, RECIST 1.0 and WHO criteria were able to predict OS; patients with longer PFS had better OS. PFS by Choi criteria was less concordant with OS.
These results have significant implications for the choice of tumor response criteria for clinical trials. It is posited that Choi criteria, by virtue of including so-called “morphologic” assessment of tumor density, is more sensitive for detection of response to imatinib in patients with GIST (13,14). In these studies, patients showing response by Choi criteria had longer PFS than those who did not show response; on the other hand, no difference between PFS was found between responders and non-responders by RECIST 1.0 criteria (13,14). However, it is now known that when patients with GIST are treated with effective TKI therapy, tumor lesions often may not shrink, and therefore, per RECIST, are judged as SD. As a result, it has now become a standard practice to consider SD as clinical benefit in these patients (8,17). Therefore, there is a need to compare various TRC in this light, after including SD in the ‘responder group’. Also, the exact imaging response to second- and third-line agents in patients with GIST is not known; Although GIST on first line therapy with TKI show dramatic density changes, it is unknown whether TKI-resistant GIST, after failure of prior TKI therapy, shows similar density changes to subsequent challenge with agents that target the pathogenic driver kinases. Therefore it is important to study and define the imaging response patterns with second- and later-line TKI agents in GIST and other malignancies for which targeted therapy is used.
In this study we found that, when SD is included in the responding group, the performance of various TRCs was equivalent in terms of detection of clinical benefit. Choi criteria showed shortest PFS, which was likely related to its increased sensitivity to define both “progression” and “response.” This would mean that if a tumor assessment only relied on Choi criteria, patient would “progress” sooner and, in the context of clinical trials, might be taken off the study drug sooner as therapeutic failure. However, PFS by Choi criteria in our case was not strongly concordant with OS. On the other hand, the assessments per RECIST 1.1, RECIST 1.0, and WHO not only demonstrated longer PFS, but most importantly, demonstrated good concordance with OS. Therefore, it appears that RECIST is at present well suited as the primary criteria for response evaluation in clinical trials of GIST. Choi criteria, given its high sensitivity, may be used as an adjunct or as a system to detect early proof of biological activity, but these criteria do not appear to be ideally suited as a primary TRC for definitive trials of clinical benefit.
This study had several limitations. Assessment of RECIST 1.0, WHO and Choi criteria was made retrospectively. To address this limitation, assessment was made by the same readers who read the original prospective evaluation using RECIST 1.1 criteria, and same target lesions were used for retrospective assessment to preserve uniformity. It is possible that the results might have differed slightly if different lesions were used, however, we expect this change to affect all the TRCs. Another limitation was the small number of patients. Therefore, our results should be validated using a larger study cohort. Finally, we could not study the predictive value of TRCs at a range of progression times because of the small number of patients and progression events.
In summary, RECIST 1.1, RECIST 1.0, WHO and Choi criteria showed similar clinical benefit rates. Although Choi criteria are highly sensitive in calling PR and detection of response is called sooner with Choi criteria, the Choi TRC showed less concordance with overall survival. Therefore, RECIST 1.1 appears well suited to assessing the activity and clinical benefit of new TKIs in patients with advanced GIST after prior failure of imatinib and sunitinib.
Acknowledgments
Funding: None
Footnotes
Writing Assistance: None
Conflicts of Interest: Atul B. Shinagare: None
Jyothi P. Jagannathan: None
Vikram Kurra: None
Trinity Urban: None
Judith Manola: None
Edwin Choy: Amgen (Consulting with payment)
| Bayer | 1. Consultant, consulting fees 2. Research support to Dana-Farber for specific clinical trial agreements in our sarcoma unit 3. Expert regulatory testimony, unpaid |
| Novartis | 1. Consultant, consulting fees 2. Research support to Dana-Farber for specific clinical trial agreements in our sarcoma unit |
| Pfizer | 1. Consultant, consulting fees 2. Research support to Dana-Farber for specific clinical trial agreements in our sarcoma unit |
| Sanofi-Aventis | 1. Consultant, consulting fees 2. Research support to Dana-Farber for specific clinical trial agreements in our sarcoma unit |
| Glaxo-Smith-Kline | 1. Consultant, consulting fees 2. Research support to Dana-Farber for specific clinical trial agreements in our sarcoma unit 3. Expert regulatory testimony, unpaid |
| Foundation Medicine | 1. Consultant, consulting fees 2. CONTENT AREA: GIST and Sarcomas |
| Ariad | 1. Consultant, consulting fees |
| Kolltan Pharmaceuticals | Consultant, Scientific Advisory Board consulting fees Equity (minor stake, non-public) |
| Blueprint Medicines | Consultant, Scientific Advisory Board consulting fees Equity (minor stake, non-public) |
Suzanne George:
Bayer: research funding; consulting
Pfizer: consulting
Ariad: research funding; consulting
Novartis: research funding
Nikhil H. Ramaiya: None
References
- 1.Hirota S, Isozaki K, Moriyama Y, Hashimoto K, Nishida T, Ishiguro S, et al. Gain-of-flinction mutations of c-kit in human gastrointestinal stromal tumors. Science. 1998 Jan 23;279(5350):577–80. doi: 10.1126/science.279.5350.577. [DOI] [PubMed] [Google Scholar]
- 2.Joensuu H, Roberts PJ, Sarlomo-Rikala M, Andersson LC, Tervahartiala P, Tuveson D, et al. Effect of the tyrosine kinase inhibitor STI571 in a patient with a metastatic gastrointestinal stromal tumor. N Engl J Med. 2001 Apr 5;344(14):1052–6. doi: 10.1056/NEJM200104053441404. [DOI] [PubMed] [Google Scholar]
- 3.Druker BJ. Molecularly targeted therapy: have the floodgates opened? Oncologist. 2004;9(4):357–60. doi: 10.1634/theoncologist.9-4-357. [DOI] [PubMed] [Google Scholar]
- 4.Koshenkov VP, Rodgers SE. Adjuvant therapy of gastrointestinal stromal tumors. Curr Opin Oncol. 2012 Jul;24(4):414–8. doi: 10.1097/CCO.0b013e328353d774. [DOI] [PubMed] [Google Scholar]
- 5.Pedroso FE, Raut CP, Xiao H, Yeo CJ, Koniaris LG. Has the survival rate for surgically resected gastric gastrointestinal stromal tumors improved in the tyrosine kinase inhibitor era? Ann Surg Oncol. 2012 Jun;19(6):1748–58. doi: 10.1245/s10434-012-2222-9. [DOI] [PubMed] [Google Scholar]
- 6.Demetri GD, von Mehren M, Blanke CD, Van den Abbeele AD, Eisenberg B, Roberts PJ, et al. Efficacy and safety of imatinib mesylate in advanced gastrointestinal stromal tumors. N Engl J Med. 2002 Aug 15;347(7):472–80. doi: 10.1056/NEJMoa020461. [DOI] [PubMed] [Google Scholar]
- 7.Demetri GD, van Oosterom AT, Garrett CR, Blackstein ME, Shah MH, Verweij J, et al. Efficacy and safety of sunitinib in patients with advanced gastrointestinal stromal tumour after failure of imatinib: a randomised controlled trial. Lancet. 2006 Oct 14;368(9544):1329–38. doi: 10.1016/S0140-6736(06)69446-4. [DOI] [PubMed] [Google Scholar]
- 8.George S, Wang Q, Heinrich MC, Corless CL, Zhu M, Butrynski JE, et al. Efficacy and safety of regorafenib in patients with metastatic and/or unresectable GI stromal tumor after failure of imatinib and sunitinib: a multicenter phase II trial. J Clin Oncol. 2012 Jul l;30(19):2401–7. doi: 10.1200/JCO.2011.39.9394. [DOI] [PMC free article] [PubMed] [Google Scholar]
- 9.Demetri GD, Reichardt P, Kang YK, Blay JY, Rutkowski P, Gelderblom H, et al. Efficacy and safety of regorafenib for advanced gastrointestinal stromal tumours after failure of imatinib and sunitinib (GRID): an international, multicentre, randomised, placebo-controlled, phase 3 trial. Lancet. 2013 Jan 26;381(9863):295–302. doi: 10.1016/S0140-6736(12)61857-1. [DOI] [PMC free article] [PubMed] [Google Scholar]
- 10.Miller AB, Hoogstraten B, Staquet M, Winkler A. Reporting results of cancer treatment. Cancer. 1981 Jan 1;47(1):207–14. doi: 10.1002/1097-0142(19810101)47:1<207::aid-cncr2820470134>3.0.co;2-6. [DOI] [PubMed] [Google Scholar]
- 11.Therasse P, Arbuck SG, Eisenhauer EA, Wanders J, Kaplan RS, Rubinstein L, et al. New guidelines to evaluate the response to treatment in solid tumors. European Organization for Research and Treatment of Cancer, National Cancer Institute of the United States, National Cancer Institute of Canada. J Natl Cancer Inst. 2000 Feb 2;92(3):205–16. doi: 10.1093/jnci/92.3.205. [DOI] [PubMed] [Google Scholar]
- 12.Eisenhauer EA, Therasse P, Bogaerts J, Schwartz LH, Sargent D, Ford R, et al. New response evaluation criteria in solid tumours: revised RECIST guideline (version 1.1) Eur J Cancer. 2009 Jan;45(2):228–17. doi: 10.1016/j.ejca.2008.10.026. [DOI] [PubMed] [Google Scholar]
- 13.Choi H, Charnsangavej C, Faria SC, Macapinlac HA, Burgess MA, Patel SR, et al. Correlation of computed tomography and positron emission tomography in patients with metastatic gastrointestinal stromal tumor treated at a single institution with imatinib mesylate: proposal of new computed tomography response criteria. J Clin Oncol. 2007 May l;25(13):1753–9. doi: 10.1200/JCO.2006.07.3049. [DOI] [PubMed] [Google Scholar]
- 14.Benjamin RS, Choi H, Macapinlac HA, Burgess MA, Patel SR, Chen LL, et al. We should desist using RECIST, at least in GIST. J Clin Oncol. 2007 May 1;25(13):1760–1. doi: 10.1200/JCO.2006.07.3411. [DOI] [PubMed] [Google Scholar]
- 15.Blanke CD, Demetri GD, von Mehren M, Heinrich MC, Eisenberg B, Fletcher JA, et al. Long-term results from a randomized phase II trial of standard- versus higher-dose imatinib mesylate for patients with unresectable or metastatic gastrointestinal stromal tumors expressing KIT. J Clin Oncol. 2008 Feb 1;26(4):620–5. doi: 10.1200/JCO.2007.13.4403. [DOI] [PubMed] [Google Scholar]
- 16.Airman DGBJ. Practical Statistics for Medical Research. London: Chapman and Hall; 1991. [Google Scholar]
- 17.Le Cesne A, Van Glabbeke M, Verweij J, Casali PG, Findlay M, Reichardt P, et al. Absence of progression as assessed by response evaluation criteria in solid tumors predicts survival in advanced GI stromal tumors treated with imatinib mesylate: the intergroup EORTC-ISG-AGITG phase III trial. J Clin Oncol. 2009 Aug 20;27(24):3969–74. doi: 10.1200/JCO.2008.21.3330. [DOI] [PMC free article] [PubMed] [Google Scholar]