

Abstract
The striatum is comprised of medium-sized spiny projection neurons (MSNs) and several types of interneuron, and receives massive glutamatergic input from the cerebral cortex. Understanding of striatal function requires definition of the electrophysiological properties of neurochemically identified interneurons sampled in the same context of ongoing cortical activity in vivo. To address this, we recorded the firing of cholinergic interneurons (expressing choline acetyltransferase; ChAT) and GABAergic interneurons expressing parvalbumin (PV) or nitric oxide synthase (NOS), as well as MSNs, in anesthetized rats during cortically defined brain states. Depending on the cortical state, these interneurons were partly distinguished from each other, and MSNs, on the basis of firing rate and/or pattern. During slow-wave activity (SWA), ChAT+ interneurons, and some PV+ and NOS+ interneurons, were tonically active; NOS+ interneurons fired prominent bursts but, contrary to investigations in vitro, these were not typical low-threshold spike bursts. Identified MSNs, and other PV+ and NOS+ interneurons, were phasically active. Contrasting with ChAT+ interneurons, whose firing showed poor brain state dependency, PV+ and NOS+ interneurons displayed robust firing increases and decreases, respectively, upon spontaneous or driven transitions from SWA to cortical activation. The firing of most neurons was phase locked to cortical slow oscillations, but only PV+ and ChAT+ interneurons also fired in time with cortical spindle and gamma oscillations. Complementing this diverse temporal coupling, each interneuron type exhibited distinct responses to cortical stimulation. Thus, these striatal interneuron types have distinct temporal signatures in vivo, including relationships to spontaneous and driven cortical activities, which likely underpin their specialized contributions to striatal microcircuit function.
Introduction
The striatum, the primary input site of the basal ganglia, is comprised of medium-sized spiny projection neurons (MSNs) and several types of aspiny interneuron. Despite their relatively small numbers, interneurons likely play critical roles in striatal information processing and thence, basal ganglia-mediated behaviors (Tepper and Bolam, 2004). Major types of striatal interneuron include cholinergic interneurons and GABAergic interneurons that express either parvalbumin (PV) or nitric oxide synthase (NOS) (Kubota et al., 1993). Because the cerebral cortex provides the principal excitatory inputs to striatum, defining how the firing of these interneurons is related to ongoing cortical activity is of central importance for understanding their functions.
Cholinergic interneurons can autonomously fire at slow rates, with regular, irregular, and/or busting patterns (Goldberg and Reynolds, 2011). In behaving primates, striatal units with similar firing properties, so-called “tonically active neurons” (TANs), are thought to be cholinergic interneurons (Kimura et al., 1984). Small samples of rodent cholinergic interneurons support this assumption (Wilson et al., 1990; Inokawa et al., 2010; Schulz et al., 2011a). Although the pause responses of TANs can signal the behavioral significance of external stimuli (Morris et al., 2004), the propensity of cholinergic interneurons to fire tonically or engage in other firing patterns in intervening periods is unclear. Moreover, limited in vivo recordings of identified striatal cells means that other (noncholinergic) interneurons might also fire tonically.
GABAergic PV-expressing (PV+) interneurons, often considered synonymous with “fast-spiking interneurons” (FSI), target the perisomatic regions of MSNs and powerfully curtail their firing (Kita et al., 1990; Kawaguchi, 1993; Koós and Tepper, 1999). They are positioned to rapidly integrate synchronized cortical inputs and provide feedforward inhibition of MSNs (Ramanathan et al., 2002; Mallet et al., 2005). Accordingly, firing of striatal FSI is preferentially coupled to ongoing cortical spindle and gamma oscillations in vivo (Berke, 2011; Sharott et al., 2009). The full gamut of activity relationships of identified PV+ interneurons with cortex remains unresolved.
The characteristic intrinsic properties of identified NOS+ interneurons include their ability to fire low-threshold spike (LTS) bursts (Kawaguchi, 1993). Many NOS+ interneurons also display autonomous firing (Ibáñez-Sandoval et al., 2011; Beatty et al., 2012). Because identified NOS+ interneurons have not been recorded in vivo, it is unclear whether they fire LTS bursts (Sharott et al., 2009), or are tonically active, in intact striatal networks. Nitric oxide modulates the responsiveness of MSNs to cortical input and can mediate synaptic plasticity (Sammut et al., 2010), but how the firing of NOS+ interneurons is related to that of other striatal neurons, to cortical activity or behavior, is unknown.
To advance understanding of striatal interneuron function, it is imperative to define the electrophysiological properties of neurochemically identified cells in the same context in vivo. We thus recorded the activities of identified cholinergic interneurons and GABAergic interneurons expressing PV or NOS, as well as MSNs for comparison, in anesthetized rats during cortically-defined brain states. We define and contrast their spontaneous firing rates and patterns, including temporal coupling to cortical oscillations, and characterize their distinct responses to somatosensory stimuli and driven cortical outputs.
Materials and Methods
Experimental procedures were performed on adult male Sprague Dawley rats (Charles River), and were conducted in accordance with the Animals (Scientific Procedures) Act, 1986 (United Kingdom), and with Society for Neuroscience Policies on the Use of Animals in Neuroscience Research.
In vivo electrophysiological recording and juxtacellular labeling of single neurons.
Recording and labeling experiments were performed in 78 anesthetized rats (280–340 g). Briefly, anesthesia was induced with 4% v/v isoflurane in O2, and maintained with urethane (1.3 g/kg, i.p.; ethyl carbamate; Sigma), and supplemental doses of ketamine (30 mg/kg, i.p.; Ketaset) and xylazine (3 mg/kg, i.p.; Rompun; Bayer), as described previously (Stern et al., 1997; Magill et al., 2006). Wound margins were infiltrated with local anesthetic (0.5% w/v bupivacaine; Astra). Animals were then placed in a stereotaxic frame (Kopf). Body temperature was maintained at 37 ± 0.5°C by a homeothermic heating device (Harvard Apparatus). An electrocorticogram (ECoG), electrocardiographic activity, and respiration rate were monitored constantly to ensure the animals' well being. The epidural ECoG was recorded above the frontal (somatic sensory-motor) cortex (4.2 mm anterior and 2.0 mm lateral of bregma) (Paxinos and Watson, 1986), and was referenced against the ipsilateral cerebellar hemisphere (Mallet et al., 2008). Raw ECoG was bandpass filtered (0.3–1500 Hz, −3 dB limits) and amplified (2000×; DPA-2FS filter/amplifier; npi electronic) before acquisition. Extracellular recordings of the action potentials (“spikes”) of individual neurons (i.e., single-unit activities) in the dorsal striatum were made using glass electrodes (10–30 MΩ in situ; tip diameter ∼1.2 μm) containing 0.5 m NaCl solution and neurobiotin (1.5% w/v; Vector Laboratories). Electrodes were lowered into the brain under stereotaxic guidance and using a computer-controlled stepper motor (IVM-1000; Scientifica) that allowed the electrode depth to be determined with a resolution of 0.1 μm. Electrode signals were amplified (10×) through the bridge circuitry of an Axoprobe-1A amplifier (Molecular Devices), AC-coupled, amplified another 100×, and bandpass filtered at 300–5000 Hz (DPA-2FS filter/amplifier). The ECoG and single-unit activity were each sampled at 16.6 kHz using a Power1401 Analog-Digital converter and a PC running Spike2 acquisition and analysis software (Version 7.2; Cambridge Electronic Design). Striatal neurons were recorded during two distinct, spontaneous brain states, as defined by the ECoG: (1) slow-wave activity (SWA), which is similar to activity observed during natural nonrapid eye movement sleep and drowsiness; and (2) “cortical activation,” which contains patterns of activity that are more analogous to those observed during the alert, behaving state (Steriade, 2000). Cortical SWA is thus dominated by slow oscillations (∼1 Hz), which in this ECoG configuration are composed of alternating surface-positive “active components” and surface-negative “inactive components” (Mallet et al., 2008), but also contains spindle oscillations (7–12 Hz) and gamma oscillations (27–45 Hz). Transition from SWA to the activated brain state is exemplified by obliteration of cortical slow and spindle oscillations (Steriade, 2000). Notably, the neuronal activity patterns present under this anesthetic regimen may only be qualitatively similar to those present in the unanesthetized brain. Nevertheless, the urethane-anesthetized animal serves as a useful model for assessing the impact of extremes of brain state on functional connectivity within and between the cortex and basal ganglia (Steriade, 2000; Magill et al., 2004a; Sharott et al., 2005). In addition to recording striatal activity during spontaneously occurring brain states, we studied the firing of striatal neurons during cortical activation that was elicited by pinching the hindpaw for 15 s, as described previously (Magill et al., 2006). Occasionally, these somatosensory stimuli were delivered during a state of spontaneous cortical activation. The animals did not exhibit either a marked change in the electrocardiogram or respiration rate, and did not exhibit a hindpaw withdrawal reflex, in response to the pinch. Moreover, withdrawal reflexes were not present during episodes of spontaneous and/or prolonged cortical activation, thus indicating anesthesia was adequate throughout the recordings.
Following electrophysiological recordings, single neurons were juxtacellularly labeled with neurobiotin (Magill et al., 2000). Briefly, positive current pulses (2–10 nA, 200 ms, 50% duty cycle) were applied until the single-unit activity became robustly entrained by the current injections. A total of 130 striatal neurons were recorded and juxtacellularly labeled in this study. After the recording and labeling sessions, the animals were given a lethal dose of ketamine (150 mg/kg) and were perfused transcardially with 100 ml of 0.05 m PBS, pH 7.4, followed by 300 ml of 0.1% w/v glutaraldehyde and 4% w/v paraformaldehyde (PFA) in 0.1 m phosphate buffer, pH 7.4 (PB), and then by 200 ml of 4% w/v PFA in PB. Brains were then left in the latter fixative solution at 4°C until sectioning 24–72 h later.
Electrical stimulation of the motor cortex.
Parallel, bipolar stimulating electrodes (constructed from nylon-coated stainless steel wires; California Fine Wire), with tip diameters of ∼100 μm, a tip separation of ∼150 μm, and an impedance of ∼10 kΩ, were implanted into the ipsilateral motor cortex (Magill et al., 2004b). The coordinates of the cortical stimulation sites (2.5–4.0 mm anterior and 2.5–3.0 mm lateral of bregma, at depths of 2.0–2.2 mm below the dura) correspond to layers 5/6 of the primary/secondary motor cortices (Paxinos and Watson, 1986). The responses of striatal neurons to highly synchronized cortical outputs were then tested by focal electrical stimulation of motor cortex (Kolomiets et al., 2003; Magill et al., 2004b). Electrical stimuli, which consisted of single square-wave current pulses of 0.3 ms duration and variable amplitude (typically 600–900 μA), were delivered at a frequency of 0.5 Hz using a constant-current isolator (A360D; World Precision Instruments) that was gated by digital outputs from the Power1401 converter.
Tissue processing for identification of recorded and labeled neurons.
Parasagittal sections (50 μm) were cut from each brain using a vibrating microtome (VT1000S; Leica Microsystems), collected in series and washed in PBS. Free-floating sections were then incubated overnight at room temperature in Triton PBS (PBS containing 0.3% v/v Triton X-100 [Sigma]) containing Cy3-conjugated streptavidin (1:1000 dilution; Life Technologies). Sections containing neurobiotin-labeled neuronal somata (those marked with Cy3) were then isolated for molecular characterization by indirect immunofluorescence. Neurons with densely spiny higher-order dendrites were classified as projection neurons (MSNs) and were thus not tested for interneuron markers. Aspiny neurons were tested for expression of immunoreactivity for PV, choline acetyltransferase (ChAT), NOS, or calretinin (CR), with the initial choice of molecular marker guided by characteristic somatodendritic structure. These molecular markers clearly distinguish these four types of interneuron because they are seldom coexpressed in the same cell (Kubota et al., 1993; Tepper et al., 2010). If a neuron tested negative for the initial molecular marker, it was additionally tested for expression of one or more of the other markers until positive immunoreactivity was confirmed. Ten neurobiotin-labeled neurons that were either aspiny or were not well enough labeled with neurobiotin to rule out spines on their dendrites also tested negative for PV, ChAT, NOS, and CR, and thus, were not considered further. Most of the interneurons that tested positive for expression of NOS were also tested for expression of neuropeptide Y (NPY). Indirect immunofluorescence protocols were as standard (Mallet et al., 2012). Briefly, after 1–2 h of incubation in Triton PBS containing 10% v/v normal donkey serum (NDS; Jackson ImmunoResearch Laboratories), sections containing neurobiotin-labeled neuronal somata were incubated overnight at room temperature in Triton PBS containing 1% v/v NDS and one or more of the following primary antibodies: guinea pig anti-PV (1:1000; Synaptic Systems, 195004), rabbit anti-PV (1:1000; Swant, PV28), goat anti-ChAT (1:500; Millipore Bioscience Research Reagents, AB144P), mouse anti-NOS (1:500; Sigma, N2280), rabbit anti-NPY (1:5000; Immunostar, 812001), and rabbit anti-CR (1:1000; Synaptic Systems, 214102). After exposure to primary antibodies, sections were washed in PBS and incubated for 4–8 h at room temperature in Triton PBS containing fluorophore-conjugated secondary antibodies (all raised in donkey): Alexa Fluor 488 (1:500/1000; Life Technologies), DyLight 488 (1:500/1000), Cy5 (1:500), or DyLight 649 (1:500) (all Jackson ImmunoResearch). All secondary antibodies were highly cross-adsorbed by the manufacturers to reduce cross-species reactivity. After washing in PBS, sections were mounted on glass slides in Vectashield (Vector Laboratories), coverslipped, and viewed on a laser-scanning confocal microscope (Zeiss LSM 710). Appropriate sets of laser beams and emission windows were used for Alexa Fluor 488 and DyLight 488 (excitation 488 nm, emission 492–544 nm), Cy3 (excitation 543 nm, emission 552–639 nm), and Cy5 and DyLight649 (excitation 633 nm, emission 639–757 nm). For neurochemical characterization, single-plane confocal images were acquired using a 1 μm optical section and a 40× objective lens. Images of each of the fluorescence channels were taken sequentially and separately to minimize possible cross talk or “bleed through” of signal across channels. Absence of bleed through was assured for each fluorescence reaction. A neuron was classified as not expressing the tested molecular marker only when positive immunoreactivity could be observed in other cells on the same focal plane as the tested neuron. Occasionally, multiple-plane images were taken, and z-stack montages created, to better highlight the somatodendritic structure of labeled neurons. Digital images were cropped to regions of interest, with brightness and contrast adjusted when necessary, using Photoshop software (Creative Suite 3; Adobe Systems).
Data selection and analysis of firing of identified striatal neurons.
Artifact-free data were visually inspected and epochs of robust spontaneous SWA or spontaneous cortical activation were identified in ECoGs according to the previously described characteristics of these brain states (Steriade, 2000; Magill et al., 2004a). Recording epochs for a given neuron were only included in group analyses when they had a minimum duration of 70 s for SWA and 60 s for cortical activation; the majority of epochs analyzed were between 100 and 500 s (SWA: 376.4 ± 33.6 s; Activation: 257.2 ± 36.7 s [mean durations ± SEMs]). Putative single-unit activity was isolated with standard “spike-sorting” procedures (Mallet et al., 2008), including template matching, principal component analysis, and supervised clustering (Spike2). Isolation of a single unit was verified by the presence of a distinct refractory period in the interspike interval (ISI) histogram. For further analysis, single-unit activity was converted so that each spike was represented by a single digital event (Spike2).
All data analyses were performed using MATLAB (MathWorks) and associated toolboxes. Mean firing rate (spikes/s) was calculated from the total number of spikes per data epoch. The coefficient of variation of the ISI (CV), a value used widely as an indicator of regularity in point processes, was calculated (the lower the CV value, the more regular the unit activity). In addition, we calculated the mean CV2, another (related) measure of regularity that has been shown to be less sensitive to alterations in firing rate (Holt et al., 1996; Schulz et al., 2011a). Statistical comparisons of spontaneous firing properties were performed using a nonparametric Kruskal–Wallis ANOVA on ranks, followed by Dunn's test for post hoc definition of significant pairwise differences, or by using Mann–Whitney U Tests, as appropriate. The minimum significance level for these statistical tests was taken to be p < 0.05. All box plots in figures show the medians, the interquartile ranges (box), and extremes of the range (whiskers, within 99% of the distribution). Low-threshold Ca2+ spike bursts were identified according to quantitative criteria previously applied to extracellular unit recordings of thalamic projection neurons (Lacey et al., 2007). These strict criteria were at least two action potentials with an ISI of ≤5 ms but with a preceding silent period of >100 ms (Lu et al., 1992; Lacey et al., 2007). A maximum ISI of 10 ms was used to define the end of an LTS burst (Fanselow et al., 2001; Lacey et al., 2007). The characteristic temporal profiles of such LTS bursts include a progressive increase in ISIs (as the burst evolves), and the duration of the first ISI in a given burst is predictive of the total number of action potentials to be subsequently fired (Domich et al., 1986; Jeanmonod et al., 1996; Lacey et al., 2007).
Cholinergic interneurons have been reported to fire in three firing modes in vitro; “regular,” “irregular,” and “bursting” (Bennett and Wilson, 1999). To quantitatively distinguish between similarly diverse firing patterns in vivo, we used three measures of bursting/regularity: the proportion (%) of all spikes contained within bursts, the relative magnitude of the initial peak of the autocorrelogram, and the CV. Bursts of spikes were examined using criteria that best isolated the temporally clustered firing of these neurons under these in vivo conditions. These were at least two spikes with an ISI of <200 ms, with a preceding silent period of >400 ms, a period of quiescence of >300 ms following the burst, and a maximum burst length of 700 ms. These criteria were based on the ISI histograms of identified cholinergic interneurons (Fig. 1) and visual identification of bursts. The initial peak of the autocorrelogram has previously been used to characterize bursting/regularity in other types of tonically active neurons with similarly low firing rates (Paladini and Tepper, 1999). Autocorrelograms of single-unit activity were calculated using 5 ms bins. For each individual neuron, the statistical significance of autocorrelogram features (i.e., peaks) were assessed by constructing 100 surrogate spike trains with identical mean rates, but each with a Poisson distribution of ISIs capped at 9 and 1000 ms (the limits of ISI distributions across all the cholinergic interneurons; data not shown). The mean autocorrelogram of these surrogates was used to calculate a normalized index of the initial peak (mean of bins with a lag of 0.025–150 ms) of the autocorrelogram for each interneuron (with more positive index values reflecting larger autocorrelogram peaks). These autocorrelogram indices were analyzed together with percentage spikes in bursts and CVs using K-means supervised clustering to assign a specific firing mode (regular, irregular, or bursting) to each cholinergic interneuron recorded in vivo.
Figure 1.

Spontaneous activity of identified striatal cholinergic interneurons. Ai–Ci, Juxtacellularly labeled cholinergic interneurons, identified by their colocalization of fluorescent labeling for neurobiotin (NB) and choline acetyltransferase (ChAT), had characteristically large somata and thick, aspiny dendrites. Aii–Cii, Spontaneous action potential discharges (unit activity) of the same individual ChAT+ interneurons during robust cortical SWA, as recorded in the frontal ECoG. Neurons in Aii, Bii, and Cii are typical examples of single units that exhibited regular, irregular, or bursting firing modes, respectively. Note that each interneuron had a weak tendency to fire more often during the surface-positive active components of the cortical slow oscillation (∼1 Hz). Bursts fired by ChAT+ interneurons had highly variable ISI distributions and typically consisted of 3–5 spikes of steadily decreasing amplitude (Cii, inset). Aiii–Ciii, Firing of the same interneurons during spontaneous cortical activation. In each case, the ChAT+ interneuron firing mode was maintained across both brain states. D, The populations of ChAT+ interneurons recorded during SWA and/or cortical activation could be separated into three clusters (cyan, regular neurons; orange, irregular neurons; magenta, bursting neurons) on the basis of three parameters related to firing pattern: autocorrelogram peak index, the percentage of spikes in bursts, and the CV of the ISI. Filled and open circles show neurons recorded during SWA and activation, respectively (larger circles denote the individual neurons/recordings shown in A–C). Note that each cluster contains recordings made during both SWA and activated states. E, Normalized ISI histograms (means ± SEMs) of all interneurons in the three clusters in D (matched for color). Scale bars: Ai–Ci, 20 μm. Vertical scale bars: Aii–Cii and Aiii–Ciii, 1 mV; horizontal scale bars: Aii–Cii and Aiii–Ciii, 1 s. Horizontal scale bars: Cii inset, and Ciii inset, 200 ms. AU = arbitrary units.
Responses to somatosensory stimuli.
To test for a relationship between the striatal and cortical activities accompanying somatosensory stimulation, we recorded the firing of identified neurons before, during, and after hindpaw pinches. For analysis purposes, pinches were dichotomously categorized, according to the ECoG-defined brain state before and after the stimulus, as being either “driven activation” (the stimulus evoked a state transition from SWA to activation) or “activated pinch” (stimulus was delivered during a spontaneous activated state). Note that both types of recordings during pinches are distinct from the “spontaneous cortical activation” detailed in our results. Firing rate was calculated in 3 s bins, with a 2 s overlap, from 15 s before the pinch onset, 15 s during the pinch, and 15 s after the pinch offset. Neurons were only included in these analyses when three or more pinches of the same category were recorded (the responses were averaged). These average responses of each neuron were normalized to its baseline firing, that is, firing in the bins comprising the 15 s immediately before the pinch. Firing rate, CV, and CV2 were calculated for the 15 s before and during each pinch response and were compared using Wilcoxon sign-rank tests across all pinches for each neuron/condition.
Phase analysis.
To investigate how the activity of individual striatal neurons varied in time with respect to ongoing cortical network activity, we analyzed the instantaneous phase relationships between striatal spike times and cortical oscillations in specific frequency bands. ECoG signals containing robust SWA were first filtered, using a neutral-phase bandpass filter (Butterworth filter, three poles), at three frequency ranges to isolate slow (0.4–1.6 Hz), spindle (7–12 Hz), or “low gamma” (27–45 Hz) oscillations. Only gamma oscillations were isolated in ECoGs recorded during cortical activation. These frequency ranges were chosen according to previous studies of cortico-basal ganglia circuits using this animal model (Magill et al., 2004a; Mallet et al., 2008). Subsequently, the instantaneous phase and power of the ECoG in these frequency bands were separately calculated from the analytic signal obtained via the Hilbert transform (Lachaux et al., 1999). In this formalism, peaks in the ECoG oscillations correspond to a phase of 0° and troughs to a phase of 180°. Linear phase histograms, circular phase plots, and circular statistical measures were calculated using the instantaneous phase values for each spike. For phase analyses in the spindle and gamma ranges, a spike phase value was only included when the spike occurred during a period that exceeded a threshold of ≥0.5 SD of the mean instantaneous power in that range, a criterion which appeared to best capture the periods of increased oscillation in these highly dynamic ECoG recordings. Descriptive and inferential circular statistics were then calculated using the CircStat toolbox (Berens, 2009) for MATLAB. For the calculation of vector lengths and statistical comparisons, we included only those neurons that fired ≥40 spikes during the entire analyzed epoch (for analysis of slow oscillations) or during just “suprathreshold periods” (for spindle/gamma oscillations). These neurons were then tested for significantly phase-locked firing (defined as having p < 0.05 in Rayleigh's uniformity test). The null hypothesis for Rayleigh's test was that the spike data were distributed in a uniform manner. For each of the neurons that fulfilled these criteria, the mean phase angle was calculated. Differences in the mean phase angles of groups of neurons were tested for using the Watson–Williams F test (p < 0.05 for significance). The mean resultant vector length (referred to hereafter as simply vector length) of the phase distribution, bound between zero and one (the closer to one, the more concentrated the angles), was used to quantify the level of phase locking around the mean angle for individual neurons (computed using the angles of each spike) and for populations of neurons (computed using the mean angle for each neuron). The population vector lengths and mean angles for each cell type are shown in the smaller circular plots in Figures 8 and 9. Differences between the vector lengths of two neuron populations were tested for using the Mann–Whitney U test, whereas vector comparisons between three or more groups were made using Kruskal–Wallis ANOVAs with post hoc Dunn's tests. Where data are displayed in circular plots (Figs. 8 and 9), lines radiating from the center are the vectors of the preferred phases of firing. The small open circles on the perimeter of each circular plot represent the preferred firing phase of each neuron (Fig. 8C). The power spectra of the ECoG signals were calculated using the MATLAB toolbox Neurospec (www.neurospec.org). The power of the ECoG in the slow, spindle and gamma frequency bands was compared in data epochs used for analyses of phase-locked striatal neuron firing to test whether they were significantly different between groups.
Figure 8.
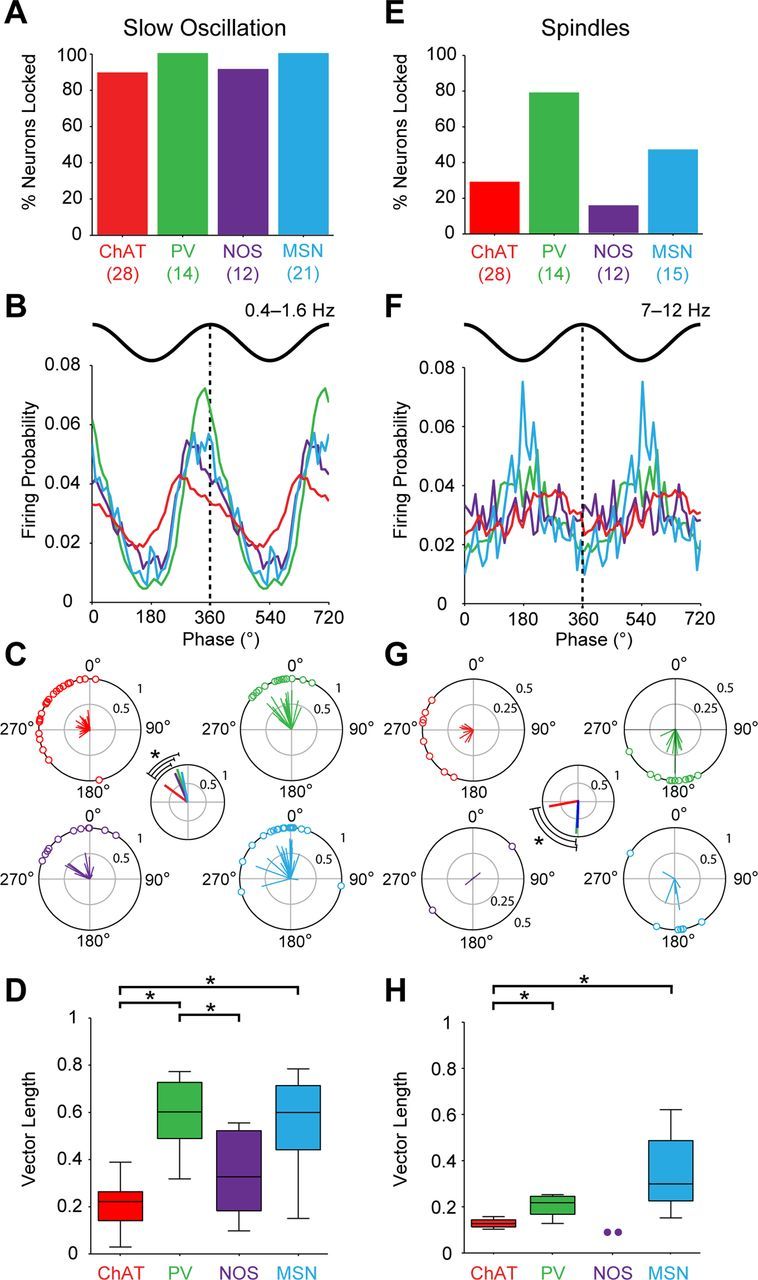
Striatal cell type-selective phase locking of firing to ongoing cortical network oscillations during SWA. A–D, Phase-locked firing of striatal neurons to cortical slow oscillations (0.4–1.6 Hz). A, Proportions of neurons of each type that were significantly phase locked. The number of neurons tested in each group is shown in parenthesis. B, Linear phase histograms of significantly locked striatal interneurons and MSNs (data are means). For clarity, two cortical slow oscillation cycles are shown. All types of neurons tended to fire along the ascending portion of the oscillation. C, Circular plots for each neuron of each type showing the mean angle of phase locking. Vectors of preferred firing (i.e., mean phase of all the spikes) of individual neurons are shown as lines radiating from the center. Greater vector lengths indicate lower variance in the distribution around the mean phase angle for each neuron. Each circle on the plot perimeter represents the preferred phase angle of an individual neuron. The smaller center plot shows the vector length and mean angle for each population, with the statistical comparison of the latter (*p < 0.05, Watson–Williams F tests). The mean angle of phase locking of ChAT+ interneurons was significantly different from those of the other three neuron types. D, Vector lengths for each neuron type. The vector length here measures, on a cell-by-cell basis, the consistency of locking around the mean angle, with 0 being random and 1 being zero variance. ChAT+ interneurons and NOS+ interneurons had significantly shorter vectors and thus, were weaker locked to slow oscillations, than PV+ interneurons. ChAT+ interneurons were also weaker locked than MSNs (*p < 0.05 for both Kruskal–Wallis ANOVAs and post hoc Dunn's tests). E–H, As in A–D, but phase-locked firing to cortical spindle oscillations (7–12 Hz). Note that the proportions of locked neurons during spindles, as well as the preferred phases and variance of their firing, differed as compared with those during slow oscillations. However, ChAT+ interneurons were still weaker locked than PV+ interneurons and MSNs. NOS+ interneurons were not included in statistical analyses in G and H because of the small sample of significantly locked interneurons (n = 2), but are shown for comparison.
Figure 9.

PV+ interneurons and ChAT+ interneurons can phase lock their firing to cortical gamma oscillations. A–D, Phase-locked firing of striatal neurons to cortical gamma oscillations (27–45 Hz) during SWA. A, Proportions of neurons of each type that were significantly phase locked. The number of neurons analyzed tested in each group is shown in parentheses. Only ChAT+ interneurons and PV+ interneurons phase locked their firing at the population level well above chance (5%). B, Mean phase histograms of significantly locked ChAT+ interneurons and PV+ interneurons (two gamma cycles shown for clarity). These neuron types tended to fire most around either side of the gamma oscillation troughs. C, Circular plots of the preferred firing of ChAT+ interneurons and PV+ interneurons (following the same labeling and conventions of plots in Fig. 8). The mean angle of phase locking of ChAT+ interneurons was significantly different from that of PV+ interneurons (smaller plot, left). D, Vector lengths for each neuron type. ChAT+ interneurons had significantly shorter vectors and thus, were weaker locked to gamma oscillations, than PV+ interneurons (*p < 0.05, Mann–Whitney U test). E–H, As in A–D, but phase-locked firing to gamma oscillations (27–45 Hz) present during spontaneous cortical activation. Again, ChAT+ interneurons and PV+ interneurons most often phase locked their firing to cortical gamma oscillations. However, in contrast to gamma during SWA, they phase-locked their firing to the same mean angle and with the same strength.
The Rayleigh statistic tests against the null hypothesis that the phase sample was taken from a uniform circular distribution, which would be expected to be the case when testing the filtered product of a sinusoidal ECoG oscillation against an independent spike train with random (Poisson-like) statistics. However, in common with previous work (Saleem et al., 2010), we observed that, on average, the active and inactive components of the ECoG slow oscillation were of different durations (data not shown), indicating that the cortical slow oscillation is nonsinusoidal. Carrying this cortical timing bias over many cycles could lead to a significant result in Rayleigh's test for even a truly random spike train, simply because more spikes would occur during the longer component than the shorter component of the slow oscillation. This bias can thus confound the phase analysis of neurons that fire relatively consistently during both components of the cortical slow oscillation (e.g., some cholinergic interneurons; Fig. 1). To control for this possible bias in each recording of a unit–ECoG pair, 1000 phase histograms were calculated using surrogate spike trains with mean rates identical to that of the “real” neuron, but with spikes placed at random. The mean phase histogram of these surrogates revealed any deviation from the uniform distribution (i.e., a spurious peak) that arose from ECoG components of unequal durations. We then calculated how many spike counts in each bin would need to be randomly redistributed across the histogram to create a uniform phase distribution for the surrogates. To remove the systematic bias, this redistribution process was then applied to the real phase values by randomly reassigning a phase value for each spike count in each bin above the uniform distribution to another bin. This process was repeated 1000 times to give average circular means and vector lengths for a corrected spike train that was free from the bias arising from the nonsinusoidal ECoG reference signal. Neurons were considered to exhibit significantly phase-locked firing if >95% of Rayleigh's tests (of these 1000 redistributed values) were still significant (effectively giving p < 0.05%).
Responses to electrical stimulation of cortex.
Peristimulus time histograms (PSTHs) were constructed from 50 to 200 consecutive stimulation trials with 1 ms bins, and were normalized to give firing probability. Neurons were considered to respond significantly at “short latency” or “long latency” if the first spike following the stimulus was fired in a response window of 1.5–15 ms or 20–50 ms, respectively, in >35% of stimulation trials. The first spike in each stimulus trial, rather than the peak of the response in the PSTH, was therefore used to measure the response latency. For those neurons responding at short latencies, the mean latencies of the first spikes in this time window were compared using a Kruskal–Wallis ANOVA with post hoc Dunn's tests.
Results
Spontaneous firing of identified striatal interneurons during SWA and cortical activation states
We recorded and juxtacellularly labeled a total of 130 neurons in dorsal striatum, 74 of which were subsequently identified by their immunofluorescence signals as ChAT+, PV+, or NOS+ interneurons. Forty-six neurobiotin-labeled neurons were classified as MSNs on the basis of their densely spiny dendrites. We aimed to characterize the firing of these striatal interneurons and projection neurons in relation to distinct brain states and the cortical network oscillations that define them. Our analyses focused on striatal neuron firing during two well defined brain states that are evident in urethane-anesthetized rats; SWA and cortical activation (Steriade, 2000; Magill et al., 2006).
Cholinergic interneurons (n = 38 ChAT+ neurons) had characteristically large somata (>20 μm across longest axis), from which emanated thick, aspiny dendrites that branched extensively in distal portions (Fig. 1Ai–Ci). During cortical SWA, ChAT+ interneurons fired at relatively slow rates (4.2 ± 0.2 spikes/s) and displayed one of three distinct firing patterns or modes: regular, irregular, or bursting (Fig. 1), which are reminiscent of those described for cholinergic interneurons in vitro (Bennett and Wilson, 1999). Most ChAT+ interneurons tended to fire in a single mode, and notably, individual neurons could maintain their preferred firing pattern across SWA and cortical activation (Fig 1A–C). To quantitatively classify the ChAT+ interneuron firing pattern in each of our recordings, we examined a normalized index of the initial peak of the autocorrelogram, the percentage of spikes in bursts and the CV of the ISI (see Materials and Methods). Using these parameters for each ChAT+ interneuron recorded during SWA and/or cortical activation, we could separate the population into three clear groups (Fig. 1D). The average ISI histograms for regular, irregular, and bursting neuron groups displayed unimodal, mixed, and bimodal distributions, respectively (Fig. 1E), supporting the validity of this classification scheme. The most common mode of firing was regular (52%), followed by irregular (39%), and then bursting (9%). Each cluster contained neurons recorded in SWA and/or activation (Fig. 1D), confirming that these firing patterns were not selective for one or the other brain state. There were no significant differences in the mean firing rates of the different ChAT+ interneuron groups as defined by firing mode. Regular, irregular, and bursting neurons had weak tendencies to fire more during the active components (i.e., around the peaks) of the cortical slow (∼1 Hz) oscillation. However, the average power of slow oscillations (0.4–1.6 Hz) in the ECoGs recorded with ChAT+ interneurons during SWA was not significantly correlated with any of the parameters we used to define firing mode (Pearson's correlation coefficient, p > 0.05), suggesting the tendency to fire with a regular, irregular, or bursting pattern is not dependent on SWA.
PV-expressing GABAergic interneurons (n = 24 PV+ neurons) had medium-sized somata (10–25 μm in diameter) and varicose aspiny dendrites that extensively ramified close (<300 μm) to the cell body (Fig. 2Ai–Ci). Of all the types of striatal neuron recorded in this study, PV+ interneurons had the most variable activity during SWA, ranging from neurons that fired only a single spike once every 30–60 s to those that fired high-frequency bursts of spikes on almost every active component of the cortical slow oscillation (Fig. 2Aii–Cii). There was no clear correlation between the power of cortical slow oscillations (0.4–1.6 Hz) and the different firing rates/patterns of PV+ interneurons during SWA (Pearson's correlation coefficient, p > 0.05). In the spontaneously activated brain state, nearly all PV+ interneurons fired more frequently and displayed more regular firing as compared with that during SWA, although temporal dynamics again varied considerably across interneurons (Fig. 2Aiii–Ciii).
Figure 2.

Spontaneous activity of identified striatal PV-expressing interneurons. Ai–Ci, Juxtacellularly labeled PV+ interneurons had medium-sized somata and varicose aspiny dendrites that extensively branched proximal to somata. Aii–Cii, Spontaneous action potential discharges of the same individual PV+ interneurons during robust cortical SWA. Identified PV+ interneurons fired single spikes or bursts of spikes in time with the active components of the cortical slow oscillation but varied markedly in their firing rates and fidelity of coupling, ranging from those that fired on a few slow oscillation cycles (Aii) to those that fired on most (Bii) or all (Cii) cycles. Bursts typically consisted of 5–15 spikes (Cii–iii, insets). Aiii–Ciii, Firing of the same interneurons during spontaneous cortical activation. Typically, PV+ interneurons fired faster and more regularly during cortical activation (Aiii, Biii), or at least maintained their relatively high firing rates (Ciii), as compared with their firing during SWA. Scale bars: Ai–Ci, 20 μm. Vertical scale bars: Aii–Cii and Aiii–Ciii, 1 mV; horizontal scale bars: Aii–Cii and Aiii–Ciii, 1 s. Horizontal scale bars: Cii inset and Ciii inset, 200 ms.
NOS-expressing GABAergic interneurons (n = 12 NOS+ neurons) had medium-sized somata (15–25 μm) and long aspiny dendrites that often extended for hundreds of micrometers without branching (Fig. 3Ai–Ci). All NOS+ interneurons tested (n = 10 of 12) also expressed NPY (Fig. 3Ai–Ci). During SWA, NOS+ interneurons typically fired bursts of spikes in time with the active component of the cortical slow oscillation (Fig. 3Aii–Cii). For most neurons (n = 8 of 12), these bursts were particularly robust, and contained many (5–12) spikes; these long bursts characteristically contained a distinct series of 3–5 spikes with short ISIs and progressively decreasing amplitudes (Fig. 3Bii–Cii insets). In a minority of neurons (n = 4), bursts consisted of only two or three spikes (Fig. 3Aii). During spontaneous cortical activation, NOS+ interneurons fired single spikes at much lower rates than those observed during SWA (Fig. 3Aiii–Ciii).
Figure 3.

Spontaneous activity of identified striatal interneurons expressing NOS. Ai–Ci, Juxtacellularly labeled NOS+ interneurons had medium-sized somata and long, aspiny dendrites that branched infrequently. All NOS+ interneurons tested coexpressed NPY. Aii–Cii, Spontaneous action potential discharges of the same individual NOS+ interneurons during spontaneous cortical SWA. Typically, NOS+ interneurons fired bursts of spikes in time with the active components of most cortical slow oscillations. Although some NOS+ interneurons fired only 2–3 spikes in each burst (Aii), the majority fired more robust bursts of 5–12 spikes (Bii, Cii). Near the center or toward the end of these longer bursts, NOS+ interneurons usually fired a characteristic series of spikes at short intervals; such series were often accompanied by decreases in spike amplitude (*, Bii and Cii, insets). Aiii–Ciii, Firing of the same interneurons during spontaneous cortical activation. Typically, NOS+ interneurons fired single spikes at comparatively low rates (<2 spikes/s) during the activated state. Scale bars: Ai–Ci, 20 μm. Vertical scale bars: Aii–Cii and Aiii–Ciii, 1 mV; horizontal scale bars: Aii–Cii and Aiii–Ciii, 1 s. Horizontal scale bars: Bii inset and Cii inset, 200 ms.
A population of striatal units fires low-threshold Ca2+ spike bursts
Most NOS+ interneurons in rat striatum also express NPY, somatostatin, and NADPH diaphorase (Kawaguchi, 1993; Figueredo-Cardenas et al., 1996). When intracellularly recorded in vitro, one of the distinguishing electrophysiological features of these striatal interneurons is their ability to fire LTS bursts (Kawaguchi, 1993). In thalamic neurons, LTS bursts can be extracellularly identified by their characteristic temporal profile and several strict criteria (Domich et al., 1986; Lu et al., 1992; Jeanmonod et al., 1996; Lacey et al., 2007). In agreement with previous extracellular recordings of rat striatal neurons during halothane anesthesia (Sharott et al., 2009), we recorded several striatal units (n = 13) that fired numerous high-frequency burst discharges, containing up to six spikes, that satisfied classical criteria for LTS bursts (Fig. 4A). During SWA and cortical activation, 75.3 ± 5.9% and 28.6 ± 6.7% of all their spikes occurred within such bursts, respectively. There was a characteristic ISI increase during the LTS bursts (Fig. 4B), and the first ISI in an LTS burst was predictive of the total number of spikes fired (Fig. 4C). We were not able to successfully label and identify these “LTS units”, but their activity was clearly different from that of identified NOS+ interneurons. For example, the average ISI histogram of LTS units, but not NOS+ interneurons, showed a prominent peak <4 ms, which reflects the high-frequency nature of the LTS bursts (Fig. 4D,E). In line with this distinction, the vast majorities of our identified NOS+, ChAT+, or PV+ interneurons did not fire any LTS bursts (the exception was two PV+ neurons, which each fired <1% of all their spikes in such bursts). Although we cannot rule out the possibility that subthreshold LTS events of some kind underlie a number of the action potentials fired by NOS+ interneurons in vivo, these data show that such LTS events, if they occur, do not result in spike patterns that fit classical criteria for LTS bursts. The firing patterns of these LTS units may, therefore, represent another cell type in striatum.
Figure 4.
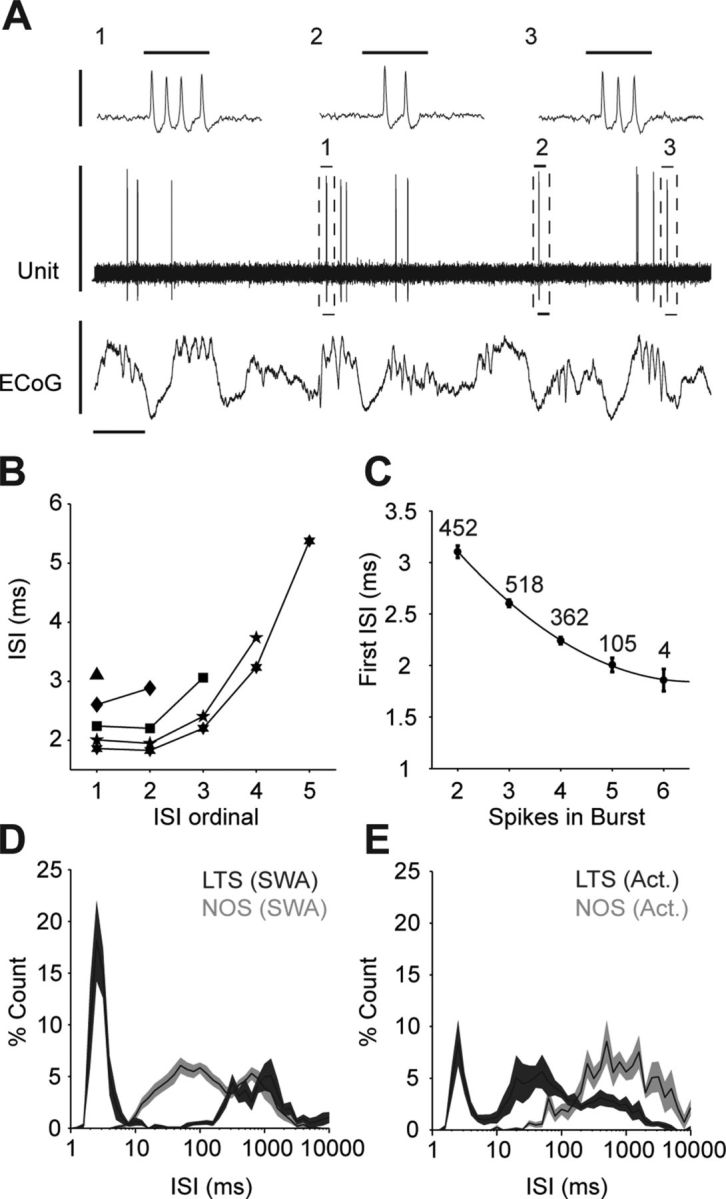
Striatal units displaying classical extracellular characteristics of low-threshold spike bursts have different firing properties to identified NOS+ interneurons. A, Recording of a single unit in striatum (an unlabeled neuron) that, during cortical SWA, fired bursts of 2–6 action potentials that fit classical extracellular criteria of LTS bursts. Thus, after a period of quiescence lasting >100 ms, such LTS units often fired high-frequency spike bursts (three typical bursts, 1–3, are outlined by dashed boxes) with an initial intraburst spike interval of <5 ms. Horizontal scale bars for expanded LTS bursts 1–3 (top traces) are 10 ms. B, Mean ISI as a function of the number of spikes in an LTS burst (all LTS bursts of 2–6 spikes from all LTS units recorded in SWA and/or cortical activation are plotted). Note the progressive increases in ISI durations as the bursts evolve. C, The duration of the first ISI in a given LTS burst was highly predictive of the total number of spikes to be subsequently fired. The negative correlation was well fit by an exponential decay function (black line). Numbers indicate number of bursts analyzed. D, Normalized ISI histograms of LTS units (dark gray) and identified NOS+ interneurons (light gray) recorded during SWA. E, Normalized ISI histograms of LTS units and NOS+ interneurons recorded during spontaneous cortical activation (Act.). Note that, regardless of brain state, LTS units and NOS+ interneurons exhibited different histogram profiles, as particularly evident at short ISIs (<10 ms). Vertical scale bars, A, 1 mV; horizontal scale bar, A, 1 s. Data in B are means, data in C are means ± 2 SEMs, and data in D–E are means ± SEMs.
Quantitative comparison of the electrophysiological properties of identified striatal interneurons recorded during different cortical states
To better define the range of activity displayed by each type of striatal interneuron, as well as MSNs, we compared their firing rates/patterns across SWA and cortical activation. The ChAT+ interneurons and PV+ interneurons had significantly higher firing rates in the spontaneously activated state as compared with SWA (Mann–Whitney U tests; Fig. 5A), whereas the average firing rate of NOS+ interneurons was significantly lower during spontaneous cortical activation (Fig. 5A). No significant firing rate difference was found for the MSN population, despite many of them becoming quiescent (or nearly quiescent, i.e., <0.01 spikes/s) in the spontaneously activated state, as previously reported (Mallet et al., 2005). In terms of firing patterns, significant decreases in CV2 measures indicated that PV+ interneurons and MSNs fired more regularly in the activated state (Fig. 5B). The firing regularities of ChAT+ interneurons and NOS+ interneurons were, on average, not affected by brain state.
Figure 5.

Quantitative comparisons of firing rates and patterns of identified striatal interneurons and projection neurons according to brain state. A, Firing rates of striatal interneurons (ChAT+, red; PV+, green; or NOS+, purple) and projection neurons (MSNs, blue) during SWA and spontaneous cortical activation (Act.). Black bars and asterisks underneath box plots indicate significant differences within a cell type (p < 0.05, Mann–Whitney U tests), whereas bars and asterisks above box plots indicate significant differences across cell types (p < 0.05 for both Kruskal–Wallis ANOVAs and post hoc Dunn's tests). The number of neurons included in each group is shown in parenthesis and is the same for A and B. B, Firing regularities of striatal interneurons and MSNs during the two spontaneous brain states. Regularity was quantified by CV2 measures, with a lower CV2 reflecting more regular firing. C, Normalized ISI histograms (means ± SEMs) for each cell type during SWA (darker colors) and activation (lighter colors). D, Analyses of action potential shape. Di, Mean action potential waveforms for each cell type (means ± SEMs), indicating parameters used for subsequent plots. Dii, Scatter plot of average durations of action potential peaks (d1) and troughs (d2) for every identified neuron (color coded as in Di). The characteristically brief spikes fired by PV+ interneurons (green) are partially separated, but the spikes of the other three cell types are interspersed. Diii, Scatter plot of average slopes of first two deflections of action potentials (s1 and s2 in Di). ChAT+ interneurons, PV+ interneurons, and MSNs are somewhat segregated from each other. Div, Scatter plot of the slopes s1 and s2 corrected for spike amplitude. ChAT+ interneurons, PV+ interneurons, and MSNs are almost segregated from each other, but NOS+ interneurons are mostly contained within the ChAT+ interneuron cluster. Box plots in this and all subsequent figures show the medians, the interquartile ranges (box), and extremes of the range (whiskers, within 99% of the distribution).
Having established that the fundamental firing properties of these identified striatal neurons are often dependent on brain state, we examined whether they could nevertheless be used to distinguish between different cell types. When the three types of interneurons were considered together with MSNs, there were significant effects of cell type on firing rate and regularity (firing rate, CV, and CV2; all Kruskal–Wallis ANOVAs). During SWA, all three types of interneurons had significantly higher firing rates than MSNs, but firing rates between interneuron groups were not significantly different (Dunn's tests; Fig. 5A). During spontaneous cortical activation, PV+ interneurons and ChAT+ interneurons, but not NOS+ interneurons, had significantly higher firing rates than MSNs (Fig. 5A). The PV+ interneurons and ChAT+ interneurons also had significantly higher firing rates than NOS+ interneurons. Despite heterogeneous firing patterns within the ChAT+ interneuron population (Fig. 1), they had, on average, significantly more regular firing compared with the other types of striatal neuron, regardless of brain state (Fig. 5B). Thus, in contrast to other neuron types, the average ISI histogram of ChAT+ interneurons was more concentrated (approaching a unimodal distribution) during both SWA and activation (Fig. 5Ci). The average ISI histograms of the other interneurons and MSNs were clearly bimodal during SWA (Fig. 5Cii-iv), with a second peak at ∼1 s reflecting their increased tendency to fire in time with the cortical slow oscillation (see below). Although NOS+ interneurons fired faster and with greater regularity than MSNs during SWA, there was no difference in the firing rates or patterns of these two cell types during activation (Fig. 5A,B).
The quantitative group analyses above show that, depending on brain state, the firing rates and/or patterns of ChAT+ interneurons, PV+ interneurons, and NOS+ interneurons are, on average, different from each other as well as different from MSNs. However, as is also evident in the group data (Fig. 5A,B), there are substantial overlaps in the firing properties of each cell type, thus confounding ready classification of cell type on the basis of rate/pattern alone. With this in mind, we tested additional electrophysiological parameters that might be useful in further teasing apart their activity signatures. Many studies have used the waveforms of extracellularly recorded action potentials to assign putative cell-type identities to striatal units (Berke et al., 2004; Mallet et al., 2005; Sharott et al., 2009). It was readily apparent in our extracellular recordings that PV+ interneurons fired spikes that were shorter in duration (∼1 ms) than those fired by the other neuron types (typically >1.5 ms) (Fig. 5Di). Scatter plots of the durations of the first (peak) and second (trough) deflections of the average spikes of all identified neurons reflected this observation; only the PV+ interneurons formed a separate cluster, although this was occasionally infiltrated by other neuron types (Fig. 5Dii). Plots of the slopes of these deflections (Fig. 5Di) produced a slightly better separation between PV+ interneurons, ChAT+ interneurons, and MSNs (Fig. 5Diii), but did not improve on the degree of separation achieved for nonidentified neurons recorded using metal electrodes (Berke et al., 2004; Sharott et al., 2009). We attempted to correct each spike waveform parameter using the function of the best-fit linear relationship with amplitude. Linear correlations between peak/trough duration and amplitude were weak and therefore produced little improvement in separation of clusters. The spike slope parameters, however, showed strong linear correlations with amplitude and, after correction, led to a considerable improvement in cluster separation between PV+ interneurons, ChAT+ interneurons, and MSNs (Fig. 5Div). In addition, using the corrected slopes meant that NOS+ interneurons were confined to the ChAT+ interneuron cluster (cf. Fig. 5Diii,Div).
In summary, these striatal interneurons and MSNs displayed brain state-dependent differences in their firing rates and regularities, and some key differences in their action potential waveforms. However, our data suggest that, at least for extracellular recordings using this and similar configurations, these electrophysiological parameters cannot be used in isolation to unequivocally distinguish these interneurons from each other, or from MSNs, in a given brain state. Thus, neurochemical identification and/or a combination of these and other electrophysiological parameters are necessary for classifying individual striatal neurons with confidence.
Striatal interneurons show cell type-specific responses to somatosensory stimulation
Having established that the firing rates and/or patterns of these interneurons differ according to the cortical states that spontaneously arise under this anesthetic regimen, we hypothesized that they would also fire differently during sensory input-driven changes in cortical activity. To test this, we examined the responses of each type of interneuron to somatosensory stimulation, delivered to the contralateral hindpaw as a standardized sustained (15 s) pinch. Each cortical response to this stimulus was categorized according to its ECoG effect; pinches that led to a transition from SWA to cortical activation were considered to constitute driven activation, whereas those pinches that were delivered during the activated state itself, and thus, did not cause this ECoG transition, were categorized as activated pinch.
Figure 6 shows the responses of four different ChAT+ interneurons to driven activation. During the initial SWA (just before the pinch delivery), the firing rate/pattern of each is markedly different, thus reflecting the diverse spontaneous firing of cholinergic interneurons (Fig. 1). In the case of the first interneuron, whose firing was relatively well locked to the cortical slow oscillation (Fig. 6A), the pinch stimulus resulted in a change of firing pattern to a more regular, single-spike firing. In the other three cases, there were negligible changes in firing rate and pattern during stimulus delivery (Fig. 6B–D). Thus, despite small increases and decreases being exhibited by individual interneurons (Fig. 6E,F), there was, on average, no significant change in firing rate during the pinch (n = 41 pinches tested across 12 neurons; Wilcoxon sign-rank test). Similarly, there was no change in firing pattern, as measured by CV or CV2 (Fig. 6G). However, there was a significant decrease in unit-ECoG coherence at cortical slow oscillation frequencies (0.4–1.6 Hz) during the pinch (Fig. 6H), in line with the diminished slow oscillations that help define the activated state, but the magnitude of this coherence change showed no significant correlation with any measure of firing rate or pattern. The few ChAT+ interneurons we recorded during activated pinches (n = 3 interneurons) again showed only minor changes in firing rate or pattern (data not shown).
Figure 6.

Cholinergic interneurons respond weakly to cortical activation driven by somatosensory stimulation. A–D, Recordings of four different ChAT+ interneurons (top traces, unit activities) before, during, and after a 15 s pinch delivered to the hindpaw (gray bars). As shown by the ECoGs (bottom traces), the somatosensory stimulus led in each case to a brain state transition from SWA to cortical activation. Each interneuron exhibited a different firing mode during SWA: regular, but weakly timed with the cortical slow oscillation (A); regular, but not timed with slow oscillations (B); irregular (C); and bursting (D). Only the interneuron in A substantially changed its firing (pattern) in response to the pinch; the other three interneurons exhibited negligible changes in firing rate/pattern. E, Mean responses of all ChAT+ interneurons tested (thin gray lines) and their grand average response (thick black line), normalized to baseline firing rate (15 s immediately before the pinch). Pinch delivery is indicated by gray bar. F, G, Mean firing rate (F) and mean CV2 (G) of each interneuron before and during each pinch (denoted Pre. and Pin., respectively). H, Coherence between ECoG slow oscillations (0.4–1.6 Hz) and the firing of each interneuron before and during the pinch (*p < 0.05, Wilcoxon test). Note that, despite the reduced coherence that reflects the diminished slow oscillations during activation (H), ChAT+ interneurons did not on average significantly change either their firing rate or regularity during somatosensory stimulation (E–G). Vertical scale bars: A–D, 1 mV; horizontal scale bars: A–D, 1 s. Larger filled circles in F–H show the population means from all pinches (±2 SEMs).
In contrast to cholinergic interneurons, most PV+ interneurons and NOS+ interneurons displayed striking responses to these somatosensory stimuli (Fig. 7). Individual PV+ interneurons could respond with a sustained increase in firing rate during both driven activations and activated pinches (Fig. 7A). Although highly variable in relative magnitude, such increases were exhibited by most PV+ interneurons for both types of stimuli (Fig. 7B,C) and, on average, firing rates significantly increased during driven activation (Fig. 7D; n = 19 pinches tested across five neurons) and activated pinches (Fig. 7E; n = 22 pinches tested across seven neurons). In addition, there was an increase in PV+ interneuron firing regularity during the stimulus, evident as a significant decrease in mean CV2 for both categories of pinches (from 1.22 to 0.86 during driven pinches, and from 0.93 to 0.79 during activated pinches). Compared with PV+ interneurons, the NOS+ interneurons had the opposite firing rate response to somatosensory stimulation (Fig. 7F–J). Figure 7F shows the responses of two NOS+ interneurons (recorded in the same animal) to driven activation and activated pinch, respectively. In both cases, there was a reduction in firing for the duration of the stimulus. For driven activation, this response was highly consistent across NOS+ interneurons, the decrease in firing rate being more prominent in the first 5 s after pinch onset (Fig. 7G), and, on average, this decrease was significant across pinches (Fig. 7I; n = 28 pinches tested across six neurons). Of the three NOS+ interneurons we recorded during activated pinches, two showed decreasing firing rates and one showed an increase in firing rate at the start of the pinch, leading to no significant difference on average (Fig. 7J; n = 11 pinches tested across three neurons).
Figure 7.
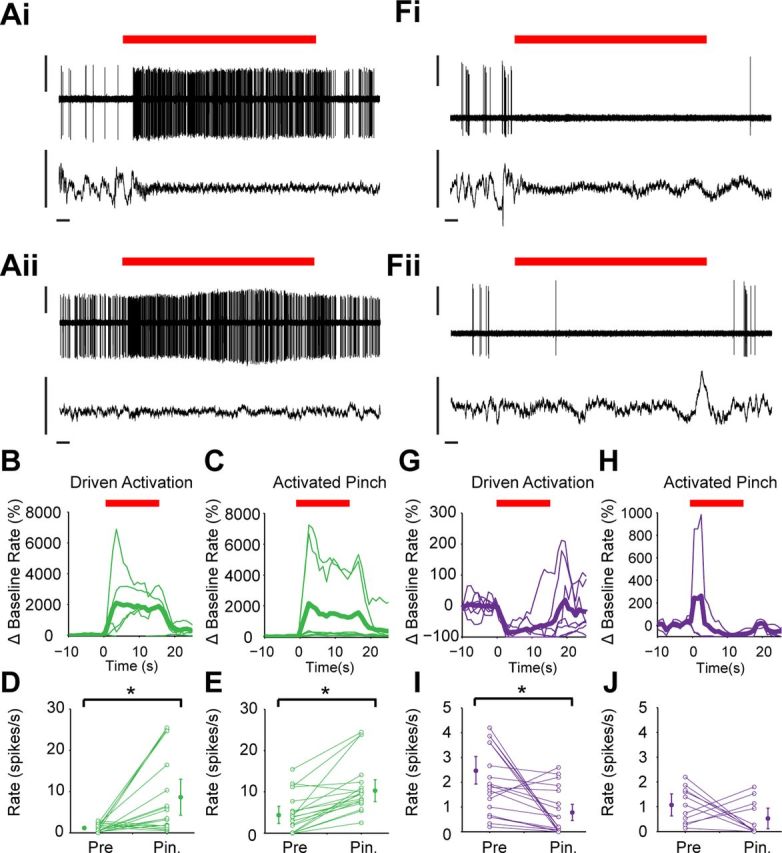
PV+ interneurons and NOS+ interneurons respond in opposite ways to somatosensory stimulation. A, Responses of the same PV+ interneuron to a 15 s hindpaw pinch (red bar) that led to a brain state transition (driven activation in Ai) and another pinch that was delivered during spontaneous cortical activation (activated pinch in Aii), as defined by the ECoGs (lower traces). Both stimuli were associated with a sustained increase in interneuron firing rate. B, C, Mean normalized responses of all PV+ interneurons tested (thin lines) and their grand average responses (thick lines) to driven activation (B) and activated pinch (C). D, E, Mean firing rate of each PV+ interneuron before (Pre) and during (Pin.) every test of driven activation (D) and activated pinch (E). Population means (±2 SEMs) are shown by larger filled circles. Note that, on average, PV+ interneurons significantly increased their firing during somatosensory stimulation (*p < 0.05, Wilcoxon test). F, Responses of two different NOS+ interneurons, recorded in the same animal, to driven activation (Fi) and activated pinch (Fii). In both cases, the pinch delivery (red bars) was associated with a sustained decrease in firing rate. G, H, Normalized mean responses of all NOS+ interneurons tested (thin lines) and their grand average responses (thick lines) to driven activation (G) and activated pinch (H). I, J, Mean firing rate of each NOS+ interneuron before and during every test of driven activation (I) and activated pinch (J). Note that, on average, NOS+ interneurons significantly decreased their firing during driven activation (*p < 0.05, Wilcoxon test). Vertical scale bars: A and D, 1 mV; horizontal scale bars: A and D, 1 s.
In summary, striatal interneurons demonstrated notable cell type-specific differences in their firing during sensory input-driven changes in cortical activity. On average, ChAT+ interneurons did not respond to somatosensory stimulation with a significant change in firing rate or pattern. In contrast, PV+ interneurons increased their firing rate and regularity, whereas NOS+ interneurons decreased their firing rate.
Phase-locking of striatal neuron activity to cortical network oscillations
Given that the firing rates/patterns of some types of striatal interneuron are highly dependent on brain state, and that brain states here are defined by cortical oscillations, we next investigated the fine temporal dynamics of these activity relationships. The ECoG displays several distinct oscillations that are synchronized across many brain areas, including the basal ganglia. For example, during SWA, slow oscillations (∼1 Hz) and spindle oscillations (7–12 Hz) are prominent activities across several basal ganglia nuclei, including striatum (Berke et al., 2004; Magill et al., 2004a). Gamma-frequency oscillations (typically >30 Hz) also occur during SWA and have been used to study cortical microcircuits (Hasenstaub et al., 2005). They become particularly prominent during cortical activation (Magill et al., 2004a). We thus focused our analyses on the relationships between the firing of our four populations of identified striatal neurons and cortical network oscillations in these three frequency bands.
Regardless of cell type, the firing of >85% of striatal neurons in each population was significantly locked to the cortical slow oscillation (Rayleigh's uniformity tests; Fig. 8A), and, on average, phase-locked neurons fired on the ascending portion (near the peak) of the oscillation (Fig. 8B). After accounting for the nonsinusoidal nature of cortical slow oscillations (see Materials and Methods), the mean phase angle of firing of ChAT+ interneurons was significantly different (earlier in the cycle) compared with the other three neuron types, which fired at comparatively similar phases to each other (Watson–Williams F tests; Fig. 8C). Population vector lengths were relatively large, and similar across all four neuron types (Fig. 8C, center), suggesting the mean angle of firing was highly consistent within each population. In terms of the relative strengths of phase-locked firing, however, there was a significant effect of cell type on vector length (Kruskal–Wallis ANOVA), with ChAT+ interneurons exhibiting significantly shorter vector lengths and thus, weaker locking to the slow oscillation, as compared with PV+ interneurons and MSNs (Dunn's test; Fig. 8D). In addition, PV+ interneurons also had significantly greater vector lengths and thus, tighter locking, than NOS+ interneurons (Fig. 8D).
In contrast to slow oscillations, different types of striatal neurons showed clear differences in their respective propensities to fire in a phase-locked manner to spindle oscillations (Fig. 8E). For example, whereas most PV+ interneurons fired phase-locked to spindle oscillations, the NOS+ interneurons did so only rarely (too few to quantitatively analyze). On average, both PV+ interneurons and MSNs tended to fire close to the trough of the spindle oscillation (Fig. 8F). In contrast, ChAT+ interneurons fired further along the ascending portion, and their mean phase angle was significantly different from those of PV+ interneurons and MSNs (Fig. 8G). Moreover, the phase-locking of ChAT+ interneurons was comparatively weaker. Indeed, there was an effect of cell type on vector length, with ChAT+ interneurons having significantly smaller vectors than PV+ interneurons and MSNs (Fig. 8H). Cholinergic interneurons, therefore, not only tended to fire at a different phase, but also in a weaker manner, compared with PV+ interneurons and MSNs for both cortical slow and spindle oscillations.
During both SWA and cortical activation, only PV+ interneurons and ChAT+ interneurons showed a clear tendency to fire phase-locked to gamma oscillations at 27–45 Hz (Fig. 9). Notably, none of the NOS+ interneurons and only a few MSNs were significantly locked to gamma oscillations and thus, were not considered further. During SWA, over half of PV+ interneurons and nearly one-third of ChAT+ neurons were significantly locked to gamma oscillations (Fig. 9A). These neuron types tended to fire most around either side of the gamma oscillation troughs (Fig. 9B). There was a significant difference between the mean angle of each population (Fig. 9C), with PV+ interneurons firing on average before the ChAT+ interneurons. Moreover, as shown in plots of vector lengths (Fig. 9D), the phase-locked firing of PV+ interneurons was significantly stronger than that of ChAT+ interneurons. During cortical activation, the firing of approximately one-third of both PV+ and ChAT+ interneurons was significantly phase-locked to gamma oscillations (Fig. 9E). In contrast to our results relating to gamma oscillations in SWA, both types of interneuron fired on or just after the trough of gamma oscillations in the activated brain state, with no significant difference between their mean angles or vector lengths (Fig. 9F–H). The mean angle of PV+ interneuron phase-locking to gamma oscillations was significantly different between SWA and activated states.
In all frequency bands analyzed here (slow oscillations, spindles, gamma), there was no effect of the cell type on the power of the cortical oscillations, suggesting that the distinct phase-locked firing of different neuron types did not arise because of any systematic bias in ECoGs. In summary, striatal neurons showed substantial variation in their propensity to fire action potentials phase-locked to ongoing cortical network oscillations, as well as differences in the strength and angle of this locking. Regardless of the cortical oscillation examined, PV+ interneurons were the most likely to phase lock their activity, and they generally exhibited the strongest degree of temporal coupling. At the other end of the spectrum, NOS+ interneurons exhibited the poorest incidence of phase-locking. Notably, >30% of ChAT+ interneurons were phase locked to cortical spindle and gamma oscillations, despite relatively weak coupling at the level of individual neurons. Thus, identified striatal neurons exhibit cell type-selective differences in the prevalence, strength, and phase of their temporally coupled activities with cortex.
Striatal interneurons and projection neurons respond selectively to electrical stimulation of the motor cortex
The distinct relationships between the firing of identified striatal neurons and spontaneous/driven cortical activities, as well as their disparate temporal coupling to ongoing cortical oscillations, might be accompanied by differences in the way these neurons respond to highly synchronized cortical outputs. To investigate this possibility, we studied the responses of MSNs and the three types of interneuron to brief, single-pulse electrical stimulation of the ipsilateral motor cortex (Fig. 10). We initially focused our analyses on responses (excitations) with short latencies of 1.5–15 ms, which are thought to be the result of the synchronous engagement of striatal neurons by monosynaptic cortical inputs (Mallet et al., 2005). More than half of MSNs and PV+ interneurons, but only a minority of cholinergic interneurons and NOS+ interneurons, responded significantly in this short-latency window (Fig. 10A,B). We also tested for cell type-specific differences in the timing of the first evoked spike and the number of spikes evoked at short latency in each stimulus trial (Fig. 10C,D). Because only two NOS+ interneurons responded at short latency, they could not be included in the statistical analyses. However, their response parameters are still plotted for comparison (Fig. 10C,D). There was a significant effect of cell type on the latency of the first evoked spike (Kruskal–Wallis ANOVA), with PV+ interneurons responding at significantly shorter latencies than both ChAT+ interneurons and MSNs, which were themselves comparatively similar (Dunn's test, Fig. 10C), in line with the hypothesized role of PV+ interneurons in providing feedforward inhibition of MSNs (Kita et al., 1990; Mallet et al., 2005). Also as previously reported (Mallet et al., 2005), PV+ interneurons could respond to individual cortical stimuli with either a single spike or a burst of 2–4 spikes, whereas the other three neuron types predominantly responded with only single spikes. There was a significant effect of cell type on the number of spikes fired per stimulus, with the mean number of spikes per trial being significantly higher for PV+ interneurons than ChAT+ interneurons and MSNs (Fig. 10D). It is noteworthy that the two NOS+ interneurons that responded at short latencies fired single spikes at times that better matched those of PV+ interneurons than those of either ChAT+ interneurons or MSNs, and therefore, may also potentially mediate a feedforward modulation of MSN activity (Fig. 10C–E). In addition to the two NOS+ interneurons that responded at short latencies, three other NOS+ interneurons fired instead at a longer latency of between 20 and 50 ms (Fig. 10Eiii,F). Equivalent analysis of this time window (first spikes at 20–50 ms in >35% of stimulation trials) revealed that no other type of striatal neuron responded to cortical stimulation at these long latencies (Fig. 10G). Some NOS+ interneurons may therefore receive an unusual polysynaptic input following cortical stimulation.
Figure 10.
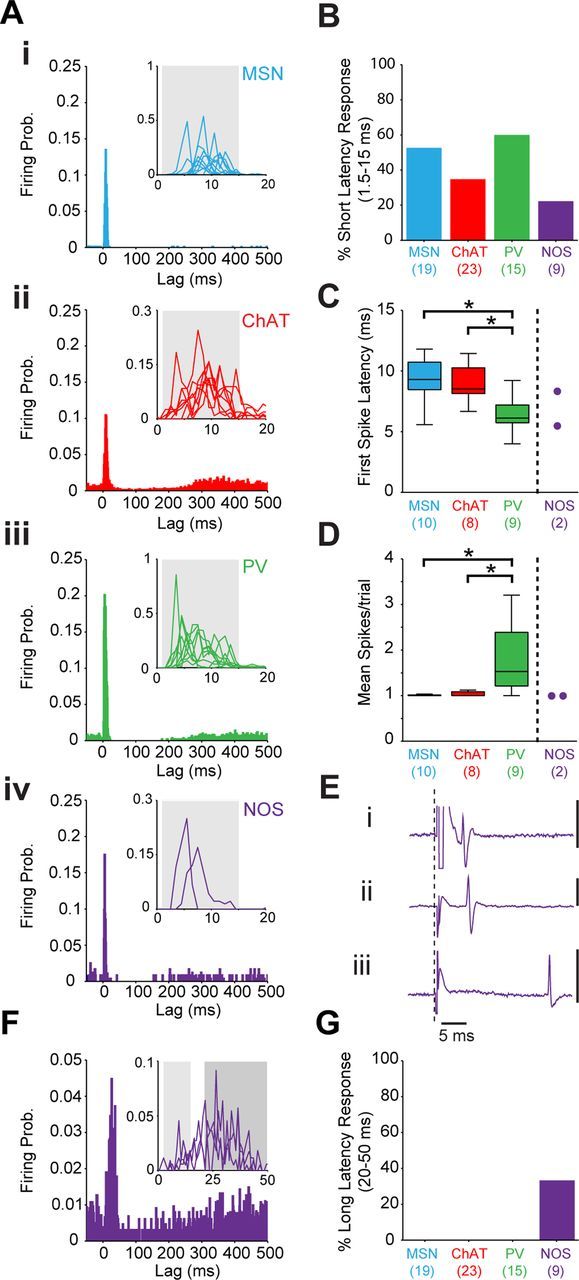
Responses of striatal neurons to electrical stimulation of the motor cortex. A, PSTHs (1 ms bins) of the average responses of the different types of striatal neuron (Ai, MSN; Aii, ChAT+; Aiii, PV+; Aiv, NOS+) to cortical stimulation (single pulses delivered at 0 ms). Insets show the responses of individual neurons (thin lines) during the first 20 ms after stimulation, with gray boxes marking the time window (1.5–15 ms lag) used for analyses of whether the first spike was evoked at short latencies. B, Proportions of each type of neuron that displayed a significant short-latency response. Numbers of neurons tested for responses are shown in parentheses. C, Latencies of the first evoked spikes of all significantly responding neurons (*p < 0.05 for both Kruskal–Wallis ANOVAs and post hoc Dunn's tests). Numbers of responsive neurons are shown in parentheses. On average, PV+ interneurons fired at a significantly shorter latency than ChAT+ interneurons and MSNs. NOS+ interneurons were not included in this statistical analysis because of the small sample of significantly responding interneurons (n = 2), but are shown for comparison. D, Mean number of spikes fired per stimulus trial for neurons responding at short latency. Only PV+ interneurons consistently fired more than one spike in response to cortical stimulation. E, Unit-activity recordings (single representative sweeps of stimulation artifacts and evoked responses, with dashed line indicating stimulation onset) of two NOS+ interneurons that fired at short latencies (∼5 ms; Ei, ii) and another NOS+ interneuron that instead fired at a predefined long latency (20–50 ms; Eiii). F, PSTHs (1 ms bins) of the average responses of the three NOS+ interneurons that fired at long latencies (20–50 ms). Inset shows the responses of these individual neurons (thin lines) during the first 50 ms after stimulation, with the light gray and dark gray boxes marking the time windows used to define responses at short latencies and long latencies, respectively. G, Proportions of each type of neuron that displayed a significant long-latency response. Only NOS+ interneurons responded at long latencies.
In summary, the responses of ChAT+ interneurons, PV+ interneurons, and NOS+ interneurons to highly synchronized cortical outputs are not equivalent, suggesting important differences in the ways each cell type is influenced by corticostriatal afferents as well as the subsequent impact of these interneurons on MSNs.
Discussion
Detailed understanding of striatal interneuron function requires the electrophysiological properties of neurochemically identified cells to be defined in the context of intact afferent network activity. Here, we report the first detailed in vivo characterization of the spontaneous and driven firing of ChAT+, PV+, and NOS+ interneurons, defined according to ongoing cortical network oscillations and recorded/analyzed within a single framework. In demonstrating the specific and shared activity features of each interneuron type, we provide fresh insights into their respective contributions to striatal circuit operations.
Because our experimental strategy required anesthesia (for physical stability) we could not directly investigate neuronal correlates of behavior. The recording of individual neurochemically identified striatal neurons has not yet been achieved during behavior, although this may eventually be possible in alert, head-restrained animals (Isomura et al., 2009). Although intracellular recordings can provide valuable information on the intrinsic properties and synaptic inputs of identified interneurons, such studies have collectively accumulated small fractions of the samples reported here (Wilson et al., 1990; Reynolds and Wickens, 2004; Schulz et al., 2011a,b). Despite the caveats of our strategy, it enabled robust sampling that in turn allowed us to define a wide range of activities according to cell type and brain state, to infer intrinsic properties and inputs, and to re-assess the presumed identities of neurons recorded in awake animals.
Studies of the firing of putatively identified neurons in behaving animals have been critical for elucidating function in striatal microcircuits. In primates, TANs are generally assumed to be cholinergic interneurons (Goldberg and Reynolds, 2011), whereas phasically active neurons (PANs) are assumed to be mostly MSNs (Kimura et al., 1996; Joshua et al., 2008; Deffains et al., 2010). Our recordings shed new light on this classification scheme. During cortical SWA, ChAT+ interneurons and some PV+ and NOS+ interneurons displayed tonic activity (defined as near-continuous firing), with similar firing rates. Identified MSNs, and other PV+ and NOS+ interneurons, were phasically active (firing infrequently). During cortical activation, a brain state that better recapitulates neuronal activity during wakefulness, PV+ interneurons fired tonically at equivalent (albeit more variable) rates to cholinergic interneurons, but with lower regularity. Recorded with glass electrodes, our ChAT+ interneurons did not have the especially broad action potentials of TANs recorded in primates (Goldberg and Reynolds, 2011), but our PV+ interneuron recordings indicate that their characteristically brief spikes should help distinguish them from cholinergic and other interneurons. While both ChAT+ and PV+ interneurons fired significantly faster than MSNs during cortical activation, the firing rates/patterns of NOS+ interneurons were indistinguishable from them. In terms of TAN and PAN categories, NOS+ interneurons are therefore more likely to belong to PANs during alert behavior, despite evidence that many can fire autonomously in a tonic manner in vitro (Partridge et al., 2009; Ibáñez-Sandoval et al., 2011; Beatty et al., 2012), and it may therefore be challenging to distinguish them from MSNs in awake animals.
We provide a first working definition of some fundamental firing properties of identified NOS+ interneurons in vivo. Based on their somatodendritic structure, and coexpression of NPY, these NOS+ interneurons are likely the persistent or plateau LTS cells described in vitro (Kawaguchi, 1993; Centonze et al., 2002; Partridge et al., 2009; Gittis et al., 2010). A population of unidentified striatal neurons in halothane-anesthetized rodents exhibit the classical (thalamic) extracellular signatures of LTS bursts (Sharott et al., 2009), and we now extend this finding to another anesthetic regimen. Importantly though, none of our identified NOS+ interneurons fired such LTS bursts, suggesting these events are not useful for definitively classifying these cells in vivo. In line with this, recordings of NOS+/NPY+ neurons in vitro show that the regular and irregular modes of their autonomous firing are not related to LTS bursts (Beatty et al., 2012). The “LTS units we recorded might instead correspond to a rare type of tyrosine hydroxylase-expressing interneuron described in vitro (Ibáñez-Sandoval et al., 2010).
Although LTS bursts are not signature activities of NOS+ interneurons in vivo, this cell type can be distinguished by its characteristic dependence on brain state. Indeed, NOS+ interneurons were remarkable because they significantly decreased their firing with spontaneous or somatosensory input-driven transitions from SWA to cortical activation. In contrast, PV+ interneurons robustly increased their firing, and ChAT+ interneurons barely changed their activity. Given that NOS+ interneurons can fire in the absence of inputs, their decreased activity is likely underpinned by reduced synaptic excitation and/or increased inhibition during activated brain states. Reduced corticostriatal input is unlikely (Mallet et al., 2005), and our recordings show that MSNs do not increase their firing rates. It is thus tempting to speculate that it is the highly active PV+ interneurons that mediate the low firing rates of NOS+ interneurons, especially because PV+ neurons are known to innervate NOS+ interneurons (Morello et al., 1997). Cholinergic interneurons are likely not responsible because they did not consistently change firing rate/pattern in relation to brain state or in response to somatosensory stimuli. Moreover, the three firing modes of cholinergic interneurons we show here are close approximations of the autonomous regular, irregular, and burst firing seen in vitro (Bennett and Wilson, 1999), suggesting that, in the absence of salient external stimuli, their spontaneous firing in vivo is largely governed by intrinsic membrane properties. These three types of interneuron can therefore be broadly distinguished by their sensitivities to spontaneous and driven changes in brain state.
The role of synchronized network oscillations in basal ganglia functional organization has assumed increasing prominence, partly because they are pathologically altered in Parkinsonism (Costa et al., 2006; Eusebio et al., 2009), but also because of their task-related modulation in healthy animals (DeCoteau et al., 2007; Leventhal et al., 2012). Basal ganglia network oscillations are likely to be highly dependent on synchronized cortical and thalamic inputs for which the striatum is a key entry point into the basal ganglia. With this in mind, we quantified the manner in which these identified striatal interneurons fired action potentials in time with ongoing cortical oscillations, and found cell type-selective differences in the prevalence, strength, and phase of their temporally coupled activities. Regardless of the cortical oscillation examined, PV+ interneurons were most likely to phase lock their activity, and they generally exhibited the strongest degree of temporal coupling. In line with this, PV+ interneurons had the most robust responses to cortical stimulation. Many studies have already pointed to a prominent role for these interneurons in striatal oscillations. Indeed, striatal FSIs lock their firing to spindles and gamma oscillations (Berke et al., 2004; Berke, 2009; Sharott et al., 2009; van der Meer and Redish, 2009) and FSI pairs can rhythmically synchronize their firing at these frequencies (Sharott et al., 2009). Moreover, intracellular recordings have demonstrated gamma oscillations in the membrane potentials of these interneurons, which are likely to result from convergent synaptic inputs and intrinsic resonance (Schulz et al., 2011b; Sciamanna et al., 2011). Approximately one-third of ChAT+ interneurons fired phase-locked to cortical spindle and gamma oscillations. Given their powerful intrinsic firing mechanisms, this is perhaps surprising but, nevertheless, suggests their firing can be subtly influenced by the rhythmic activities of afferent networks. Anatomical evidence suggests that such entrainment is more likely to be mediated by thalamic than cortical afferents (Lapper and Bolam, 1992). Indeed, the differences in their preferred angles of phase locking as compared with those of the more “cortically dominated” PV+ interneurons could be taken as supportive physiological evidence. However, the short-latency responses of some ChAT+ interneurons to cortical stimulation indicates that there are stronger functional connections between cortex and cholinergic interneurons than those suggested by anatomical data (Reynolds and Wickens, 2004; Ding et al., 2010). Notably, NOS+ interneurons exhibited relatively poor phase locking to cortical oscillations. Thus, although cortex innervates NOS+ interneurons (Vuillet et al., 1989; Sammut et al., 2007), the impact of such inputs on their firing might be relatively small (Gittis et al., 2010). Given the weak GABAergic connections of NOS+ interneurons with MSNs, it has been proposed that they predominantly modulate MSN activity by nitric oxide and/or neuropeptide release (Gittis et al., 2010; Ibáñez-Sandoval et al., 2011), rather than providing the fast, feedforward inhibition commonly ascribed to PV+ interneurons. Moreover, the responses of some NOS+ interneurons to cortical activation that we observed may actually mediate feedforward excitation (Ondracek et al., 2008). The different relationships of these two GABAergic interneuron types to cortical state changes, oscillations, and inputs provides further evidence that they play diverse, possibly opposing, roles in orchestrating information flow in striatal microcircuits.
Despite many recordings of striatal neurons in different experimental preparations, the precise computation performed by striatal circuits remains unclear (Nambu, 2008). Functionally diverse inputs to different striatal territories suggest that this computation is unlikely linked to a specific behavior, but rather, to a specific operation performed by fundamental circuit components that exist in all striatal areas. The temporal activity signatures of different interneuron types, the diverse nature of their responses to afferent inputs, and their participation in network activities that we elucidate here are all likely important for such computation, and can aid the definition of their respective, specialized contributions to circuit function.
Footnotes
This work was supported by the Medical Research Council UK (Award U138197109), Parkinson's UK (Grant number G-0806) and a Marie Curie European Re-integration Grant (SNAP-PD) awarded by the European Union. We are grateful to Drs. P.D. Dodson, K.C. Nakamura, T.C. Bienvenu, and J.P. Bolam for valuable scientific discussions. We also thank B. Micklem, E. Norman, C. Johnson, and G. Hazell for expert technical assistance.
References
- Beatty JA, Sullivan MA, Morikawa H, Wilson CJ. Complex autonomous firing patterns of striatal low-threshold spike interneurons. J Neurophysiol. 2012;108:771–781. doi: 10.1152/jn.00283.2012. [DOI] [PMC free article] [PubMed] [Google Scholar]
- Bennett BD, Wilson CJ. Spontaneous activity of neostriatal cholinergic interneurons in vitro. J Neurosci. 1999;19:5586–5596. doi: 10.1523/JNEUROSCI.19-13-05586.1999. [DOI] [PMC free article] [PubMed] [Google Scholar]
- Berens P. CircStat: A MATLAB Toolbox for Circular Statistics. J Statistical Software. 2009;31:1–21. [Google Scholar]
- Berke JD. Functional properties of striatal fast-spiking interneurons. Front Syst Neurosci. 2011;5:45. doi: 10.3389/fnsys.2011.00045. [DOI] [PMC free article] [PubMed] [Google Scholar]
- Berke JD. Fast oscillations in cortical-striatal networks switch frequency following rewarding events and stimulant drugs. Eur J Neurosci. 2009;30:848–859. doi: 10.1111/j.1460-9568.2009.06843.x. [DOI] [PMC free article] [PubMed] [Google Scholar]
- Berke JD, Okatan M, Skurski J, Eichenbaum HB. Oscillatory entrainment of striatal neurons in freely moving rats. Neuron. 2004;43:883–896. doi: 10.1016/j.neuron.2004.08.035. [DOI] [PubMed] [Google Scholar]
- Centonze D, Bracci E, Pisani A, Gubellini P, Bernardi G, Calabresi P. Activation of dopamine D1-like receptors excites LTS interneurons of the striatum. Eur J Neurosci. 2002;15:2049–2052. doi: 10.1046/j.1460-9568.2002.02052.x. [DOI] [PubMed] [Google Scholar]
- Costa RM, Lin SC, Sotnikova TD, Cyr M, Gainetdinov RR, Caron MG, Nicolelis MA. Rapid alterations in corticostriatal ensemble coordination during acute dopamine-dependent motor dysfunction. Neuron. 2006;52:359–369. doi: 10.1016/j.neuron.2006.07.030. [DOI] [PubMed] [Google Scholar]
- DeCoteau WE, Thorn C, Gibson DJ, Courtemanche R, Mitra P, Kubota Y, Graybiel AM. Learning-related coordination of striatal and hippocampal theta rhythms during acquisition of a procedural maze task. Proc Natl Acad Sci U S A. 2007;104:5644–5649. doi: 10.1073/pnas.0700818104. [DOI] [PMC free article] [PubMed] [Google Scholar]
- Deffains M, Legallet E, Apicella P. Modulation of neuronal activity in the monkey putamen associated with changes in the habitual order of sequential movements. J Neurophysiol. 2010;104:1355–1369. doi: 10.1152/jn.00355.2010. [DOI] [PubMed] [Google Scholar]
- Ding JB, Guzman JN, Peterson JD, Goldberg JA, Surmeier DJ. Thalamic gating of corticostriatal signaling by cholinergic interneurons. Neuron. 2010;67:294–307. doi: 10.1016/j.neuron.2010.06.017. [DOI] [PMC free article] [PubMed] [Google Scholar]
- Domich L, Oakson G, Steriade M. Thalamic burst patterns in the naturally sleeping cat: a comparison between cortically projecting and reticularis neurones. J Physiol. 1986;379:429–449. doi: 10.1113/jphysiol.1986.sp016262. [DOI] [PMC free article] [PubMed] [Google Scholar]
- Eusebio A, Pogosyan A, Wang S, Averbeck B, Gaynor LD, Cantiniaux S, Witjas T, Limousin P, Azulay JP, Brown P. Resonance in subthalamo-cortical circuits in Parkinson's disease. Brain. 2009;132:2139–2150. doi: 10.1093/brain/awp079. [DOI] [PMC free article] [PubMed] [Google Scholar]
- Fanselow EE, Sameshima K, Baccala LA, Nicolelis MA. Thalamic bursting in rats during different awake behavioral states. Proc Natl Acad Sci U S A. 2001;98:15330–15335. doi: 10.1073/pnas.261273898. [DOI] [PMC free article] [PubMed] [Google Scholar]
- Figueredo-Cardenas G, Morello M, Sancesario G, Bernardi G, Reiner A. Colocalization of somatostatin, neuropeptide Y, neuronal nitric oxide synthase and NADPH-diaphorase in striatal interneurons in rats. Brain Res. 1996;735:317–324. doi: 10.1016/0006-8993(96)00801-3. [DOI] [PubMed] [Google Scholar]
- Gittis AH, Nelson AB, Thwin MT, Palop JJ, Kreitzer AC. Distinct roles of GABAergic interneurons in the regulation of striatal output pathways. J Neurosci. 2010;30:2223–2234. doi: 10.1523/JNEUROSCI.4870-09.2010. [DOI] [PMC free article] [PubMed] [Google Scholar]
- Goldberg JA, Reynolds JN. Spontaneous firing and evoked pauses in the tonically active cholinergic interneurons of the striatum. Neuroscience. 2011;198:27–43. doi: 10.1016/j.neuroscience.2011.08.067. [DOI] [PubMed] [Google Scholar]
- Hasenstaub A, Shu Y, Haider B, Kraushaar U, Duque A, McCormick DA. Inhibitory postsynaptic potentials carry synchronized frequency information in active cortical networks. Neuron. 2005;47:423–435. doi: 10.1016/j.neuron.2005.06.016. [DOI] [PubMed] [Google Scholar]
- Holt GR, Softky WR, Koch C, Douglas RJ. Comparison of discharge variability in vitro and in vivo in cat visual cortex neurons. J Neurophysiol. 1996;75:1806–1814. doi: 10.1152/jn.1996.75.5.1806. [DOI] [PubMed] [Google Scholar]
- Ibáñez-Sandoval O, Tecuapetla F, Unal B, Shah F, Koós T, Tepper JM. Electrophysiological and morphological characteristics and synaptic connectivity of tyrosine hydroxylase-expressing neurons in adult mouse striatum. J Neurosci. 2010;30:6999–7016. doi: 10.1523/JNEUROSCI.5996-09.2010. [DOI] [PMC free article] [PubMed] [Google Scholar]
- Ibáñez-Sandoval O, Tecuapetla F, Unal B, Shah F, Koós T, Tepper JM. A novel functionally distinct subtype of striatal neuropeptide Y interneuron. J Neurosci. 2011;31:16757–16769. doi: 10.1523/JNEUROSCI.2628-11.2011. [DOI] [PMC free article] [PubMed] [Google Scholar]
- Inokawa H, Yamada H, Matsumoto N, Muranishi M, Kimura M. Juxtacellular labeling of tonically active neurons and phasically active neurons in the rat striatum. Neuroscience. 2010;168:395–404. doi: 10.1016/j.neuroscience.2010.03.062. [DOI] [PubMed] [Google Scholar]
- Isomura Y, Harukuni R, Takekawa T, Aizawa H, Fukai T. Microcircuitry coordination of cortical motor information in self-initiation of voluntary movements. Nat Neurosci. 2009;12:1586–1593. doi: 10.1038/nn.2431. [DOI] [PubMed] [Google Scholar]
- Jeanmonod D, Magnin M, Morel A. Low-threshold calcium spike bursts in the human thalamus. Common physiopathology for sensory, motor and limbic positive symptoms. Brain. 1996;119:363–375. doi: 10.1093/brain/119.2.363. [DOI] [PubMed] [Google Scholar]
- Joshua M, Adler A, Mitelman R, Vaadia E, Bergman H. Midbrain dopaminergic neurons and striatal cholinergic interneurons encode the difference between reward and aversive events at different epochs of probabilistic classical conditioning trials. J Neurosci. 2008;28:11673–11684. doi: 10.1523/JNEUROSCI.3839-08.2008. [DOI] [PMC free article] [PubMed] [Google Scholar]
- Kawaguchi Y. Physiological, morphological, and histochemical characterization of three classes of interneurons in rat neostriatum. J Neurosci. 1993;13:4908–4923. doi: 10.1523/JNEUROSCI.13-11-04908.1993. [DOI] [PMC free article] [PubMed] [Google Scholar]
- Kimura M, Rajkowski J, Evarts E. Tonically discharging putamen neurons exhibit set-dependent responses. Proc Natl Acad Sci U S A. 1984;81:4998–5001. doi: 10.1073/pnas.81.15.4998. [DOI] [PMC free article] [PubMed] [Google Scholar]
- Kimura M, Kato M, Shimazaki H, Watanabe K, Matsumoto N. Neural information transferred from the putamen to the globus pallidus during learned movement in the monkey. J Neurophysiol. 1996;76:3771–3786. doi: 10.1152/jn.1996.76.6.3771. [DOI] [PubMed] [Google Scholar]
- Kita H, Kosaka T, Heizmann CW. Parvalbumin-immunoreactive neurons in the rat neostriatum: a light and electron microscopic study. Brain Res. 1990;536:1–15. doi: 10.1016/0006-8993(90)90002-s. [DOI] [PubMed] [Google Scholar]
- Kolomiets BP, Deniau JM, Glowinski J, Thierry AM. Basal ganglia and processing of cortical information: functional interactions between trans-striatal and trans-subthalamic circuits in the substantia nigra pars reticulata. Neuroscience. 2003;117:931–938. doi: 10.1016/s0306-4522(02)00824-2. [DOI] [PubMed] [Google Scholar]
- Koós T, Tepper JM. Inhibitory control of neostriatal projection neurons by GABAergic interneurons. Nat Neurosci. 1999;2:467–472. doi: 10.1038/8138. [DOI] [PubMed] [Google Scholar]
- Kubota Y, Mikawa S, Kawaguchi Y. Neostriatal GABAergic interneurones contain NOS, calretinin or parvalbumin. Neuroreport. 1993;5:205–208. doi: 10.1097/00001756-199312000-00004. [DOI] [PubMed] [Google Scholar]
- Lacey CJ, Bolam JP, Magill PJ. Novel and distinct operational principles of intralaminar thalamic neurons and their striatal projections. J Neurosci. 2007;27:4374–4384. doi: 10.1523/JNEUROSCI.5519-06.2007. [DOI] [PMC free article] [PubMed] [Google Scholar]
- Lachaux JP, Rodriguez E, Martinerie J, Varela FJ. Measuring phase synchrony in brain signals. Hum Brain Mapp. 1999;8:194–208. doi: 10.1002/(SICI)1097-0193(1999)8:4<194::AID-HBM4>3.0.CO;2-C. [DOI] [PMC free article] [PubMed] [Google Scholar]
- Lapper SR, Bolam JP. Input from the frontal cortex and the parafascicular nucleus to cholinergic interneurons in the dorsal striatum of the rat. Neuroscience. 1992;51:533–545. doi: 10.1016/0306-4522(92)90293-b. [DOI] [PubMed] [Google Scholar]
- Leventhal DK, Gage GJ, Schmidt R, Pettibone JR, Case AC, Berke JD. Basal ganglia beta oscillations accompany cue utilization. Neuron. 2012;73:523–536. doi: 10.1016/j.neuron.2011.11.032. [DOI] [PMC free article] [PubMed] [Google Scholar]
- Lu SM, Guido W, Sherman SM. Effects of membrane voltage on receptive field properties of lateral geniculate neurons in the cat: contributions of the low-threshold Ca2+ conductance. J Neurophysiol. 1992;68:2185–2198. doi: 10.1152/jn.1992.68.6.2185. [DOI] [PubMed] [Google Scholar]
- Magill PJ, Bolam JP, Bevan MD. Relationship of activity in the subthalamic nucleus-globus pallidus network to cortical electroencephalogram. J Neurosci. 2000;20:820–833. doi: 10.1523/JNEUROSCI.20-02-00820.2000. [DOI] [PMC free article] [PubMed] [Google Scholar]
- Magill PJ, Sharott A, Bolam JP, Brown P. Brain state-dependency of coherent oscillatory activity in the cerebral cortex and basal ganglia of the rat. J Neurophysiol. 2004a;92:2122–2136. doi: 10.1152/jn.00333.2004. [DOI] [PubMed] [Google Scholar]
- Magill PJ, Sharott A, Bevan MD, Brown P, Bolam JP. Synchronous unit activity and local field potentials evoked in the subthalamic nucleus by cortical stimulation. J Neurophysiol. 2004b;92:700–714. doi: 10.1152/jn.00134.2004. [DOI] [PubMed] [Google Scholar]
- Magill PJ, Pogosyan A, Sharott A, Csicsvari J, Bolam JP, Brown P. Changes in functional connectivity within the rat striatopallidal axis during global brain activation in vivo. J Neurosci. 2006;26:6318–6329. doi: 10.1523/JNEUROSCI.0620-06.2006. [DOI] [PMC free article] [PubMed] [Google Scholar]
- Mallet N, Le Moine C, Charpier S, Gonon F. Feedforward inhibition of projection neurons by fast-spiking GABA interneurons in the rat striatum in vivo. J Neurosci. 2005;25:3857–3869. doi: 10.1523/JNEUROSCI.5027-04.2005. [DOI] [PMC free article] [PubMed] [Google Scholar]
- Mallet N, Pogosyan A, Márton LF, Bolam JP, Brown P, Magill PJ. Parkinsonian beta oscillations in the external globus pallidus and their relationship with subthalamic nucleus activity. J Neurosci. 2008;28:14245–14258. doi: 10.1523/JNEUROSCI.4199-08.2008. [DOI] [PMC free article] [PubMed] [Google Scholar]
- Mallet N, Micklem BR, Henny P, Brown MT, Williams C, Bolam JP, Nakamura KC, Magill PJ. Dichotomous organization of the external globus pallidus. Neuron. 2012;74:1075–1086. doi: 10.1016/j.neuron.2012.04.027. [DOI] [PMC free article] [PubMed] [Google Scholar]
- Morello M, Reiner A, Sancesario G, Karle EJ, Bernardi G. Ultrastructural study of nitric oxide synthase-containing striatal neurons and their relationship with parvalbumin-containing neurons in rats. Brain Res. 1997;776:30–39. doi: 10.1016/s0006-8993(97)00997-9. [DOI] [PubMed] [Google Scholar]
- Morris G, Arkadir D, Nevet A, Vaadia E, Bergman H. Coincident but distinct messages of midbrain dopamine and striatal tonically active neurons. Neuron. 2004;43:133–143. doi: 10.1016/j.neuron.2004.06.012. [DOI] [PubMed] [Google Scholar]
- Nambu A. Seven problems on the basal ganglia. Curr Opin Neurobiol. 2008;18:595–604. doi: 10.1016/j.conb.2008.11.001. [DOI] [PubMed] [Google Scholar]
- Ondracek JM, Dec A, Hoque KE, Lim SA, Rasouli G, Indorkar RP, Linardakis J, Klika B, Mukherji SJ, Burnazi M, Threlfell S, Sammut S, West AR. Feed-forward excitation of striatal neuron activity by frontal cortical activation of nitric oxide signaling in vivo. Eur J Neurosci. 2008;27:1739–1754. doi: 10.1111/j.1460-9568.2008.06157.x. [DOI] [PubMed] [Google Scholar]
- Paladini CA, Tepper JM. GABA(A) and GABA(B) antagonists differentially affect the firing pattern of substantia nigra dopaminergic neurons in vivo. Synapse. 1999;32:165–176. doi: 10.1002/(SICI)1098-2396(19990601)32:3<165::AID-SYN3>3.0.CO;2-N. [DOI] [PubMed] [Google Scholar]
- Partridge JG, Janssen MJ, Chou DY, Abe K, Zukowska Z, Vicini S. Excitatory and inhibitory synapses in neuropeptide Y-expressing striatal interneurons. J Neurophysiol. 2009;102:3038–3045. doi: 10.1152/jn.00272.2009. [DOI] [PMC free article] [PubMed] [Google Scholar]
- Paxinos G, Watson C. The rat brain in stereotaxic coordinates. Ed 2. Sydney: Academic Press; 1986. [DOI] [PubMed] [Google Scholar]
- Ramanathan S, Hanley JJ, Deniau JM, Bolam JP. Synaptic convergence of motor and somatosensory cortical afferents onto GABAergic Interneurons in the rat striatum. J Neurosci. 2002;22:8158–8169. doi: 10.1523/JNEUROSCI.22-18-08158.2002. [DOI] [PMC free article] [PubMed] [Google Scholar]
- Reynolds JN, Wickens JR. The corticostriatal input to giant aspiny interneurons in the rat: a candidate pathway for synchronising the response to reward-related cues. Brain Res. 2004;1011:115–128. doi: 10.1016/j.brainres.2004.03.026. [DOI] [PubMed] [Google Scholar]
- Saleem AB, Chadderton P, Apergis-Schoute J, Harris KD, Schultz SR. Methods for predicting cortical UP and DOWN states from the phase of deep layer local field potentials. J Comput Neurosci. 2010;29:49–62. doi: 10.1007/s10827-010-0228-5. [DOI] [PMC free article] [PubMed] [Google Scholar]
- Sammut S, Park DJ, West AR. Frontal cortical afferents facilitate striatal nitric oxide transmission in vivo via a NMDA receptor and neuronal NOS-dependent mechanism. J Neurochem. 2007;103:1145–1156. doi: 10.1111/j.1471-4159.2007.04811.x. [DOI] [PubMed] [Google Scholar]
- Sammut S, Threlfell S, West AR. Nitric oxide-soluble guanylyl cyclase signaling regulates corticostriatal transmission and short-term synaptic plasticity of striatal projection neurons recorded in vivo. Neuropharmacology. 2010;58:624–631. doi: 10.1016/j.neuropharm.2009.11.011. [DOI] [PMC free article] [PubMed] [Google Scholar]
- Schulz JM, Oswald MJ, Reynolds JN. Visual-induced excitation leads to firing pauses in striatal cholinergic interneurons. J Neurosci. 2011a;31:11133–11143. doi: 10.1523/JNEUROSCI.0661-11.2011. [DOI] [PMC free article] [PubMed] [Google Scholar]
- Schulz JM, Pitcher TL, Savanthrapadian S, Wickens JR, Oswald MJ, Reynolds JN. Enhanced high-frequency membrane potential fluctuations control spike output in striatal fast-spiking interneurones in vivo. J Physiol. 2011b;589:4365–4381. doi: 10.1113/jphysiol.2011.212944. [DOI] [PMC free article] [PubMed] [Google Scholar]
- Sciamanna G, Tassone A, Martella G, Mandolesi G, Puglisi F, Cuomo D, Madeo G, Ponterio G, Standaert DG, Bonsi P, Pisani A. Developmental profile of the aberrant dopamine D2 receptor response in striatal cholinergic interneurons in DYT1 dystonia. PLoS One. 2011;6:e24261. doi: 10.1371/journal.pone.0024261. [DOI] [PMC free article] [PubMed] [Google Scholar]
- Sharott A, Magill PJ, Bolam JP, Brown P. Directional analysis of coherent oscillatory field potentials in the cerebral cortex and basal ganglia of the rat. J Physiol. 2005;562:951–963. doi: 10.1113/jphysiol.2004.073189. [DOI] [PMC free article] [PubMed] [Google Scholar]
- Sharott A, Moll CK, Engler G, Denker M, Grün S, Engel AK. Different subtypes of striatal neurons are selectively modulated by cortical oscillations. J Neurosci. 2009;29:4571–4585. doi: 10.1523/JNEUROSCI.5097-08.2009. [DOI] [PMC free article] [PubMed] [Google Scholar]
- Steriade M. Corticothalamic resonance, states of vigilance and mentation. Neuroscience. 2000;101:243–276. doi: 10.1016/s0306-4522(00)00353-5. [DOI] [PubMed] [Google Scholar]
- Stern EA, Kincaid AE, Wilson CJ. Spontaneous subthreshold membrane potential fluctuations and action potential variability of rat corticostriatal and striatal neurons in vivo. J Neurophysiol. 1997;77:1697–1715. doi: 10.1152/jn.1997.77.4.1697. [DOI] [PubMed] [Google Scholar]
- Tepper JM, Bolam JP. Functional diversity and specificity of neostriatal interneurons. Curr Opin Neurobiol. 2004;14:685–692. doi: 10.1016/j.conb.2004.10.003. [DOI] [PubMed] [Google Scholar]
- Tepper JM, Tecuapetla F, Koós T, Ibáñez-Sandoval O. Heterogeneity and diversity of striatal GABAergic interneurons. Front Neuroanat. 2010;4:150. doi: 10.3389/fnana.2010.00150. [DOI] [PMC free article] [PubMed] [Google Scholar]
- van der Meer MA, Redish AD. Low and high gamma oscillations in rat ventral striatum have distinct relationships to behavior, reward, and spiking activity on a learned spatial decision task. Front Integr Neurosci. 2009;3:9. doi: 10.3389/neuro.07.009.2009. [DOI] [PMC free article] [PubMed] [Google Scholar]
- Vuillet J, Kerkerian L, Salin P, Nieoullon A. Ultrastructural features of NPY-containing neurons in the rat striatum. 1989;477:241–251. doi: 10.1016/0006-8993(89)91412-1. [DOI] [PubMed] [Google Scholar]
- Wilson CJ, Chang HT, Kitai ST. Firing patterns and synaptic potentials of identified giant aspiny interneurons in the rat neostriatum. J Neurosci. 1990;10:508–519. doi: 10.1523/JNEUROSCI.10-02-00508.1990. [DOI] [PMC free article] [PubMed] [Google Scholar]