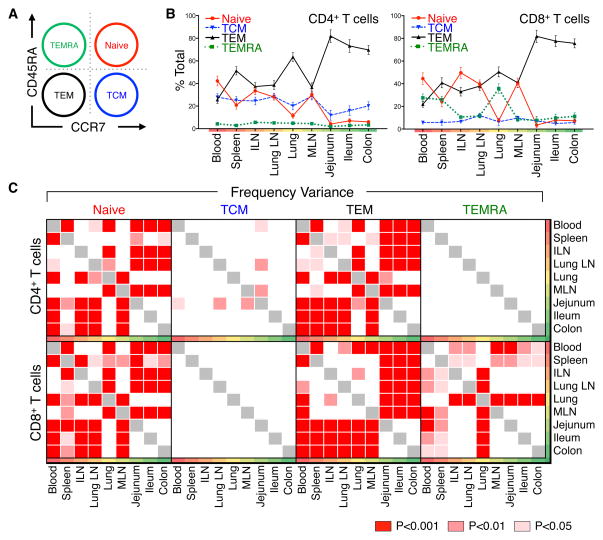
Figure 2. Tissue Distribution of naïve, memory and terminal effector subsets remains consistent between diverse donors.
Frequency of lymphocytes in 9 tissue sites isolated from organ donors was quantified by flow cytometry. (A) Gating strategy used to identify T cell subsets (CD3+ CD19−CD4+ or CD3+ CD19−CD8+ cells) based on CD45RA and CCR7 expression defining: CD45RA+/CCR7+ (Naïve, red), CD45RA−/CCR7+ (“Central Memory” or TCM, blue), CD45RA−/CCR7− (“effector-memory”, TEM, black), and CD45RA+/CCR7− (“Terminal effector” or TEMRA, green). Colors and abbreviations are used consistently throughout. (B) Mean frequency (±SEM) of each subset expressed as a percent of total CD4+ (left) and CD8+ (right) T cells in circulation, spleen, lymphoid tissue and mucosal sites (ordered from blood, red; to mucosal sites, green). Individual means and additional descriptive statistics are listed in Table S3. (C) Distribution variance between CD4+ and CD8+ T cell subset frequencies in 31 donors (Table S2) was assessed for each tissue by two-way ANOVA and adjusted for multiple comparisons by a Holm-Sidak correction. Significant frequency variances between tissue pairs are expressed as p-values with red- and pink-shaded boxes indicating significant differences (p<0.001, red; p<0.01, light red; p<0.05, pink) and white boxes indicating no significant difference in subset frequency between anatomic sites. Individual p-values are listed in Table S4.

