Abstract
Objective:
The aim of this study was to evaluate combined two-dimensional (2D) and three-dimensional (3D) dynamic MR urography with respiratory compensation in children with anomalies of the genitourinary tract, allowing for computation of split renal function and assessment of urinary tract obstruction.
Methods:
Dynamic MR urography was performed in 53 children (3 months–16 years of age) with anomalies of the urinary tract. A protocol for dynamic MR urography and nephrography was implemented at 1.5 T using a navigator-triggered 2D TurboFLASH sequence. Split renal function and contrast-medium excretion were assessed after the bolus injection of 0.05 mmol kg−1 body weight of gadolinium dimeglumine. In the excretory phase, a 3D gradient-echo data set with high spatial resolution was acquired. In all patients, mercaptoacetyltriglycine (MAG3) scintigraphy was obtained as a reference standard.
Results:
In all children, dynamic MR nephrography and urography could be performed with excellent compensation of breathing artefacts providing region of interest analysis in nearly identical kidney positions. The assessment of contrast-medium excretion into the ureter allowed for discrimination of functional from non-functional stenosis. Split renal function assessed by MRI showed an excellent agreement with the MAG3 reference standard with a correlation coefficient r = 0.95. Additionally recorded 3D data sets offered good depiction of anatomical anomalies in all patients.
Conclusion:
The proposed protocol provides a robust technique for assessment of ureteral obstruction and split renal function with compensation of breathing artefacts, short post-processing time and excellent 3D spatial resolution.
Advances in knowledge:
The combined protocol of 2D and 3D MR urography is an efficient technique for assessment of renal morphology and function.
Obstructive uropathy is a congenital disease caused by faulty embryological development of the kidneys and ureters.1,2 Patients show a dilatation of the renal pelvis combined with stenosis of the ureteropelvic junction, the ureterovesical junction or the subvesical urinary tract. This disease pattern is often referred to as CAKUT (“congenital anomalies of the kidney and the urinary tract”). In the majority of cases, histological alterations of the ipsilateral renal parenchyma as well as reduced renal function can be found, which are based on malformation of the renal parenchyma during embryonic development, and further aggravated dependent on the degree of obstruction. Owing to the varying contribution of these two effects, it is difficult to anticipate the individual future development regarding kidney function. It is often challenging to decide which patient may benefit from surgical treatment.
In this context, dilatation of the renal collecting system and the ureter is not necessarily paralleled by persistent renal obstruction. Dysplastic embryological development or vesicoureteral reflux can be a cause for widening of the renal collecting system or the ureter as well. Approximately 1 out of 500 children is affected by CAKUT. Stenosis of the ureteropelvic junction is the most common cause of a dilation of the renal pelvis in newborns; less frequently, the stenosis is located at the ureterovesical junction.
In past years, MR urography (MRU) has emerged as a powerful modality for the assessment of paediatric obstructive nephropathy offering highly resolved morphological as well as functional information of the kidneys and the urinary tract. Advantages of MRI over CT are, amongst others, the intrinsically high soft-tissue contrast, the multiplanar imaging capabilities and the complete lack of radiation exposure. Moreover, dynamic MR urography3–7 offers the possibility to assess urinary transport as well as the computation of split renal function, similar to established techniques applying radionuclide scintigraphy.
The currently published studies applied conventional gradient-echo sequences with two-dimensional (2D) or three-dimensional (3D) phase-encoding schemes and standard or reduced dosage of gadolinium-based contrast media.3–7 One disadvantage of these conventional gradient-echo sequences regarding applications in young children is, however, the relatively long acquisition time of approximately 5–15 s resulting in breathing artefacts. In this study, we evaluate a protocol applying a single-shot TurboFLASH sequence with an acquisition time of only 0.5 s, which can be combined with a navigator-triggering technique providing images at virtually identical diaphragm positions.
The aim of our study was to evaluate combined 2D and 3D dynamic MR urography with respiratory compensation in children with anomalies of the genitourinary tract, allowing for computation of split renal function and assessment of urinary tract obstruction in comparison with a MAG3 reference standard, to demonstrate that the proposed protocol provides functional information comparable with mercaptoacetyltriglycine (MAG3) scintigraphy with additional anatomical 3D information, and to report our experiences in 53 included patients.
METHODS AND MATERIALS
Patients
53 children aged between 3 months and 15 years (mean age, 4.3 ± 4.8 years) with renal dysfunction and/or urinary obstruction were admitted from the Department of Pediatric Surgery and Pediatric Urology for clinically indicated contrast-enhanced MR urography after having undergone an ultrasound examination, voiding cystourethrogram and renal scintigraphy within 2 weeks before or after the MR examination. All paediatric patients within a time period of 5 years were included in this retrospective analysis. Exclusion criteria were missing MAG3 scintigraphy or more than 2-week time distance between MAG3 scintigraphy and MR urography. The diagnoses were (multiple diagnoses possible): ureteropelvic junction obstruction (n = 14), primary megaureter (n = 2), follow-up after pyeloplasty or ureteroplasty (n = 3), ureteropelvic duplication (n = 23), ureteropelvic triplication (n = 1), atrophic kidney owing to reflux (n = 1), polycystic kidney disease (n = 1), large renal cyst (n = 1), ectopic ureter (n = 2), crossed ectopia of the kidney (n = 1), horseshoe kidney (n = 1), secondary hydronephrosis owing to acute appendicitis, post-operative obstruction after neuroblastoma (n = 1) and renal insufficiency (n = 1).
Diuresis MAG3 scintigraphy
In the diuresis MAG3 scintigraphy, split renal function was calculated from the area under the curve of the count rate starting after tracer application to the peak. Relevant ureteral obstruction was diagnosed if the count rate of the collecting system did not decline to <50% of the peak after 30 min.
MRI technique
In children aged 5 years or younger, intravenous sedation was performed using propofol as a continuous infusion with a dosage of 50 µg kg−1 min−1 or general anaesthesia. Oxygen saturation and pulse rate were monitored by an MR-compatible pulse oximeter. Bladder catheterization was avoided during the MR examination to decrease invasiveness. Parents of all participating children gave informed consent for the MR examination. The ethics commitee of the University Hospital Tübingen approved this Health Insurance Portability and Accountability Act (HIPAA)-compliant retrospective study and waived the need for patient-informed consent.
MR system
MR measurements were performed on two different MR scanners (Avanto and Sonata; Siemens Healthcare, Erlangen, Germany) operating at 1.5 T. The gradient systems of both scanners work with a maximum gradient strength of 45 mT m−1 and a slew rate of 200 T m−1 s−1 in all three orthogonal directions. RF transmission was carried out with the body transmitter. Patients were examined in supine position during the whole MRI examination, and a flexible body coil and the spine coil from the manufacturer were applied for signal reception. Children younger than 1 year were examined in the head coil.
Measurement protocol and sequences
The MRI protocol was adapted from a previously described technique of MR urography8(initial clinical results from a small cohort were reported in German language9). A fluid load of 15 ml kg−1 body weight of 0.9% normal saline solution was intravenously administered starting half an hour before the MR examination in order to increase urinary excretion. Furthermore, 20 min before the start of the MR examination, 0.3 mg kg−1 body weight of furosemide (Lasix®; Aventis Pharma, Bad Soden, Germany) was injected intravenously.
The MR protocol consisted a T1 weighted gradient-echo localizer, a T1 weighted 2D spin-echo sequence in axial orientation [repetition time (TR)/echo time (TE), 507/8 ms; bandwidth, 250 Hz per pixel; slice thickness, 4 mm; matrix size, 384 × 288 pixels; four averages] and a T2 weighted half-Fourier single-shot 2D fast spin-echo sequence (TR/TE, 1110/118 ms; radiofrequency bandwidth, 490 Hz; slice thickness, 5 mm; fast spin-echo factor, 77) in all three orientations providing anatomical orientation of the kidneys and ureters. A slightly angulated coronal 3D 1-mm isotropic navigator-gated fast spin-echo sequence with variable flip angle refocusing and long echo time was applied for static urography of the urinary tract (TR/TE, 3688/699 ms; flip angle, 140°; bandwidth, 326 Hz per pixel; 2 averages; fast spin-echo factor, 121; slice fast spin-echo factor, 2; matrix size, 320 × 320 pixels; slices per slab, 64; slice partial Fourier, 7/8, parallel imaging generalized autocalibrating partially parallel acquisition factor, 3; acquisition time, 3 min 52 s).
Dynamic nephrography and urography were carried out with a navigator-gated 2D single-slice TurboFLASH sequence with a non-selective saturation pre-pulse (TR/TE, 3.89/1.25 ms; saturation recovery time TI, 300 ms; flip angle, 8°; bandwidth, 500 Hz per pixel; matrix size, 128 × 128 pixels; in-plane resolution, 2.2 × 2.2 mm) allowing image acquisition every 4–5 s during continuous breathing with an acquisition time of 0.5 s. The image plane with 10–20 mm slice thickness was slightly angulated and positioned according to the longest extension of the kidneys. After 20 non-enhanced images, a bolus injection of 0.05 mmol of gadopentetic acid (Gd-DTPA) per kilogram body weight (Magnevist®; Schering, Berlin, Germany) was administered at 2 ml s−1 injection rate, followed by 20 ml of 0.9% saline solution. Image recording was continued for another 40 min. 20 min after administration of the Gd-DTPA bolus, an additional intravenous injection of 0.5 mg kg−1 of furosemide was applied.
After the acquisition of 60 post-contrast images with the dynamic TurboFLASH sequence, recording of the dynamic data set was paused for approximately 1 min for acquiring a highly resolved data set using a 3D gradient-echo sequence (TR/TE, 3.54/1.34 ms; flip angle, 25°; spatial resolution, 0.59 × 0.58 × 1 mm; bandwidth, 390 Hz per pixel) in the excretory phase. The same 3D gradient-echo sequence was applied again after the acquisition of the complete dynamic data set. Furthermore, if there was suspicion of an obstructing pole artery, an additional angiography was performed at the end of the examination applying the previously mentioned 3D gradient-echo sequence following a second bolus of 1 mmol kg−1 body weight of Gd-DTPA. The total duration of the MR examination was 50–70 min.
Post-processing was performed on-site with the standard scanner software (Syngo®; Siemens, Erlangen, Germany): first, 3D T2 weighted data sets were reformatted in order to obtain maximum-intensity projections in different projection angles rotated around the longitudinal axis. Second, signal-intensity–time curves in 2D gradient-echo images were obtained with the scanner software (meancurve tool) for computation of split renal function.
Additionally, calculation of the split renal function from the region of interest (ROI) analysis was carried out on a conventional stand-alone personal computer using Microsoft Excel® (Microsoft Inc., Redmond, WA) with a time expense of 10 min per patient.
Dynamic MR nephrography
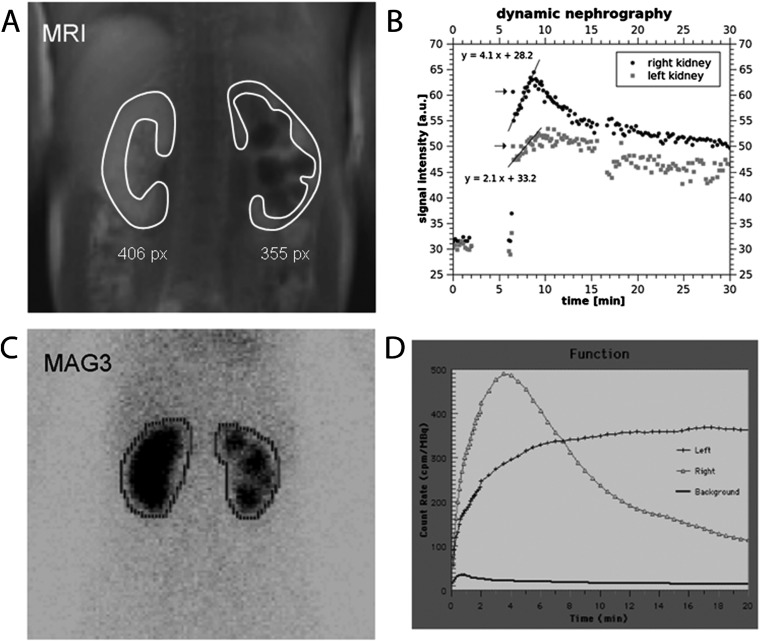
Split renal function was calculated from time–intensity curves generated from the dynamic data sets by definition of ROIs encompassing the renal parenchyma of each kidney (Figure 1). Typically, a vascular, parenchymal and excretory phase can be distinguished in the time–intensity curves of healthy kidneys.3–7 A short vascular phase with a transitory high-signal increase for several seconds immediately after the injection of the Gd-DTPA bolus is followed by a more prolonged linear signal intensity increase over approximately 1–2 min in the parenchymal phase, which corresponds to the contrast medium uptake into the glomeruli. The slope of the signal increase is directly proportional to the filtration capacity per tissue volume. In the subsequent excretory phase, the signal intensity decrease is caused by the superimposed transport of the contrast agent into the renal collecting system. Typically, a maximum of the signal intensity is reached approximately 4–7 min after the Gd-DTPA injection with a subsequent slow decline.
Figure 1.
MR nephrography of an 11-year-old girl with scarring of the left kidney owing to recurrent pyelonephritis associated with reflux. (a) Upper left image shows a TurboFLASH image from the dynamic series acquired in the parenchymal phase after contrast medium injection. Typical region of interest (ROI) definition is indicated (white lines). (b) The upper right image displays signal-intensity–time curves of both kidneys. Split renal function is calculated from the best-fit linear regression line to the signal increase in the parenchymal phase weighted with the size of the ROI. Lower images show the corresponding mercaptoacetyltriglycine (MAG3) examination [(c) ROI definition, (d) corresponding intensity curves]. MR nephrography resulted in split renal function of 69% (right side): 31% (left side), MAG3 scintigraphy 67%:33%.
The split renal function was calculated from the slopes of the linear signal increase in the parenchymal phase by means of a linear least-squares fit and subsequent multiplication by the area of the ROIs, which were used as a relative estimate of the renal volume. The product of slope of the signal increase and the area of the ROI for one kidney was normalized to the sum of those values from both kidneys to obtain the split renal function in percentage.
Dynamic MR urography
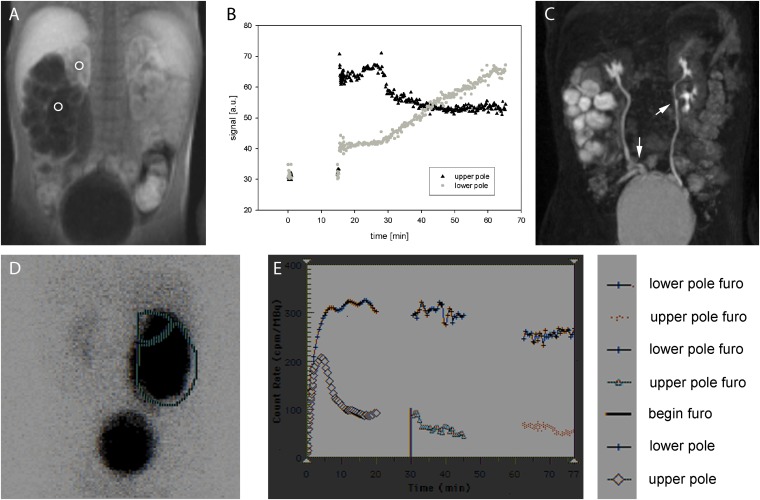
To generate time–intensity curves describing the temporal changes of the contrast medium concentration in the urinary passage, a ROI was manually outlined within the respective collecting system or the proximal part of each ureter. Approximately 6–8 min after the contrast agent bolus injection, the contrast media is usually excreted into the collecting system leading to a rapid increase of the signal intensity. Thereafter, healthy cases exhibit a steady concentration of contrast medium within the urinary excretion. The furosemide injection 20 min after the contrast medium administration causes an inhibition of the sodium–potassium–chloride cotransport in the distal loop of Henle with a subsequent increase in water diuresis. As the glomerular filtration rate is not changed by furosemide administration, the constantly filtered Gd-DTPA is diluted within an increased urine volume resulting in a lower plateau of the signal intensity curve (Figure 2).
Figure 2.
Upper row: (a) MR urography of a 2-year-old boy with double collecting system on both sides and ureteropelvic junction obstruction of the right lower pole. Two regions of interest (ROIs) were placed in the right upper and lower pole, respectively. (b) Corresponding signal-intensity–time curves: right upper pole shows normal signal behaviour with a fast increase of signal intensity after bolus injection to a plateau phase, which is owing to constant filtration of contrast medium into the urine without obstruction. After 20 min, furosemide (Furo) is applied resulting in the decline of the plateau to a lower level caused by reduced water reabsorption during constant filtration. Right lower pole exhibits a clearly different behaviour; a constant increase of signal intensity is displayed, which does not decline after furosemide application indicating functionally relevant obstruction of urinary transport. (c) Maximum-intensity projection of the three-dimensional data set acquired approximately 10 min after bolus injection during a short pause of the dynamic acquisition. Ureter fissus on both sides is indicated with arrows. Lower row shows corresponding mercaptoacetyltriglycine (MAG3) scintigraphy: (d) ROI definitions and (e) corresponding intensity curves.
In cases with obstruction, the excreted contrast medium is concentrated in a previously existing dilated collecting system leading to an increase of the signal intensity. After giving a furosemide bolus, relevant obstruction is expected to result in a further constant increase of the signal intensity within the collecting system.
Statistical evaluation
Split renal function of both kidneys was correlated to the reference standard of MAG3 scintigraphy by calculation of the Pearson's correlation coefficient. Descriptive statistical analyses were performed by one author (AB) using Microsoft Excel 2003. For calculation of sensitivity and specificity, the Vassar College's Sensitivity/Specificity Calculator was applied. Image interpretation in the context of the available clinical data was performed by two radiologists with extensive experience in urogenital MRI in consensus reading.
RESULTS
Assessment of ureteral obstruction
In all patients, assessment of ureteral obstruction was feasible based on the dynamic 2D MRI data set. In 27/53 patients, signal intensity courses of the renal pelvis and/or proximal ureter of both kidneys showed a plateau with a reduction of signal intensity after furosemide application to a lower plateau level, characterizing normal urinary excretion and transport to the bladder (Figure 2). 26 out of 53 patients exhibited gradually increasing signal intensity in the collecting system for at least 1 kidney without formation of a plateau owing to reduced urinary transport. From these 26 cases, 16 affected kidneys showed declining signal intensity after application of the furosemide bolus, whereas in 10 cases, a further increase of signal intensity was noted indicating functionally relevant obstruction. In the MAG3 scintigraphy, no reduction of the count rate after the peak was observed in at least 1 of the kidneys in 29 patients; in 24 patients, this observation corresponded to a reduced urinary transport being diagnosed as well with MR urography, whereas in 5 patients, no reduced urinary transport was seen in the respective MR examination. In 11 patients, functionally relevant obstruction was diagnosed with MAG3 scintigraphy, which included all 10 patients with relevant obstruction diagnosed by MR urography.
The discrepancy of one patient between both modalities was a case in which a pelvic pseudotumour owing to appendicitis caused a ureteral obstruction in the pelvis. The MAG3 scintigraphy, which was performed first, showed functional relevant obstruction with reduced urinary drainage. The MR examination was performed 1 week later, but, meanwhile, the ureter was completely obstructed by the pseudotumour. The respective kidney did not show filtration anymore, and therefore no contrast media was excreted into the renal pelvis. For this reason, no typical signal curve in the renal pelvis could be seen.
Regarding all the remaining patients, sensitivity of MR urography for diagnosis of functionally relevant stenosis was 100% with a 95% confidence interval (CI) of 74.1–100.0% and a specificity of 100% (CI, 91.0–100.0%).
Calculation of split renal function
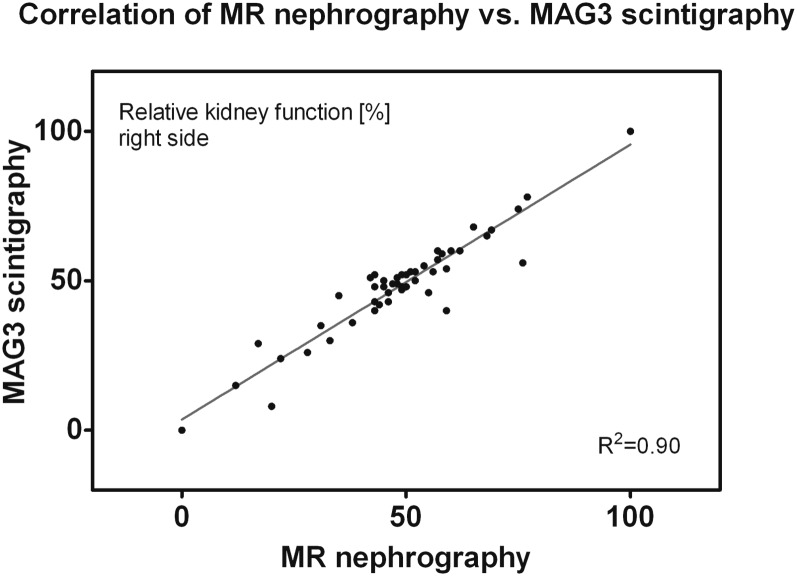
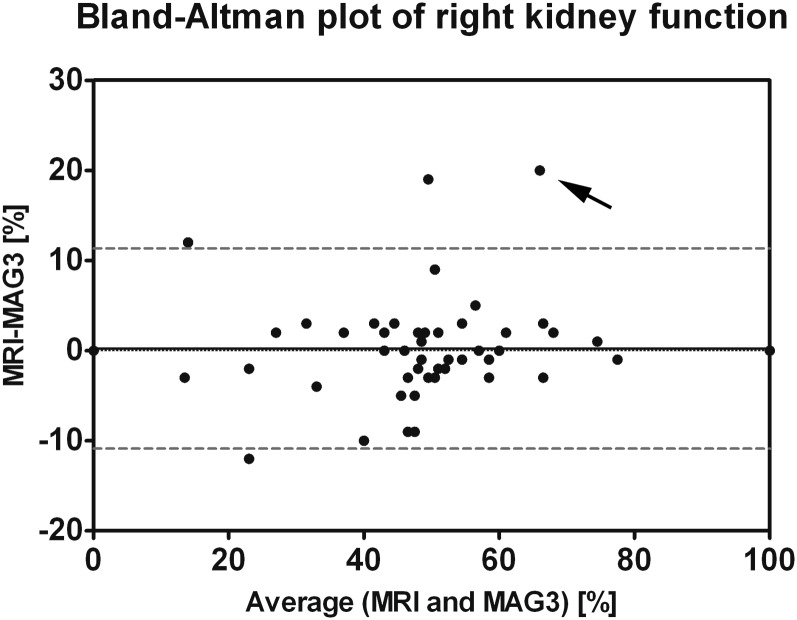
Quality of signal-intensity–time curves was sufficient for calculation of split renal function in all examined children. A case with reduced kidney function on the left side is depicted in Figure 1. An excellent correlation to the reference standard of MAG3 scintigraphy was found with a correlation coefficient of 0.95 (Figure 3). A corresponding Bland–Altman plot is displayed in Figure 4, with nearly all measurement points (except four cases) within ±1.96 standard deviations of the mean paired difference.
Figure 3.
Split renal function (right-sided kidney) calculated from dynamic MR nephrography exhibits excellent correlation to mercaptoacetyltriglycine (MAG3) scintigraphy with a Pearson's correlation coefficient r = 0.95.
Figure 4.
Bland–Altman plot of right kidney function for MR nephrography and mercaptoacetyltriglycine (MAG3) scintigraphy. Mean (0.23%) and 1.96 × standard deviation (5.7%) of the paired differences are indicated by solid and dashed lines, respectively. All measurement points, except four, are within ±1.96 standard deviations of the mean paired difference. In the measurement point with the strongest deviation between MAG3 and MR functions (arrow, case of Figure 5), impaired left kidney function was found in MR nephrography with normal kidney function in MAG3 scintigraphy. This finding may potentially be attributed to an earlier impairment of glomerular filtration (measured with GD-DTPA) as compared with tubular function (evaluated with MAG3).
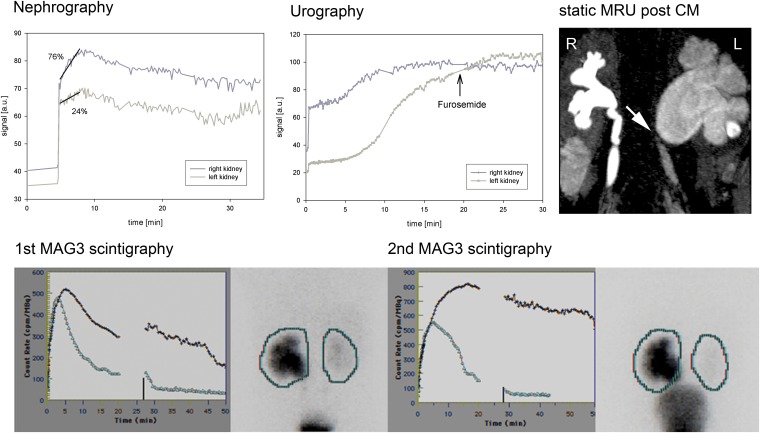
An example with a marked difference of 20% between MRI and scintigraphy regarding the split renal function (24% vs 44%) was a 2-year-old boy suffering from relevant ureteropelvic obstruction of the left side (Figure 5), which was newly decompensated. However, it should be mentioned that the former scintigraphy of this patient 4 months ago demonstrated only a functional obstruction with a diuretic half-time (t½) shorter than 20 min.
Figure 5.
MR nephrography of a 3-year-old boy with ureteropelvic junction obstruction on the left side and megaureter on the right side owing to vesicoureteral reflux. Reduced kidney function was found on the left side with a differential renal function of 76%:24% owing to newly decompensated ureteropelvic junction obstruction confirmed by mercaptoacetyltriglycine (MAG3) scintigraphy (second scintigraphy; dark line, left kidney; light line, right kidney). The former scintigraphy of this patient 4 months ago had demonstrated only a functional obstruction with a diuretic half-time (t1/2) shorter than 20 min (first scintigraphy; dark line, left kidney; light line, right kidney). The discrepancy in differential renal function between MRI and MAG3 may be caused by the different mechanism of excretion (glomerular filtration/tubular secretion). CM, contrast media; MRU, MR urography.
Hyperfiltration/renal failure
In the 20 patients with double collecting systems, hyperfiltration was found in 4 cases, all of them showing dilated collecting systems in 1 of the poles and exhibiting reduced kidney function and hyperfiltration in the corresponding other pole. In two of these cases, functionally relevant obstruction was diagnosed in the dilated pole; in the other two cases, reduced renal drainage without functionally relevant obstruction was found.
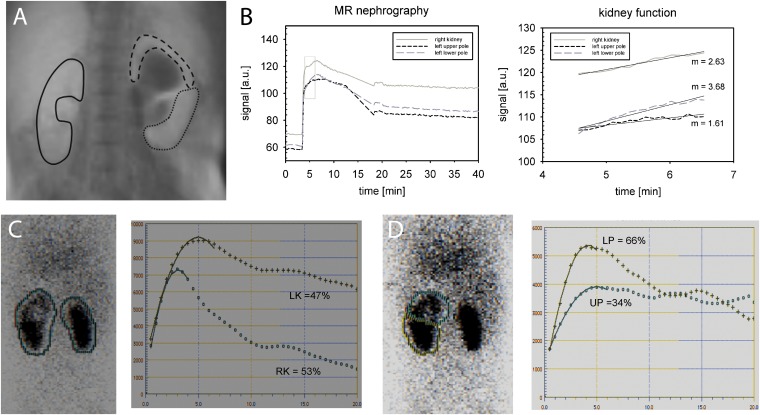
An interesting finding in a 10-month-old girl is depicted in Figure 6: a functionally relevant obstruction of the upper pole of the left kidney was caused by an ureterocele. The affected upper pole shows a smaller ascending slope of the best-fit straight line than does the contralateral kidney indicating reduced filtration rate per kidney volume. By contrast, the not obstructed lower pole of the left side exhibits a notably steeper ascending slope than does the contralateral kidney indicating hyperfiltration. The corresponding MAG3 scintigraphy demonstrated similar findings confirming the hyperfunction diagnosed with MR nephrography.
Figure 6.
The case of a 10-month-old girl with double collecting system on the left side and functionally relevant obstruction of the upper pole owing to a ureterocele. In the MR nephrography [(a) region of interest (ROI) definition, (b) signal curves and renal function evaluation], normal ratio of split renal function is found with 56% (right side): 44% (left side) corresponding to 53%:47% in (c) mercaptoacetyltriglycine (MAG3) scintigraphy. If the slope of the parenchymal phase in MR nephrography is examined separately for both poles on the left side and the right kidney, the upper pole exhibits a smaller increase (m = 1.61) than does the healthy contralateral kidney (m = 2.63) that indicated reduced filtration capacity. Measuring the healthy lower pole, a notably higher increase (m = 3.68) is found than in the contralateral side, potentially caused by hyperfiltration. (d) A similar finding can be seen in the MAG3 scintigraphy. LK, left kidney; LP, lower pole; RK, right kidney; UP, upper pole.
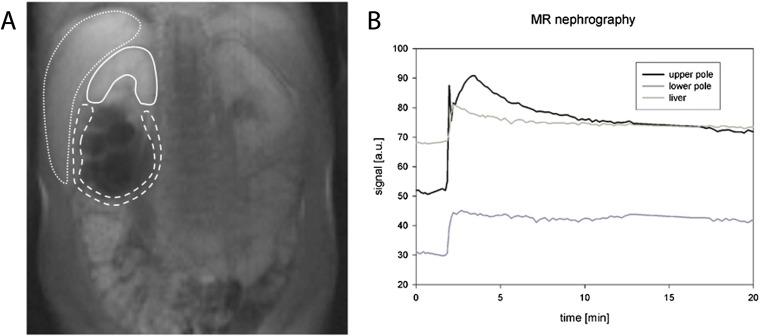
Two cases completely lacked kidney function owing to ureteral obstruction: in one case, a complete obstruction was found at the lower pole of a kidney with double collecting system (Figure 7). In the other case (already described above), a pseudotumour owing to appendicitis caused complete ureteral obstruction. In both cases, no increase of the signal intensity of the renal parenchyma could be detected in the parenchymal phase. Instead, after an early initial peak directly following the first-pass perfusion, a constant decline was observed indicating complete lack of glomerular filtration (corresponding to acute or chronic renal failure). In kidneys without filtration, the organ exhibits similar signal intensity characteristics as compared with other parenchymal organs of the abdomen, such as the liver or spleen.
Figure 7.
A 10-year-old boy with double collecting system on the right side showing no signal increase in the parenchymal phase and no contrast medium excretion into the collecting system owing to complete ureteral obstruction: (a) region of interest definition, (b) corresponding signal intensity curves. In case of a functionless kidney or kidney pole, the signal curve becomes similar to the curve of other abdominal organ such as the liver with a constant decline of the signal intensity.
DISCUSSION
Dynamic MR nephrography has become a valuable tool for the assessment of obstructive uropathy.10–13 In this report, we propose a protocol for MR urography that provides functional information such as split renal function, which can easily be obtained from the dynamically acquired single-slice 2D data sets. Furthermore, urinary excretion into the ureter can be assessed dynamically by computation of signal-intensity–time curves. The presented study confirms robustness of the proposed examination and post-processing protocol, and excellent agreement to established MAG3 scintigraphy. As only little post-processing time of about 10 min is necessary, the proposed technique is compatible with the clinical need of immediate availability of the results after MR examination.
The protocol is a modification of a technique previously described by Rohrschneider et al3,4 Modifications comprise a change of the sequence type and of the post-processing: former studies3,4 applied a conventional T1 weighted spoiled gradient-echo sequence with an acquisition time of approximately 8–10 s, whereas the present approach works with a faster single-shot TurboFLASH saturation–recovery sequence with a measuring time of only approximately 0.5 s. In a previous methodological study, it was shown that this sequence provides desirable nearly linear signal enhancement with increasing contrast medium concentration.14 Owing to the short acquisition time, the sequence could be easily combined with a navigator-triggering technique. This feature provides image acquisition at virtually identical kidney position and provides more accurate ROI analysis, especially in examinations of children who are not able to hold their breath. Resulting signal-intensity–time curves computed from the dynamic 2D data sets with high temporal resolution allowed two further modifications: (a) relative glomerular filtration was estimated by linear regression from the signal intensity slope in the parenchymal phase after contrast medium application instead from the area under the curve, which notably simplified split renal function calculation. (b) Urinary excretion was not assessed from ROIs comprising the whole kidney but from small ROIs placed in the renal pelvis or proximal ureter offering direct information on contrast medium excretion and urinary transport to the bladder.
Other protocols currently proposed15 favour 3D spoiled gradient-echo sequences providing higher spatial resolution. However, longer acquisition times of repetitive 3D measurements are more susceptible to breathing artefacts, which are particularly evident in older children. Second, conventional spoiled gradient-echo sequences are in general inferior regarding signal linearity for increasing contrast medium concentration compared with sequences applying a saturation or inversion pre-pulse. Third, a large amount of 3D data with a reduced temporal resolution must be post-processed sophistically, including 3D segmentation of the organ structures.16,17 Those procedures usually lead to additional working time on a remote personal computer. However, with more sophisticated 3D segmentation software and faster MRI data acquisition (MRI undersampling, compressed sensing) a dynamic 3D acquisition seems a potential future direction of MR urography development.
The proposed protocol provides additional morphological information by a 3D spoiled gradient-echo sequence, which is acquired two times approximately 6–8 and 40–45 min after contrast medium administration. An additional heavily T2 weighted navigator-triggered 3D fast spin-echo sequence (TE = 699 ms) is applied before contrast injection for static urography. With these data sets, excellent depiction of the anatomy of the urinary tract is guaranteed. Furthermore, the protocol can be combined with a sequence for 3D angiography for depiction of anomalies of the renal vessels.
Proper preparation of the young patients before MR urography is an important issue: the child has to be adequately hydrated in order to avoid reduction of filtration capacity owing to autoregulation. To ensure sufficient hydration, we applied 15 ml of normal saline solution per kilogram of body weight 30 min before MR examination intravenously. Furthermore, a small amount of furosemide was given intravenously (0.3 mg kg−1, up to 20 mg) to achieve sufficient urinary flow. Dynamic evaluation is susceptible to body movement. For this reason, a mild intravenous sedation was applied in most children younger than 5 years of age (instead of general anaesthesia). As the young patients received additional MAG3 scintigraphy, we avoided a new bladder catheterization for the MR examination. This might have resulted in reduced urinary transport in several patients owing to increasing pressure in the bladder. However, in all patients, the proposed MR approach allowed to distinguish reduced urinary drainage from functionally relevant obstruction in good agreement with the findings from MAG3 scintigraphy.
We used Gd-DTPA (acid) as MRI contrast agent, which is an ionic linear gadolinium chelate with intermediate safety regarding the development of nephrogenic systemic fibrosis. In all patients, serum creatinine levels were routinely evaluated before MRI examination. Only in one patient renal insufficiency with a glomerular filtration rate <60 ml min−1 per 1.72 mm2 was observed. No patient showed any signs of nephrogenic systemic fibrosis after the MRI examination. For future examinations, we recommend to use a stable gadolinium complex such as gadoteric acid or gadobutrol.
In patients with renal artery stenosis, renal perfusion and functional parameters are often correlated,18,19 but, in general, kidney perfusion is no valid measure of kidney function. This was most obvious in the two cases with complete ureteral obstruction. In these cases, we found a fast increase of signal intensity after contrast medium bolus injection owing to tissue perfusion. In contrast to kidney parenchyma with normal function, in cases with complete obstruction, no further increase of signal intensity was detected in the parenchymal phase. Instead, immediate signal decay was found similar to the signal behaviour in other parenchymal organs such as the liver.
In four patients with at least one kidney with double collecting system and reduced renal transport as well as reduced function of one pole, compensatory hyperfiltration in the non-obstructed kidney pole (meaning stronger filtration than the healthy contralateral kidney) was revealed. It seems that the pole with reduced renal function may influence the healthy parenchyma of the ipsilateral kidney. A literature research did not lead to similar descriptions in other articles, including radionuclide studies. However, in our cases, hyperfiltration detected by MR nephrography was also indicated in MAG3 scintigraphic examinations (an example is provided in Figure 6). The cause and the clinical meaning of the hyperfiltrating/hyperfunctioning non-obstructive pole remains unclear and should be investigated in further clinical studies.
When comparing functional MRU and diuretic scintigraphy, it is important to keep in mind that there are different pathways of tracer elimination resulting in predominant tubular excretion in 99mTc-MAG3 (about 80%) and complete filtration in 99mTc-DTPA. Thus, MAG3 is related to relative effective renal plasma flow (ERPF), whereas DTPA concentrations depend on the glomerular filtration rate (GFR). It is well known that in cases of acute severe obstruction, GFR will be more compromised than ERPF.20 Moreover, a recent study on rabbits receiving a surgically ureteral ligature of one side has shown that the difference of split renal function measured by DTPA in the first week after the procedure was larger than by MAG3.21 Therefore, the large difference of split renal function between MRI and scintigraphy of approximately 20% in the case shown in Figure 5 may be attributed to the inferior sensitivity of MAG3 in acute obstruction.
Our study had limitations: (1) image interpretation was carried out in consensus reading between two radiologists. We did not perform blinded readings for assessment of reader agreement. (2) The proposed MRI protocol does not provide sufficient information regarding vesicoureteric reflux; therefore, an additional voiding cystourethrogram is additionally needed in most patients with urinary abnormalities to exclude vesicoureteric reflux. (3) No reproducibility measurements have been performed, which were not possible in this clinical setting. However, we were able to demonstrate that in all patients, sufficient image quality was obtained to allow for morphological and functional evaluation.
In summary, the proposed MRI technique provides functional and morphological information in patients with uropathic diseases; the combined 2D and 3D MRI protocol is robust, exhibits excellent correlation to MAG3 scintigraphy and requires only short and easy-to-perform post-processing. In contrast to scintigraphy, higher spatial resolution is achieved without application of a radioactive tracer.
FUNDING
This study was funded by the University Hospital Zürich, Zurich, Switzerland.
REFERENCES
- 1.Song R, Yosypiv IV. Genetics of congenital anomalies of the kidney and urinary tract. Pediatr Nephrol 2011; 26: 353–64. doi: 10.1007/s00467-010-1629-4 [DOI] [PubMed] [Google Scholar]
- 2.Ringert RH, Riedmiller H, Rübben H, Rose A, Hoyer PF, Conrad S, et al. Obstructive nephropathy. Urologe A 2006; 45(Suppl. 4): 225–8. [DOI] [PubMed] [Google Scholar]
- 3.Rohrschneider WK, Haufe S, Wiesel M, Tonshoff B, Wunsch R, Darge K, et al. Functional and morphologic evaluation of congenital urinary tract dilatation by using combined static-dynamic MR urography: findings in kidneys with a single collecting system. Radiology 2002; 224: 683–94. [DOI] [PubMed] [Google Scholar]
- 4.Rohrschneider WK, Haufe S, Clorius JH, Troger J. MR to assess renal function in children. Eur Radiol 2003; 13: 1033–45. [DOI] [PubMed] [Google Scholar]
- 5.Grattan-Smith JD, Perez-Bayfield MR, Jones RA, Little S, Broecker B, Smith EA, et al. MR imaging of kidneys: functional evaluation using F-15 perfusion imaging. Pediatr Radiol 2003; 33: 293–304. [DOI] [PubMed] [Google Scholar]
- 6.Grattan-Smith JD, Jones RA. MR urography in children. Pediatr Radiol 2006; 36: 1119–32. [DOI] [PubMed] [Google Scholar]
- 7.Teh HS, Ang ES, Wong WC, Tan SB, Tan AG, Chng SM, et al. MR renography using a dynamic gradient-echo sequence and low-dose gadopentetate dimeglumine as an alternative to radionuclide renography. AJR Am J Roentgenol 2003; 181: 441–50. [DOI] [PubMed] [Google Scholar]
- 8.Boss A, Schaefer JF, Martirosian P, Hacker HW, Darge K, Claussen CD, et al. Contrast-enhanced dynamic MR nephrography using the TurboFLASH navigator-gating technique in children. Eur Radiol 2006; 16: 1509–18. [DOI] [PubMed] [Google Scholar]
- 9.Boss A, Schaefer JF, Martirosian P, Obermayr F, Fuchs J, Claussen CD, et al. Dynamic magnetic resonance nephrography and urography of uropathies in children. [In German.] Rofo 2007; 179: 832–40. [DOI] [PubMed] [Google Scholar]
- 10.Chu WC, Lam WW, Chan KW, Yeung CK, Lee KH, Sihoe JD. Dynamic gadolinium-enhanced magnetic resonance urography for assessing drainage in dilated pelvicalyceal systems with moderate renal function: preliminary results and comparison with diuresis renography. BJU Int 2004; 93: 830–4. [DOI] [PubMed] [Google Scholar]
- 11.Leppert A, Nadalin S, Schirg E, Petersen C, Kardorff R, Galanski M, et al. Impact of magnetic resonance urography on preoperative diagnostic workup in children affected by hydronephrosis: should IVU be replaced? J Pediatr Surg 2002; 37: 1441–5. [DOI] [PubMed] [Google Scholar]
- 12.Daniel BB, Jones RA, Scherz H, Kirsch AJ, Little SB, Grattan-Smith JD. Dynamic contrast-enhanced MR urography in the evaluation of pediatric hydronephrosis: part 2, anatomic and functional assessment of ureteropelvic junction obstruction. AJR Am J Roentgenol 2005; 185: 1608–14. [DOI] [PubMed] [Google Scholar]
- 13.Louca G, Liberopoulos K, Fidas A, Nikolakopoulou Z, Lykourinas M, Strigaris K. MR urography in the diagnosis of urinary tract obstruction. Eur Urol 1999; 35: 102–8. [DOI] [PubMed] [Google Scholar]
- 14.Boss A, Martirosian P, Schaefer JF, Gehrmann M, Artunc F, Risler T, et al. Dynamic magnetic resonance nephrography: is saturation recovery TrueFISP advantageous over saturation recovery TurboFLASH? Invest Radiol 2007; 42: 256–62. [DOI] [PubMed] [Google Scholar]
- 15.Jones RA, Grattan-Smith JD, Little S. Pediatric magnetic resonance urography. J Magn Reson Imaging 2011; 33: 510–26. doi: 10.1002/jmri.22474 [DOI] [PubMed] [Google Scholar]
- 16.Jones RA, Schmotzer B, Little SB, Grattan-Smith JD. MRU post-processing. Pediatr Radiol 2008; 38: S18–27. [DOI] [PubMed] [Google Scholar]
- 17.Rusinek H, Boykov Y, Kaur M, Wong S, Bokocheva L, Sajous JB, et al. Performance of an automated segmentation algorithm for 3D MR renography. Magn Reson Med 2007; 57: 1159–67. [DOI] [PubMed] [Google Scholar]
- 18.Fenchel M, Martirosian P, Langanke J, Giersch J, Miller S, Stauder NI, et al. Perfusion MR imaging with FAIR true FISP spin labeling in patients with and without renal artery stenosis: initial experience. Radiology 2006; 238: 1013–21. [DOI] [PubMed] [Google Scholar]
- 19.Michaely HJ, Schoenberg SO, Ittrich C, Dikow R, Bock M, Guenther M. Renal disease: value of functional magnetic resonance imaging with flow and perfusion measurements. Invest Radiol 2004; 39: 698–705. [DOI] [PubMed] [Google Scholar]
- 20.Sedlak-Vadoc V, Basić M, Kaludjerski S, Marusić G, Negrojević M, Borota R. The effect of radiopharmaceutical choice on the assessment of the relative renal function in upper urinary tract obstruction. Eur J Nucl Med 1988; 14: 32–6. [DOI] [PubMed] [Google Scholar]
- 21.Lee WG, Kim JH, Kim JM, Shim KM, Kang SS, Chae HI, et al. Renal uptakes of 99mTc-MAG3, 99mTc-DTPA, and 99mTc-DMSA in rabbits with unilateral ureteral obstruction. In Vivo 2010; 24: 137–9. [PubMed] [Google Scholar]


