Abstract
Objective:
To determine if movement external to the patient occurring during mammography may be a source of image blur.
Methods:
Four mammography machines with eight flexible and eight fixed paddles were evaluated. In the first stage, movement at the paddle was measured mechanically using two calibrated linear potentiometers. A deformable breast phantom was used to mimic a female breast. For each paddle, the movement in millimetres and change in compression force in Newton was recorded at 0.5- and 1-s intervals, respectively, for 40 s with the phantom in an initially compressed state under a load of 80 N. In the second stage, clinical audit on 28 females was conducted on one mammography machine with the 18 × 24- and 24 × 29-cm flexible paddles.
Results:
Movement at the paddle followed an exponential decay with a settling period of approximately 40 s. The compression force readings for both fixed and flexible paddles decreased exponentially with time, while fixed paddles had a larger drop in compression force than did flexible paddles. There is a linear relationship between movement at the paddle and change in compression force.
Conclusion:
Movement measured at the paddle during an exposure can be represented by a second order system. The amount of extra patient movement during the actual exposure can be estimated using the linear relationship between movement at the paddle and the change in compression force.
Advances in knowledge:
This research provides a possible explanation to mammography image blurring caused by extra patient movement and proposes a theoretical model to analyse the movement.
Since the introduction of full-field digital mammography (FFDM), a number of breast imaging centres have identified blurred images through local audit. Individual centres have taken steps to reduce blurring through improving patient positioning, limiting the potential of patient movement and arresting patient respiration for the exposure duration, but blurring persists. Despite many centres anecdotally reporting the persistence of blurred images, few reports have been published considering the isolation of the causal factors.1 Persistent blurring was probably present on conventional film mammography but owing to improvements in contrast resolution in FFDM and the ability to magnify images, it may have become more apparent.2,3 Blurring may obscure significant breast pathology and can necessitate repeat imaging, thus increasing the radiation dose received by patients and raising their anxiety. Figure 1 shows a left mediolateral oblique mammography image acquired on a Hologic Selenia® Dimensions® unit (Hologic, Bedford, MA) using a 18 × 24-cm paddle. The image required repeating because it was not possible to determine whether pathology was present in the blurred areas. The repeat, sharp image demonstrated the presence of pathological features in this instance.
Figure 1.
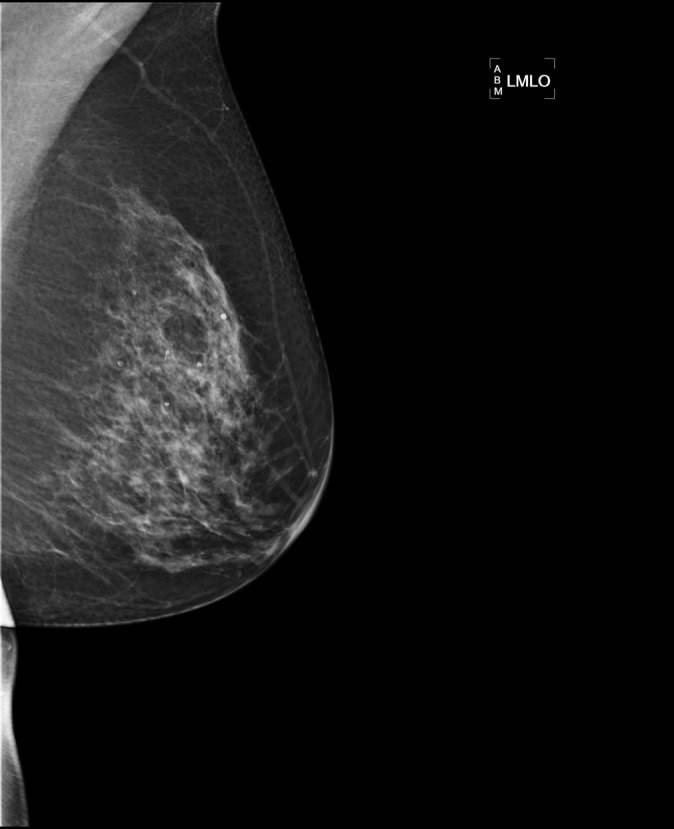
The image demonstrates significant blurring particularly around the junction of the mid to lower zone.
Despite reports of blurred images in the UK National Health Service Breast Screening Programme quality assurance forums, there is currently a paucity of literature surrounding this topic and only two publications have been found regarding digital mammography image blurring.4,5 Hogg et al4 reported a potential relationship between a perceived increase in blur and the use of FFDM systems and suggested this could be owing to paddle motion or tissue relaxation. They further suggested that blur was seen in up to 20% of screening mammograms even if deemed to be of adequate diagnostic quality. Choi et al5 reported FFDM patient-related motion to occur in only 0.4% of examinations and attributed this to longer exposure times. Motion artefacts were found to occur more commonly on linear grids rather than the crossed air type.
A number of hypotheses relating to causal factors for blur include inadequate compression, and patient and paddle movement. In a multicentre study on paddle distortion, Hauge et al6 noticed that the paddle moved for a significant period of time after compression force had ceased being applied. Research by Kelly et al7 suggested that image blurring may be induced by compression paddle movement during the image acquisition process. This led to the hypothesis that during an exposure, there is significant movement external to the control of the patient called extra patient movement. The extra patient movement may be caused by the reduction in the compression force during the exposure, resulting in a change in compressed breast thickness and leads to the movement of the breast tissue. Another possibility is that the breast exhibits thixotropic behaviour. This is supported by Geerligs et al8 who suggested that the adipose tissue undergoes structural changes when mechanical loading is applied. Therefore, traditional strategies to reduce image blur, related to reducing controllable patient movement, called intrapatient movement, may be inadequate. In light of that a multicentre study was conducted to test our hypothesis and to propose a theoretical model to analyse and predict extra patient movement.
METHODS AND MATERIALS
This study was divided into two stages with the aim to determine the expected extra patient movement during exposure. In the first stage, a theoretical model of paddle movement was developed from the breast phantom study. In the second stage, a clinical audit was undertaken to assess compression force reduction in vivo. The theoretical model developed in the first stage was then applied on the clinical audit data in the second stage to predict the average extra patient movement in the clinical environment.
Stage 1: breast phantom study
Four mammography machines in three hospitals with eight fixed and eight flexible paddles (Table 1), calibrated to give compression force in Newtons (N), were included in this study. Routine equipment quality assurance (QA) had been performed on the machines and the results complied with manufacturer specifications.9,10 Flexible paddles often have a spring-loaded system to allow compression force to be equally shared among the anterior and posterior parts of the paddle for more uniform compression (Figure 2). However, the posterior part of many fixed paddles is fixed firmly to the supporting framework, which only allows movement in the anterior part when compressed (Figure 3).
Table 1.
List of mammography units and paddles used in this study
| Hospital | Mammography unit | Paddle size and type | Number of units tested |
|---|---|---|---|
| A | Hologic Selenia® Dimensions® | 18 × 24 cm, fixed | 2 |
| 18 × 24 cm, flexible | |||
| 24 × 29 cm, fixed | |||
| 24 × 29 cm, flexible | |||
| B | Hologic Selenia Dimensions | 18 × 24 cm, fixed | 1 |
| 18 × 24 cm, flexible | |||
| 24 × 29 cm, fixed | |||
| 24 × 29 cm, flexible | |||
| C | Hologic Selenia Dimensions | 18 × 24 cm, fixed | 1 |
| 18 × 24 cm, flexible | |||
| 24 × 29 cm, fixed | |||
| 24 × 29 cm, flexible |
Figure 2.
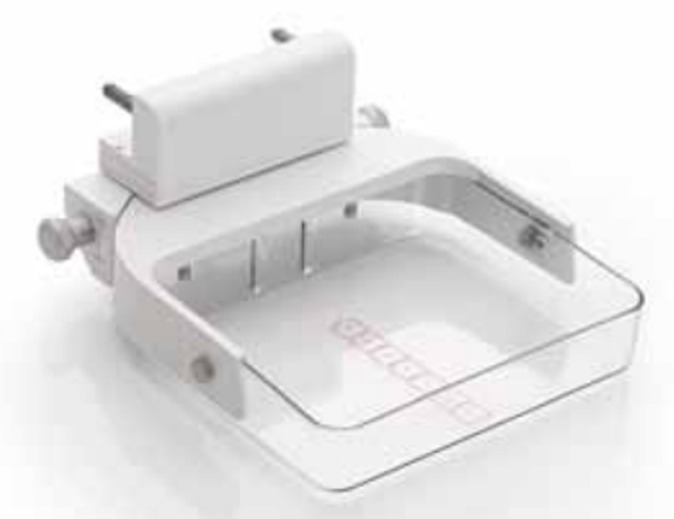
Hologic Selenia® Dimensions® 18 × 24-cm flexible paddle.
Figure 3.
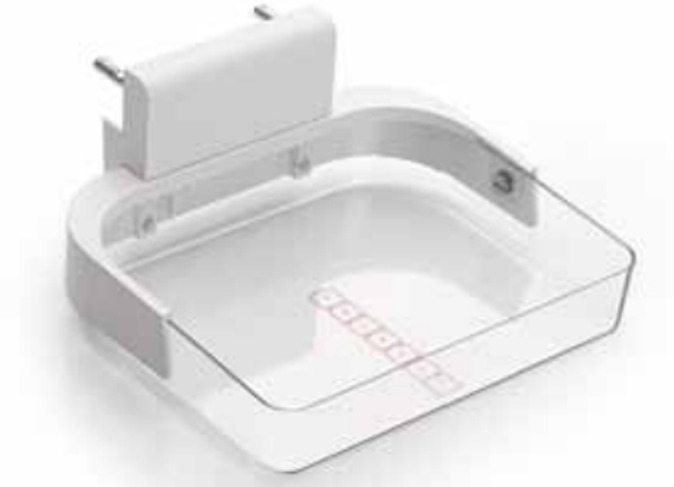
Hologic Selenia® Dimensions® 18 × 24-cm fixed paddle.
Deformable breast phantom and compression force
A deformable female breast phantom (Trulife, Sheffield, UK) was used to investigate paddle movement. The phantom had similar compression characteristics to the human female breast, with a pre-compression thickness of 130 mm. The phantom breast was encapsulated in a thin layer of latex and attached to a rigid supporting board via a semi-mobile mounting system (Figure 4).
Figure 4.
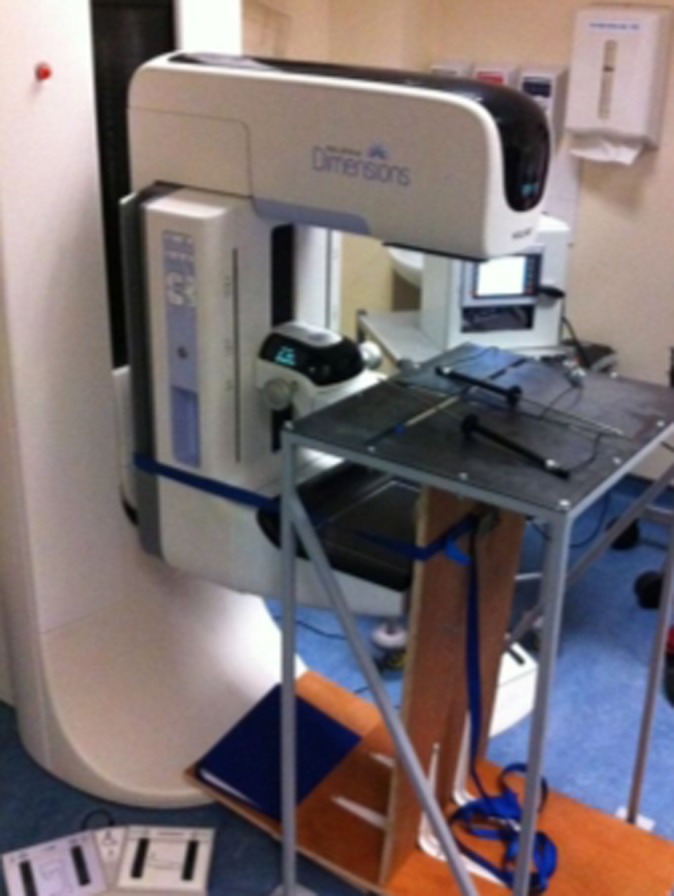
Deformable breast phantom mounted to rigid supporting board.
As shown in Figure 4, the rigid supporting board was kept firmly against the paddle and detector using a ratchet strap. The ratchet strap prevented the breast from slipping out of the paddle and detector region when compression force was applied. The strap therefore acted similar to a human female leaning against the paddle and detector to prevent breast slippage when compression force was applied.
The semi-mobile mounting system allowed the breast phantom to have minor movement on the rigid supporting board, in a fashion similar to a real breast on the pectoralis major muscles.11 The latex coating gave a level of rigidity to the phantom breast, similar to skin, which limited lateral and vertical motion. When compressed, the breast phantom allowed the paddle to respond in a fashion similar to compressing real breast tissue. This meant that the distal end (chest wall) of the paddle was slightly elevated when fixed paddles were used; as expected, this elevation was more pronounced when flexible paddles were used.
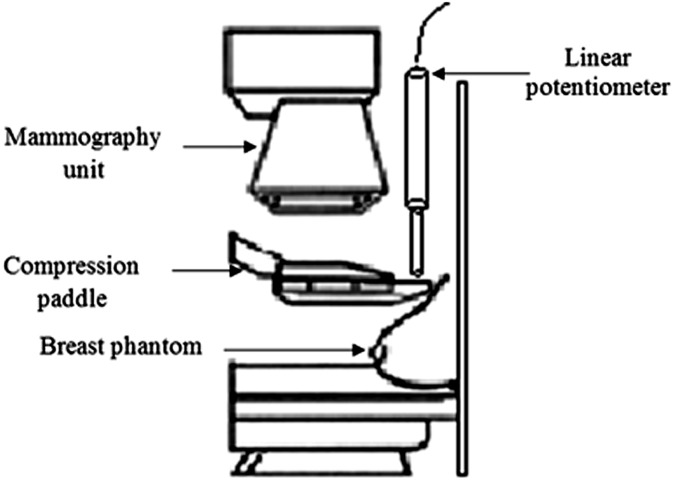
For each paddle, the phantom was compressed to approximately 80 N by applying the compression force slowly using the foot pedal initially and then hand winding to fine tune the compression force when the reading approached 80 N. The “machine-given” compression force readings were recorded at 1-s intervals for 40 s after the compression force applied by the practitioner ceased. The schematic diagram for the experimental configuration is shown in Figure 5.
Figure 5.
Schematic diagram showing the experimental configuration.
Paddle movement
The paddle movement was measured mechanically using two calibrated linear potentiometers (CLS1321; Active Sensors Inc., Indianapolis, IN) with a measurement range of 150 mm and a non-linearity of 0.15%. The linear potentiometers were placed at the paddle corners adjacent to the chest wall to measure movement in the vertical direction. For each paddle, the measurement was repeated three times to minimize experimental uncertainties; six potentiometer readings were therefore taken for each paddle. The rationale for locating the linear potentiometers at the paddle corners, adjacent to the chest wall, is based on the research findings from Hauge et al.6 Hauge et al noticed that most of the paddle distortion was found at the chest wall side of the paddle, which suggests that most movement might occur in this region.
Data logging system
Paddle movement in millimetres was recorded at 0.5-s intervals for 40 s by a custom-made data logging system provided by Mass Measuring Ltd (Manchester, UK). A pilot study identified that movement stabilizes after approximately 30 s; on this basis, it was decided to record readings for a period of 40 s; it was also considered that any clinical exposure will be much shorter than the threshold set, so any potential clinical impact should be fully described in this time frame. A 16-bit analogue to digital converter (ADC) was used in the data logging system. The data logging system serves three purposes: to calibrate the linear potentiometers before measurements are taken, to create a time log of the linear potentiometer readings and to export the recorded potentiometer data into a Microsoft Excel® (Microsoft, Redmond, WA) spread sheet format via a USB port for subsequent analysis.
Error analysis
Measurement resolution
Because the ADC used in the data logging system is a 16-bit controller, and the measurement range of the linear potentiometer is 150 mm, the smallest division that can be measured by the linear potentiometer is 0.002 mm. The uncertainty is assumed to be uniformly distributed.12 The standard uncertainty can be found by dividing the half-width (0.001 mm) by the square root of 3, giving ur = 0.0007 mm.
Non-linearity
The linear potentiometer has a non-linearity of 0.15% (0.23 mm). The uncertainty is assumed to be uniformly distributed.12 The standard uncertainty can be found by dividing the half-width (0.23 mm) by the square root of 3, giving un = 0.1 mm.
The combined standard uncertainty from all these factors can be found by
giving ut = 0.1 mm. For 95% level of confidence, the linear potentiometer standard uncertainty is ±0.2 mm.
Data analysis
The potentiometer readings indicate only the relative position of the paddle at a specific time; the actual paddle movement was determined by subtracting the final position of the potentiometer at 40 s from the current position at time tx. It was noticed that, on occasion, paddles tilt during the application of compression force, and the paddle movement measured by one potentiometer can be different to the other. The term “paddle tilt” used in this article is defined as the inclination of the compression paddle in the frontal plane. To compensate for paddle tilt, the two potentiometer readings were averaged to provide a mean value for the movement of the paddle in the vertical direction.
Stage 2: clinical audit
A relationship between paddle movement and the change in compression force was derived using the experimental phantom data from Stage 1. Practical calibration factors were determined from the paddle movement—change compression force relationship on a Hologic Selenia Dimensions machine with the 18 × 24- and 24 × 24-cm flexible paddles. The calibration factors were then applied on the data from the clinical audit (approval was granted by the hospital to carry out this audit) in Stage 2 to estimate the amount of paddle movement, which might be present during the actual exposure of 28 female patients on the same mammography unit. Compression force at the start of each exposure and compression force at the end of each exposure were recorded for each patient.
RESULTS
Stage 1: phantom study
Paddle movement
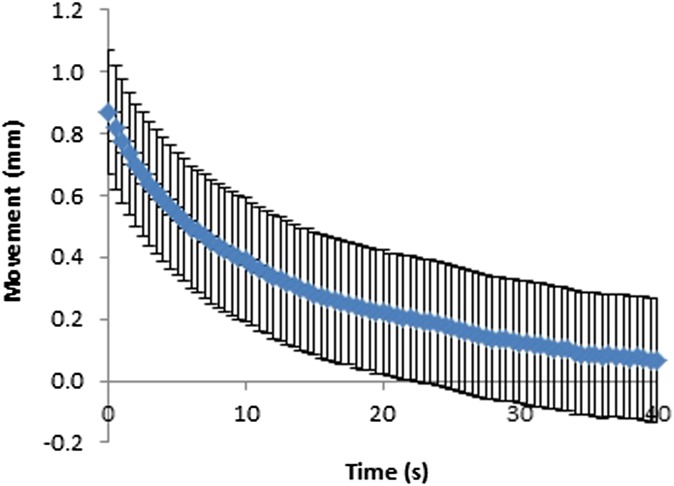
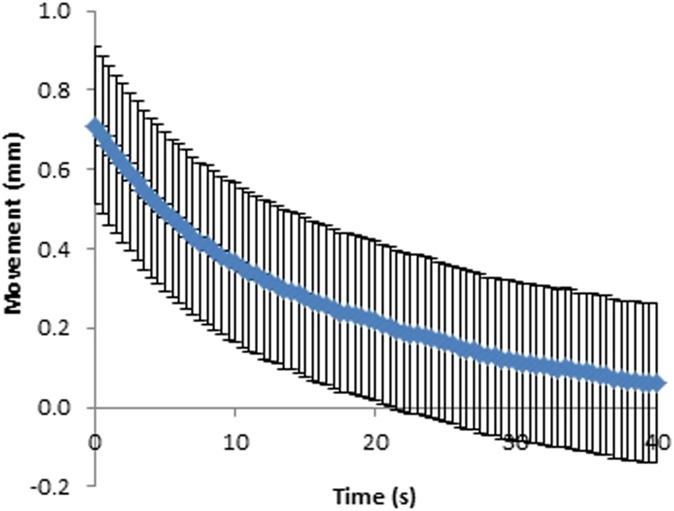
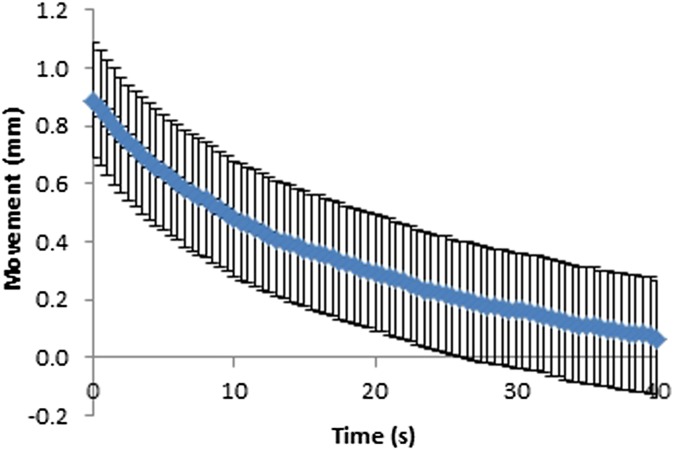
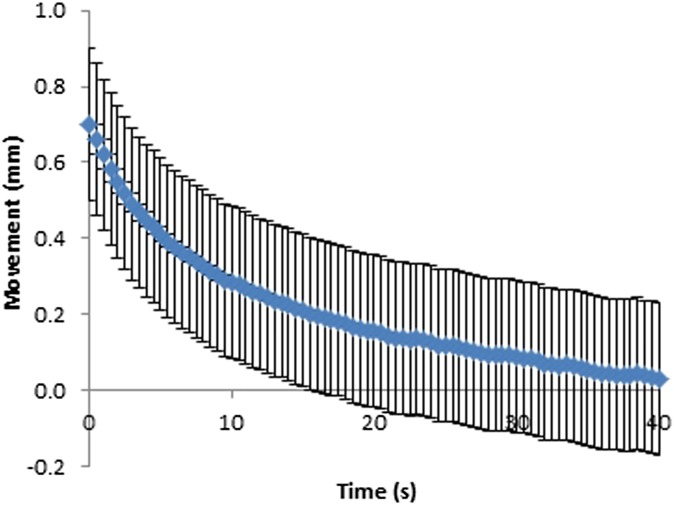
Movement at the paddle for fixed and flexible paddles was plotted against time (Figures 6–9). As can be seen in Figures 6–9, the movement decreases exponentially without oscillation, and fixed paddles have a shorter average settling time than do flexible paddles. The error bars in Figures 6–9 are the standard uncertainty of the measurement that is calculated in the error analysis section.
Figure 6.
Movement–time curve for 18 × 24-cm fixed paddles. Error bars show the instrumentation error.
Figure 9.
Movement–time curve for 24 × 29-cm flexible paddles. Error bars show the instrumentation error.
Figure 7.
Movement–time curve for 18 × 24-cm flexible paddles. Error bars show the instrumentation error.
Figure 8.
Movement–time curve for 24 × 29-cm fixed paddles. Error bars show the instrumentation error.
The average paddle movement for 18 × 24-cm fixed and flexible paddles in the first 10-s interval was 0.43 and 0.38 mm, respectively, which contributed to 59% and 48% of the total movement. The average paddle movement for 24 × 29-cm fixed and flexible paddles in the first 10-s interval was 0.38 mm and 0.32 mm, respectively, which contributed to 61% and 54% of the total movement (Table 2). As can be seen in Table 2, the rate of paddle movement for both fixed and flexible paddles is the highest in the first 10-s interval and drops significantly after the first 10-s interval.
Table 2.
Average paddle movement and the rate of paddle movement (in millimetres) over the 40-s measuring period (mm s−1)
| Paddle type | Time period (s) |
|||
|---|---|---|---|---|
| 0.5–10.0 | 10.5–20.0 | 20.5–30.0 | 30.5–40.0 | |
| 18 × 24 cm, fixed | 0.43 (−0.044) | 0.15 (−0.016) | 0.09 (−0.010) | 0.06 (−0.006) |
| 18 × 24 cm, flexible | 0.38 (−0.038) | 0.18 (−0.018) | 0.13 (−0.013) | 0.10 (−0.010) |
| 24 × 29 cm, fixed | 0.38 (−0.037) | 0.12 (−0.013) | 0.06 (−0.007) | 0.06 (−0.006) |
| 24 × 29 cm, flexible | 0.32 (−0.034) | 0.13 (−0.014) | 0.09 (−0.010) | 0.05 (−0.006) |
Table 3 summarizes the maximum, minimum, average and standard deviation of paddle movement (over the settling period of 40 s) for the eight fixed and eight flexible paddles. The flexible paddles have slightly larger average movement than do the fixed paddles.
Table 3.
Summary of paddle movement across time
| Paddle movement | Paddle size, paddle type |
|||
|---|---|---|---|---|
| 18 × 24 cm, fixed | 18 × 24 cm, flexible | 24 × 29 cm, fixed | 24 × 29 cm, flexible | |
| Maximum (mm) | 1.41 | 0.96 | 0.86 | 0.85 |
| Minimum (mm) | 0.01 | 0.02 | 0.01 | 0.02 |
| Average (mm) | 0.28 | 0.34 | 0.21 | 0.26 |
| Standard deviation (mm) | 0.25 | 0.22 | 0.18 | 0.18 |
The dynamics of mechanical systems and their controls can often be approximated to those of a second order system, for example, a spring–mass–damper arrangement. In this case, the settling response of the movement at the paddle suggests second order dynamics that are damped, the standard solution for which is given by:13
λ1 and λ2 are empirically identified constants that reflect the physical properties of the paddle and breast. C1 and C2 are empirically identified constants that depend on the initial conditions of the system at the start of the movement. The movement equations for fixed and flexible paddles were derived using iterative fitting, minimizing the residual sum of the squares (RSSs) using Microsoft Excel. The RSS values for 18 × 24-cm and 24 × 29-cm fixed paddles were 0.0338 and 0.025, respectively; and for 18 × 24-cm and 24 × 29-cm flexible paddles were 0.0088 and 0.0071, respectively, which indicates only a small discrepancy between the experimental data and the proposed second order model. The general paddle movement equations for the 18 × 24-cm and 24 × 29-cm fixed paddles are x(t)18×24 = 0.392 e−0.07t + 0.392 e−0.07t and x(t)24×29 = 0.313 e−0.07t + 0.313 e−0.07t, respectively. The general paddle movement equations for the 18 × 24-cm and 24 × 29-cm flexible paddles are x(t)18×24 = 0.431 e−0.06t + 0.431 e−0.06t and x(t)24×29 = 0.340 e−0.06t + 0.313 e−0.06t, respectively. The damping ratio, ζ, and natural frequency, ωn, for fixed paddles are 1.00 and 0.07 rad s−1, respectively, and 1.00 and 0.06 rad s−1 for flexible paddles, respectively.
Compression force
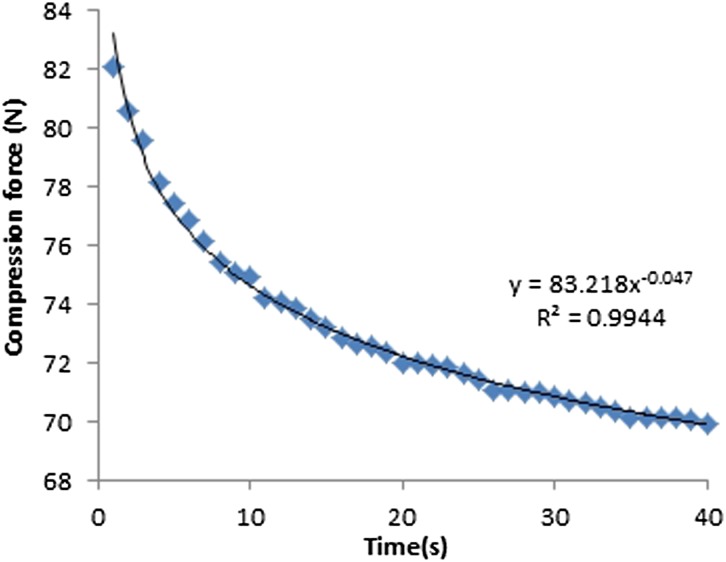
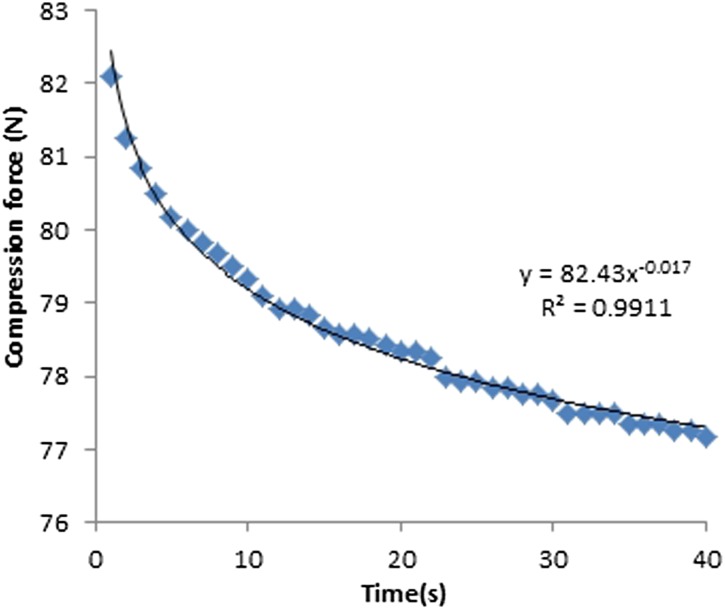
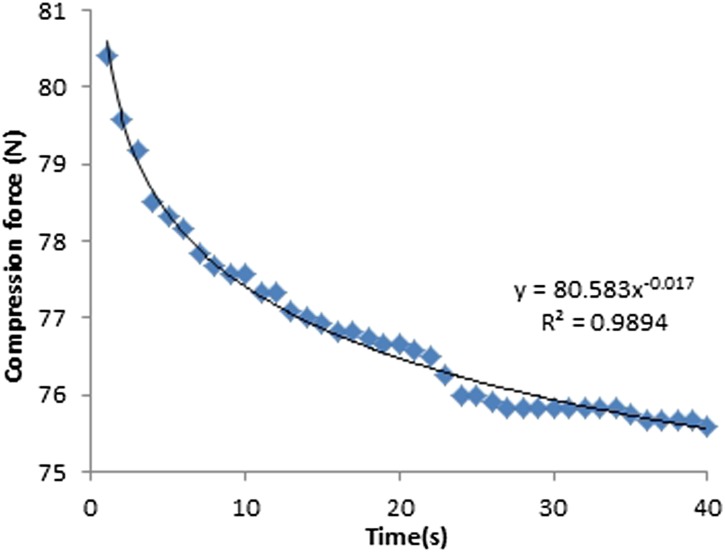
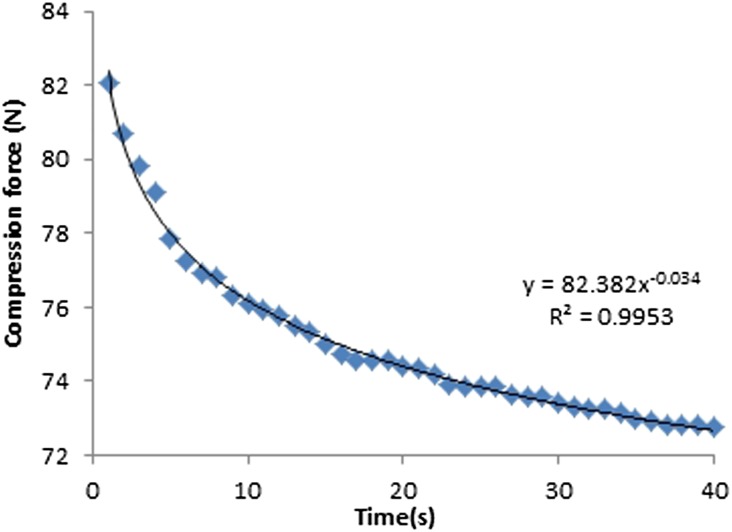
The machine-given compression force readings for both fixed and flexible paddles decreased exponentially with time (Figures 10–13). The average drop in compression force for 18 × 24-cm fixed and flexible paddles in the first 10-s interval was 7 and 3 N, respectively, which contributed to 64% and 75% of the total change in compression force. The average drop in compression force for 24 × 29-cm fixed and flexible paddles in the first 10-s was 6 and 3 N, respectively, which contributed to 67% and 75% of the total change in compression force (Table 4). The rate of change of compression force in the first 10-s interval is the highest for both fixed and flexible paddles and drops significantly after the first 10-s interval.
Figure 10.
Compression force against time for 18 × 24-cm fixed paddles.
Figure 13.
Compression force against time for 24 × 29-cm flexible paddles.
Table 4.
Average compression force change and the rate of change (in Newtons) over the 40-s measuring period (N s−1)
| Paddle type | Time period (s) |
|||
|---|---|---|---|---|
| 1–10 | 11–20 | 21–30 | 31–40 | |
| 18 × 24 cm, fixed | 7 (−0.7) | 2 (−0.2) | 1 (−0.1) | 1 (−0.1) |
| 18 × 24 cm, flexible | 3 (−0.3) | 0 (0) | 1 (−0.1) | 0 (0) |
| 24 × 29 cm, fixed | 6 (−0.6) | 2 (−0.2) | 1 (−0.1) | 0 (0) |
| 24 × 29 cm, flexible | 3 (−0.3) | 1 (−0.1) | 0 (0) | 0 (0) |
Figure 11.
Compression force against time for 18 × 24-cm flexible paddles.
Figure 12.
Compression force against time for 24 × 29-cm fixed paddles.
Table 5 summarizes the maximum, minimum, average and standard deviation of average compression force drop for the eight fixed and eight flexible paddles. The fixed paddles have a larger average compression force drop than do the flexible paddles.
Table 5.
Summary of compression force drop across time
| Change in compression force | Paddle size, paddle type |
|||
|---|---|---|---|---|
| 18 × 24 cm, fixed | 18 × 24 cm, flexible | 24 × 29 cm, fixed | 24 × 29 cm, flexible | |
| Maximum (N) | 18 | 7 | 11 | 7 |
| Minimum (N) | 6 | 3 | 8 | 4 |
| Average (N) | 12 | 5 | 9 | 5 |
| Standard deviation (N) | 3.8 | 1.2 | 1.2 | 1.3 |
Compression force vs paddle movement
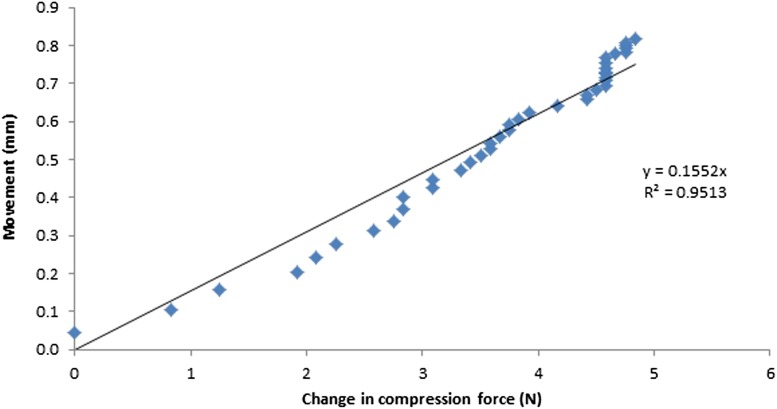
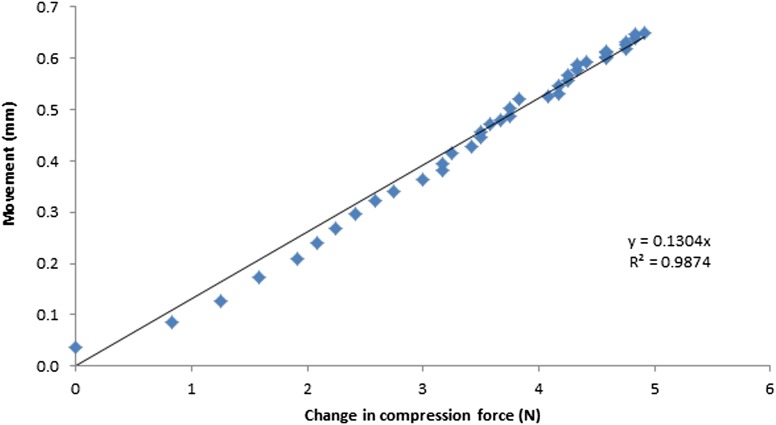
The change in compression force was determined by subtracting the initial compression force at time zero t0 from the current compression force at time tx. As seen in Figures 14 and 15, a proportional relationship between the movement at the paddle and change in compression force was demonstrated. The calibration factors for the Hologic Selenia Dimensions unit with the 18 × 24-cm and 24 × 29-cm flexible paddles were 0.1552 and 0.1304, respectively. This relationship between compression force and movement will depend on the elasticity of the breast. Our phantom has only one elasticity, unlike the female breasts that will have a range of elasticities (k); this should be borne in mind for further work.
Figure 14.
The relationship between paddle movement and change in compression force for the 18 × 24-cm flexible paddle.
Figure 15.
The relationship between paddle movement and change in compression force for the 24 × 29-cm flexible paddle.
Stage 2: clinical audit
Table 6 summarizes the maximum, minimum, average and standard deviation of change in compression force on the Hologic Selenia Dimensions unit used for the clinical audit using the 18 × 24-cm and 24 × 29-cm flexible paddles. Using the calibration factors derived from our phantom experiment, the amount of movement that might be incurred during the exposure from the 28 females was predicted. The average movement for the 18 × 24-cm and 24 × 29-cm flexible paddles is 0.62 and 0.61 mm, respectively.
Table 6.
Summary of change in compression force for the clinical audit at time interval (t1–t2)
| Change in compression force | Paddle size, paddle type |
|
|---|---|---|
| 18 × 24 cm, flexible | 24 × 29 cm, flexible | |
| Maximum (N) | 9 | 15 |
| Minimum (N) | 1 | 1 |
| Average (N) | 4 | 4.7 |
| Standard deviation (N) | 2.70 | 3.6 |
t1, point at which compression force ceases to be applied; t2, point at which the exposure terminates.
DISCUSSION
Study limitations
Linear potentiometers
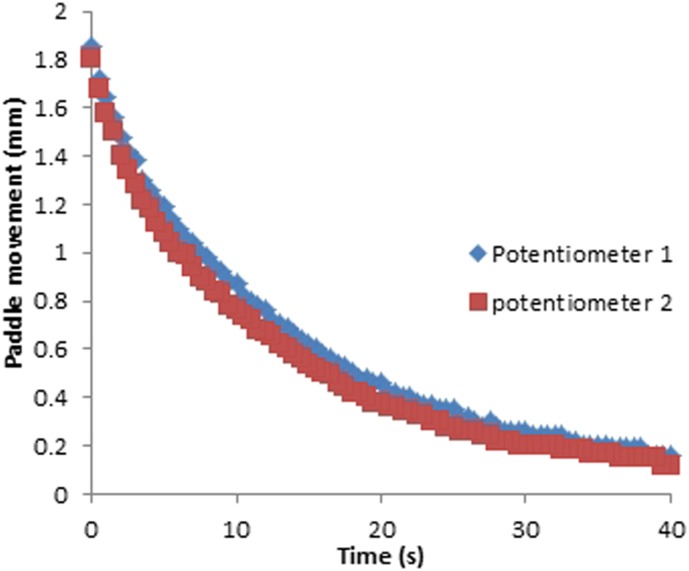
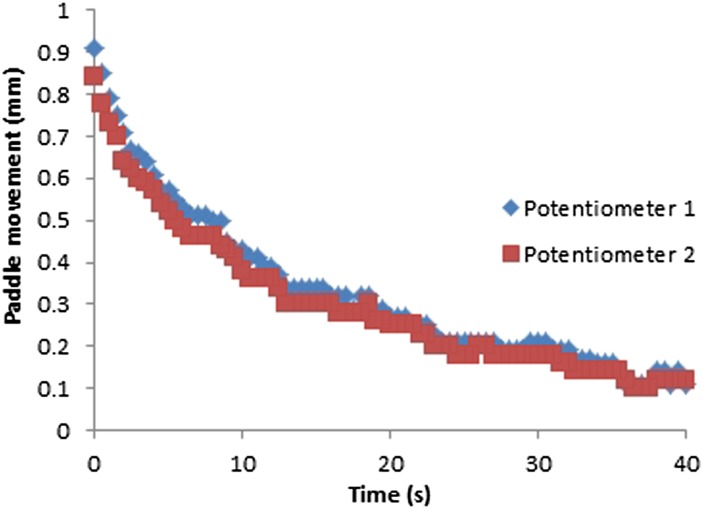
Although there may be a different rate of change between the two measurement points, the difference is not significant. As can be seen in Figures 16 and 17, there is only a slight difference between the paddle movement measured by the two potentiometers for fixed (p = 0.34) and flexible paddles (p = 0.30); this may be owing to paddle tilt during the application of compression that caused the potentiometers to be at slightly different levels. Since the difference between the movements measured by the two potentiometers is insignificant, we averaged the measurements from the two potentiometers to simplify the interpretation and the presentation.
Figure 16.
Paddle movement against time for a 18 × 24-cm fixed paddle.
Figure 17.
Paddle movement against time for a 18 × 24-cm flexible paddle.
Compression force
As the compression force applied was not a rapid-step input, the response of the breast and paddle can begin before the end of the hand-winding period (start of measurement). Therefore, the recorded movement at the paddle after measurement begins may lead to an underestimation of the total movement. In extreme cases, if the winding is too slow, there would be no exponential settling after measurement begins, because it would have all happened during the hand-winding period. Different designs of compression systems among different brands of mammography units may play a significant role in paddle movement. In the human component of our study, only Hologic Selenia Dimensions unit was used. Consequently, we suggest the study should be repeated using a range of manufacturers to determine whether a similar effect will be seen.
Paddle movement
In this study, we recorded only movement of the paddle; we did not identify exactly where the movement occurred. But from the phantom experiment, we have demonstrated there is significant movement that is independent of the patient when a compressible material is used. If the European guidelines are followed and passed, there is no systematic issue with movement, which indicates that the breast response to compression is the dominant factor and should be further investigated.10 The slightly less movement in the flexible paddles that results may be attributed to more lateral retention of the soft tissue than with fixed paddles; however, this has not been verified and could be a focus of future work.
Breast phantom vs real breasts
Breasts vary in shape, size and composition. Our experiment only used one phantom, and consequentially, it did not simulate the range of female breasts. We hypothesize that different phantom designs and female breasts would demonstrate varying characteristics owing to varying tissue composition and size. This is supported by the work of Geerligs et al,8 where the mechanical properties of the adipose tissue have been investigated. They reported that adipose tissue was viscoelastic with thixotropic behaviour at large strains and antithixotropic at small strains. The material is thixotropic if the viscosity decreases with time at constant shear rate, and if the viscosity increases with time at constant shear rate, the material is antithixotropic. In thixotropic behaviour, structural changes occur owing to mechanical loading, and the longer the loading, the more viscous the material becomes; anti-thixotropic materials increase viscosity over time. Further investigation of the thixotropic behaviour of the breast, including glandular tissue, would be valuable in designing novel compression systems.
Perception in blurring
Paddle displacement
According to the European Guidelines for Quality Assurance in Breast Cancer Screening and Diagnosis,10 the acceptable exposure time limit for the standard breast thickness is 2 s. Using the general paddle movement equations developed from the breast phantom data, the estimated movement for the 2-s limit at the 18 × 24-cm and 24 × 29-cm flexible paddles are 0.8 ± 0.2 and 0.6 ± 0.2 mm, respectively. From our clinical audit, the predicted movement during the exposure for 18 × 24-cm and 24 × 29-cm flexible paddles are 0.62 and 0.61 mm, respectively, which is quite close to the estimated value. Logically, movement in the breast, along any vector that results in a lateral pixel movement of >1 subtended pixel at the detector, has the potential to produce blur. The impact of this will be dependent on the relative exposure time of the displaced pixel and the size of the feature of interest. Therefore, considering a 6-cm compressed breast with a feature of relevance at the point of greatest geometric magnification (×1.1), that is, the upper breast, where 1 pixel detector movement is unacceptable, for example, microcalcifications; a vector spatial movement in the breast of 90% of the detector pixel size could result in image blur. For a 0.1-mm detector pixel size, a 0.09-mm spatial movement could therefore result in blur. This is dependent on the displaced element being exposed long enough to produce an appreciable resultant pixel contrast and therefore the rate of change, rather than absolute movement, is the more important metric.
However, presently no published data exist to demonstrate how much movement needs to occur before image degradation (blurring) will be perceived, and further research is needed. With this in mind, we have already commenced two projects; one using a mathematical approach to generate images that have known amounts of simulated movement, and the other was published using experimental approach to identify the image blurring owing to paddle movement14
Key to reduce blurring
For both fixed and flexible paddles, the rate of change of compression force (Newton per second) and the rate of paddle movement, that is, paddle velocity (millimetres per second) is the highest in the first 10 s. The rapid change in paddle movement is probably caused by the rapid change in compression force. One of the possible explanations could be the high rate of change of compression force (decreasing) causing the rapid drop in force acting on the paddle. The decrease in force would cause the reduction in the rate of change of the paddle movement, in other words, deceleration in paddle velocity.
Motion blurring is caused by the rate of paddle movement during exposure, which is caused by the changing compression force. Since the changing compression force is the important factor for motion blurring, minimizing the rate of change of compression force is the key to reduce blurring.
Applications
Delayed exposure
It is known that larger breasts require longer exposures; therefore, to minimize any impact of the extra patient movement, the radiographer/technologist could apply compression force more slowly. If the risk of blur is strongly suspected, or a repeat owing to blur is required, a wait of 15 s from the point at which compression force ceases to be applied, to the point at which the exposure is made, would allow the rate of change of the movement to reach a minimum.
Fixed paddle vs flexible paddles
Data from the phantom experiment show that compared with flexible paddles, fixed paddles have a shorter settling time. This may be owing to the higher decreasing rate of change of compression force or “negative jerk” in fixed paddles, that is, the smaller the compression force on the phantom, the shorter the time taken for the paddle to settle. Therefore, to reduce the risk of blur, it may be advantageous for the radiographer/technologist to use fixed paddles if possible.
System optimization
The settling time to reduce extra patient movement should ideally be as short as possible in order to reduce the possibility of inducing intrapatient movement-induced artefacts. In view of that, manufacturers should conduct further experiments and, if required, introduce design features that lead to shorter settling times. It might also be possible for manufacturers to include a feedback system between rate of change of compression and beginning the exposure or, if thixotropic processes dominate, consider how the compressive force is applied.
CONCLUSIONS
Using a breast phantom, we have shown that there is extra patient movement at the compression paddle during mammographic exposures that can be approximated by a second order motion equation. In vivo movement with real patients has also been proposed to be proportional to the drop in compression force; using this derived relationship, the actual motion can be estimated.
FUNDING
This study is supported by the funding from the Trustees of Symposium Mammographicum
Acknowledgments
ACKNOWLEDGMENTS
The authors would like to thank Mass Measuring Ltd (Manchester, UK) for developing the data logging system used in this study and for the financial support from the Trustees of Symposium Mammographicum.
REFERENCES
- 1.Hogg P, Kelly J, Millington S, Willcock C, McGeever G, Tinston S, et al. Paddle motion analysis: 2012. In: East of England Conference; December 2012; Cambridge, UK. National Health Service Breast Screening Programme, 2012.
- 2.Bushberg JT, Seibert JA, Leidholdt EM, Boone JM. The essential physics of medical imaging. 3rd edn. New York, NY: Williams & Wilkins; 2011. [Google Scholar]
- 3.Fischmann A, Siegmann KC, Wersebe A, Claussen CD, Müller-Schimpfle M. Comparison of full-field digital mammography and film-screen mammography: image quality and lesion detection. Br J Radiol 2005; 78: 312–15. [DOI] [PubMed] [Google Scholar]
- 4.Hogg P, Szczepura K, Kelly J, Taylor J. Blurred digital mammography images. Radiography 2012; 18: 55–6. [Google Scholar]
- 5.Choi JJ, Kim SH, Kang BJ, Choi BG, Song B, Jung H. Mammographic artifacts on full-field digital mammography. J Digit Imaging 2014; 27: 231–6. doi: 10.1007/s10278-013-9641-4 [DOI] [PMC free article] [PubMed] [Google Scholar]
- 6.Hauge I, Hogg P, Szczepura K, Connolly P, McGill G, Mercer C. The readout thickness versus the measured thickness for a range of screen film mammography and full field digital mammography units. Med Phys 2012; 39: 263–71. doi: 10.1118/1.3663579 [DOI] [PubMed] [Google Scholar]
- 7.Kelly J, Hogg P, Millington S, Sanderud A, Willcock C, McGeever G, et al. Paddle motion analysis preliminary research: 2012. In: United Kingdom Radiological Congress; 25–27 June 2012; Manchester, UK. British Institute of Radiology, 2012.
- 8.Geerligs M, Peters GW, Ackermans PA, Oomens CW, Baaijens FP. Does subcutaneous adipose tissue behave as an (anti-)thixotropic material? J Biomech 2010; 43: 1153–9. doi: 10.1016/j.jbiomech.2009.11.037 [DOI] [PubMed] [Google Scholar]
- 9.Moore AC, Dance DR, Evans DS, Lawinski CP, Pitcher EM, Rust A, et al. The commissioning and routine testing of mammographic X-ray systems: a technical quality control protocol. Report no. 89. York, UK: IPEM; 2005. [Google Scholar]
- 10.Perry N, Broeders M, Wolf C, Törnberg S, Holland R, Karsa L, et al. European guidelines for quality assurance in breast cancer screening and diagnosis. 4th edn. Luxembourg: European Communities; 2006. [DOI] [PubMed] [Google Scholar]
- 11.Seeley R, Stephens T, Tate P. Anatomy and physiology. 8th edn. New York, NY: McGraw-Hill Science/Engineering/Math; 2007. [Google Scholar]
- 12.Bell S. Measurement good practice guide no. 11: a beginner's guide to uncertainty of measurement. Issue 2. Teddington, UK: National Physics Laboratory; 1999. [Google Scholar]
- 13.Zill G, Wright S. Advanced engineering mathematics. 5th edn. Boston, MA: Jones & Bartlett Learning, 2012. [Google Scholar]
- 14.Ma WK, Hogg P, Kelly J, Millington S. A method to investigate image blurring due to mammography machine compression paddle movement. Radiography 2014; in press. Epub ahead of print. doi: 10.1016/j.radi.2014.06.004 [DOI] [Google Scholar]


