Abstract
The kidney is an important source of angiotensin-converting enzyme (ACE) in many species, including humans. However, the specific effects of local ACE on renal function and, by extension, BP control are not completely understood. We previously showed that mice lacking renal ACE, are resistant to the hypertension induced by angiotensin II infusion. Here, we examined the responses of these mice to the low-systemic angiotensin II hypertensive model of nitric oxide synthesis inhibition with L-NAME. In contrast to wild-type mice, mice without renal ACE did not develop hypertension, had lower renal angiotensin II levels, and enhanced natriuresis in response to L-NAME. During L-NAME treatment, the absence of renal ACE was associated with blunted GFR responses; greater reductions in abundance of proximal tubule Na+/H+ exchanger 3, Na+/Pi co-transporter 2, phosphorylated Na+/K+/Cl− cotransporter, and phosphorylated Na+/Cl− cotransporter; and greater reductions in abundance and processing of the γ isoform of the epithelial Na+ channel. In summary, the presence of ACE in renal tissue facilitates angiotensin II accumulation, GFR reductions, and changes in the expression levels and post-translational modification of sodium transporters that are obligatory for sodium retention and hypertension in response to nitric oxide synthesis inhibition.
Keywords: ACE, hypertension, kidney, L-NAME, mice
The angiotensin-converting enzyme (ACE) is a carboxypeptidase known for the conversion of angiotensin I into the biologically active angiotensin II. ACE is also known for being the target of ACE inhibitors, a mainstay in the treatment of hypertension. The endothelium and, more specifically, the endothelial lining of the lung are considered by many the main source of ACE.1 Because of this, it is believed that ACE inhibitors lower BP mostly because they inactivate endothelial ACE. However, any interpretation considering endothelial ACE as an important locus for hypertension faces two fundamental challenges: First, many hypertensive patients have normal or low renin levels, which undermine the capacity of endothelial ACE to generate angiotensin II.2,3 Second, ACE inhibitors continue to reduce BP even after plasma angiotensin II levels have returned to normal, a phenomenon known as angiotensin II escape.4,5
In addition to the endothelium, large amounts of ACE are found in renal tissues.6 This is especially true for the human kidney, which makes much more ACE than the kidneys of mice and rats. Indeed, in humans more ACE is found in the kidney than any other organ.7 Hence, on the basis of the important role played by the kidneys in BP control, it is logical to consider the role of renal ACE in hypertension. Such a question is impossible to approach with pharmacologic agents. This is why our group chose to study mice in which targeted homologous recombination was used to manipulate the ACE gene. In a recent report, we investigated the responses of mice lacking renal ACE, termed ACE 3/3 and ACE 10/10 mice, to experimental hypertension.8 Specifically, wild-type and mutant mice were subject to chronic angiotensin II infusion, an experimental model in which the “exogenous” infusion of angiotensin II activates the local renin-angiotensin system (RAS) and induces “endogenous” angiotensin II formation.9 Remarkably, the absence of renal ACE blunted the hypertension induced by angiotensin II infusion.8 This was attributed to the absence of the renal responses observed in wild-type mice, including local angiotensin II accumulation; sodium and water retention; and activation of several key sodium transporters, namely the loop of Henle Na+-K+-2Cl- cotransporter (NKCC2), the distal tubule NaCl cotransporter (NCC), the epithelial sodium channel (ENaC), and pendrin.8 Thus, these findings support the concept that the renal ACE/angiotensin II pathway works as an important regulator of sodium transport along the nephron, and that activation of this pathway plays an obligatory role in the development of experimental hypertension, even in the presence of high plasma angiotensin II levels.
In this study, we investigated the role of renal ACE on the hypertension induced by nitric oxide (NO) synthesis inhibition with the arginine analogue Nω-nitro-L-arginine methyl ester (L-NAME). Several reasons influenced this decision. First, L-NAME–induced hypertension suppresses plasma renin, eliminating the confounding effects of circulating angiotensin II.10,11 Second, previous reports indicate that L-NAME treatment activates the renal RAS.12 Third, we reasoned it would be important to evaluate the role of the renal ACE/angiotensin II pathway in the renal response to the systemic vasoconstriction and antinatriuresis induced by an agent besides angiotensin II. We now report that the renal ACE/angiotensin II pathway plays a dominant role in the hypertension induced by L-NAME; compared with equally treated wild-type mice, mice lacking renal ACE do not develop hypertension. Further, our data indicate that renal ACE-derived angiotensin II facilitates changes in renal sodium handling necessary for the establishment of L-NAME–induced hypertension.
Results
An Important Role of Renal ACE in the Induction of Hypertension by L-NAME
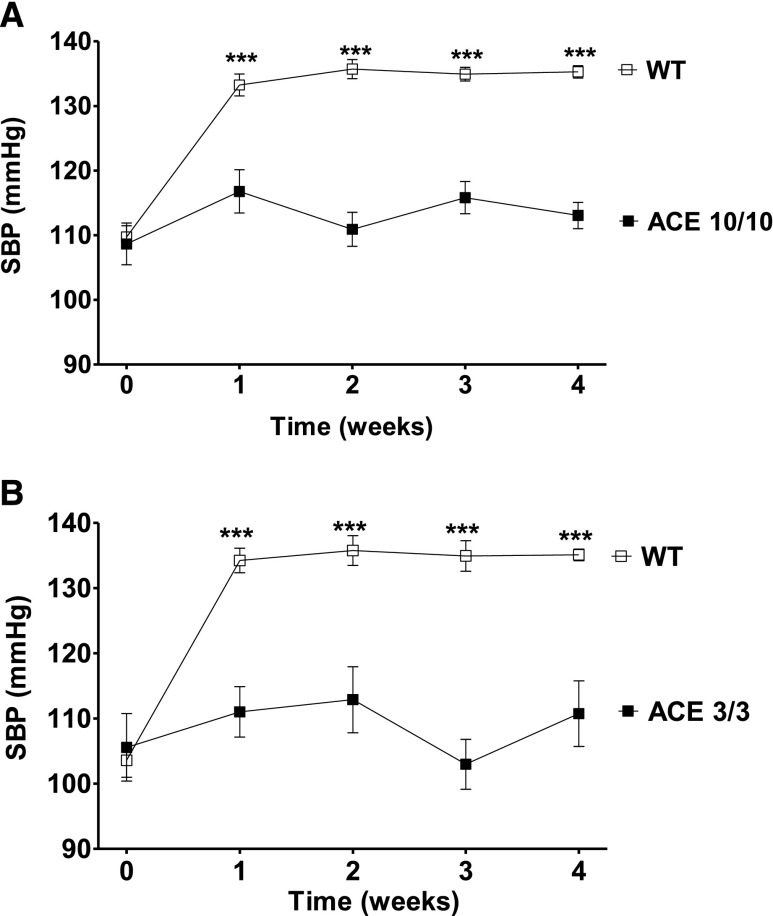
The creation and phenotypes of ACE 10/10 and ACE 3/3 mice are described elsewhere.13,14 The ACE 10/10 mouse is an inbred line (C57Bl/6J) that expresses ACE only in myelomonocytic cells.13 The ACE 3/3 mouse has a mixed background (C57Bl/6–129) and expresses ACE mostly in hepatocytes.14 Both mouse strains have normal circulating levels of ACE; they also have normal BP and normal baseline renal morphology and function. Importantly, in ACE 10/10 mice, renal ACE activity is totally absent, while in the ACE 3/3 mice it is only 14% of wild-type values. Systolic BP was measured, by tail-cuff plethysmography, in wild-type and mutant mice in response to L-NAME (5 mg/10 ml in the drinking water for 4 weeks). This caused a significant systolic BP increase in wild-type mice (Figure 1). In sharp contrast, the BP of ACE 10/10 and ACE 3/3 mice did not increase. After 4 weeks, and compared with their littermate wild-type group, the BP was 22 mmHg lower in the ACE 10/10 mice (P<0.001) (Figure 1A) and 25 mmHg lower in the ACE 3/3 mice (P<0.001) (Figure 1B). These data indicate that two different animal models lacking renal ACE are largely protected against L-NAME–induced hypertension.
Figure 1.
The absence of renal ACE blunts L-NAME–induced hypertension. The systolic BP (SBP) response to L-NAME (5 mg/10 ml in the drinking water) of ACE 10/10 (A), ACE 3/3 (B), and corresponding wild-type (WT) mice was determined by tail-cuff plethysmography. n=6–17. ***P<0.001 versus wild-type mice by two-way ANOVA. Values represent mean±SEM.
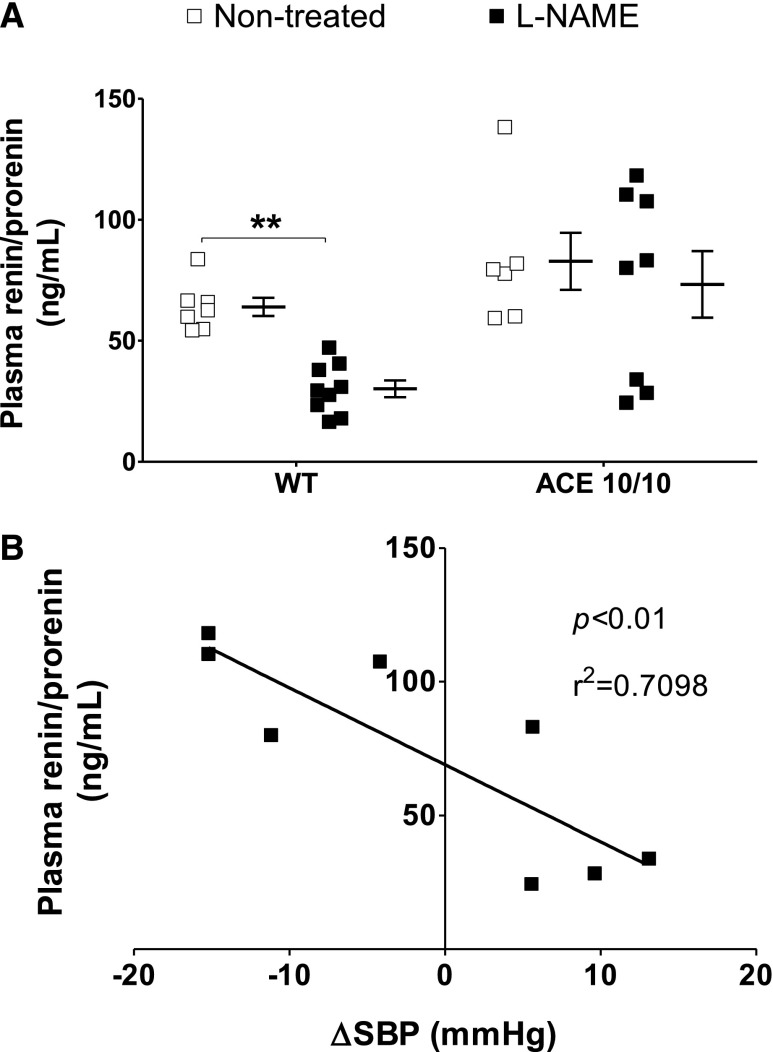
From this point on, experiments were conducted only in the ACE 10/10 mice because the effects of experimental hypertension are better characterized in their genetic background strain (C57BL/6J).15,16 We confirmed that both groups of mice drank similar amounts of water and, thus, received the same amount of L-NAME (Supplemental Figure 1). We also confirmed that body weight was similar in both strains before and after L-NAME (Supplemental Figure 2). We measured urinary nitrite/nitrate (NOx) excretion before and during L-NAME treatment to verify that L-NAME reduced NO availability to a similar extent in wild-type and mutant mice (Supplemental Figure 3). Baseline urinary NOx excretion was similar in wild-type and ACE 10/10 mice. Importantly, after 24 hours of L-NAME, wild-type and mutant mice displayed similar marked reductions of NOx output that remained at this level throughout the experiment. We confirmed that L-NAME treatment strongly suppressed plasma renin/prorenin content in wild-type mice (Figure 2A). In ACE 10/10 mice, such a suppression was not observed; this was likely due to the lower BP of L-NAME–treated ACE 10/10 mice. Indeed, we observed a strong correlation between plasma renin content and BP in this group (Figure 2B).
Figure 2.
L-NAME reduces plasma renin/prorenin concentration in wild-type (WT) but not in ACE 10/10 mice. (A) Circulating renin/prorenin levels were measured after L-NAME treatment (5 mg/10 ml in the drinking water for 4 weeks) by ELISA. Data are presented as individual values and mean±SEM. (B) Negative correlation between systolic BP increase (ΔSBP) and plasma prorenin/renin in ACE 10/10 mice. n=6–9. **P<0.01.
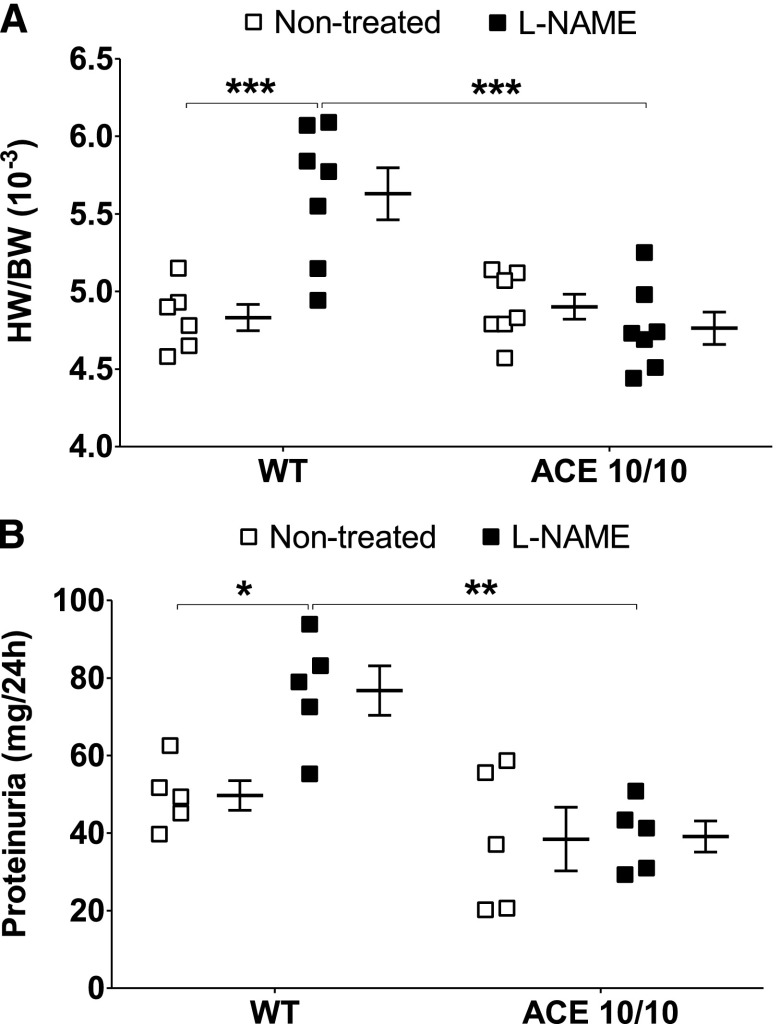
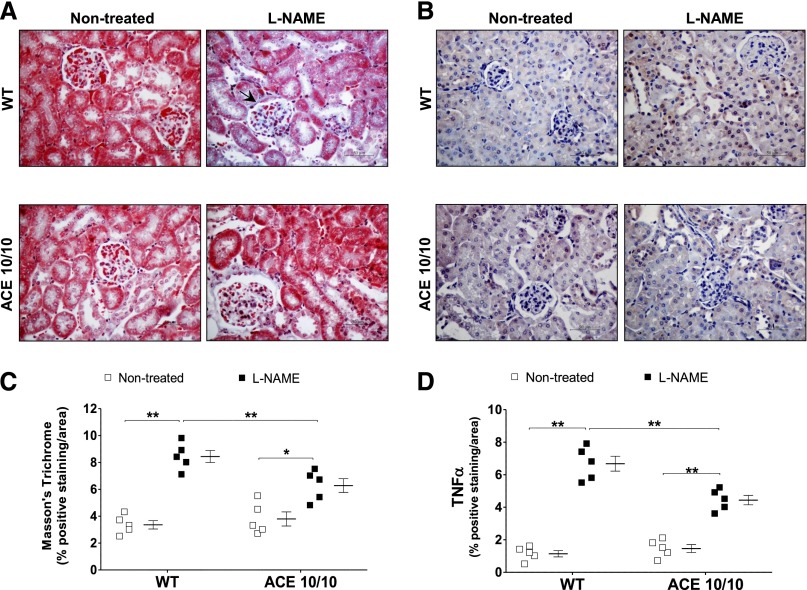
In line with our tail-cuff readings, heart-to-body weight and urinary protein excretion, traditional markers of hypertension-induced target organ damage,17 were significantly increased in L-NAME–treated wild-type mice but not in ACE 10/10 mice (Figure 3). Further, L-NAME induced more collagen deposition (as measured by Masson's trichrome) and inflammation (as measured by TNF-α levels) in kidneys of wild-type mice than in kidneys of ACE 10/10 mice (Figure 4).
Figure 3.
L-NAME induces heart enlargement (A) and proteinuria (B) in wild-type (WT) mice but not in ACE 10/10 mice. Heart weight/body weight (HW/BW) was calculated after L-NAME treatment (5 mg/10 ml in the drinking water for 4 weeks). Urinary protein excretion was assessed in the same group of mice before and after L-NAME. n=5–7. *P<0.05; **P<0.01; *** P<0.001. Values represent individual values and mean±SEM.
Figure 4.
L-NAME induces more renal fibrosis and TNF-α accumulation in wild-type (WT) than in ACE 10/10 mice. Renal sections from nontreated and L-NAME–treated (5 mg/10 ml in the drinking water for 4 weeks) WT and ACE 10/10 mice were stained for collagen accumulation (A, with Masson's trichrome) and TNF-α content (B). Original magnification, X400 in A and B. (C and D) Semiquantification. n=5. *P<0.05; **P<0.01. Data are presented as individual values and mean±SEM.
Renal Angiotensin II and the Local RAS
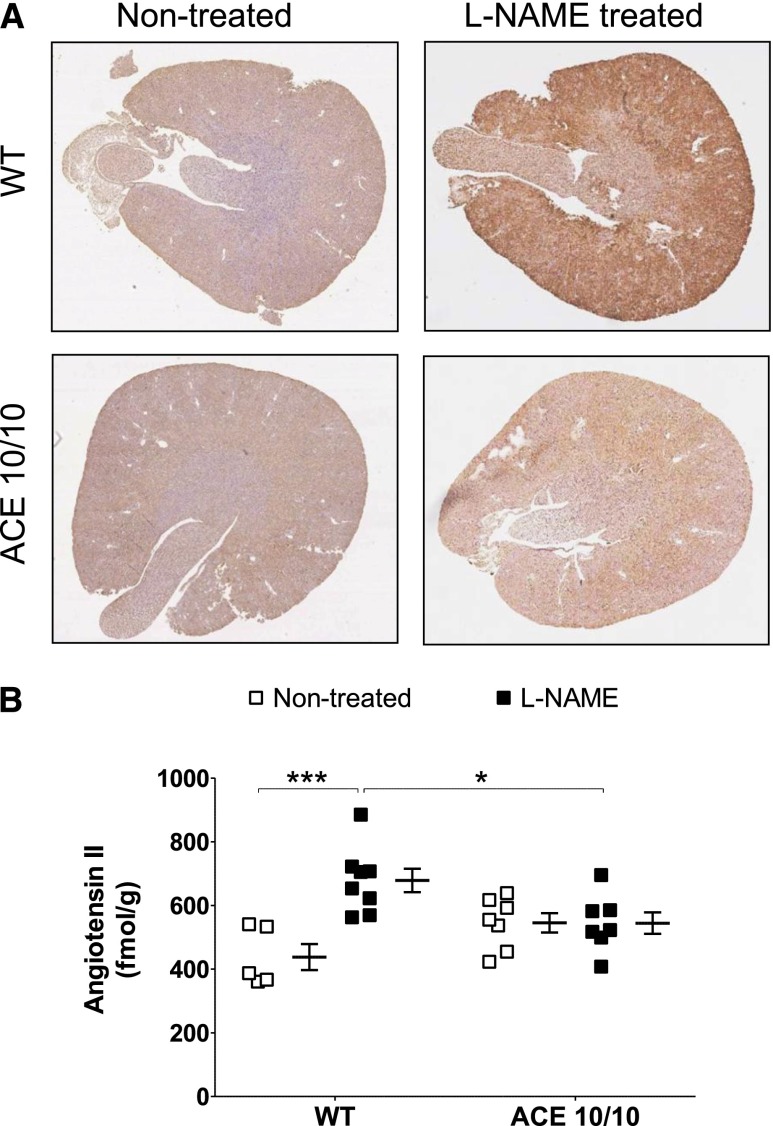
We developed a protocol to measure angiotensin II content by immunohistochemistry (IHC) in the mouse kidney (Figure 5A, Supplemental Figures 4 and 5). Second, we quantified angiotensin II concentration in kidney homogenates by radioimmunoanalysis (Figure 5B).8 For the IHC protocol, preabsorption experiments demonstrated the absence of cross-reactivity with other relevant RAS peptides/proteins, including angiotensin-(1–7) and angiotensinogen.18 We also confirmed minimal anti–angiotensin II staining on kidneys of systemic ACE knockout mice, a mouse strain with very little systemic and kidney angiotensin II (Supplemental Figure 4).19 Finally, we validated our assay by measuring the renal angiotensin II content in histologic samples from angiotensin II–infused mice whose contralateral kidney was used to determine angiotensin II concentration by radioimmunoanalysis (Supplemental Figure 5).8 As previously reported, baseline renal angiotensin II content was similar in wild-type and ACE 10/10 mice (Figure 5, A and B, Supplemental Figure 6). Importantly, renal angiotensin II content increased significantly in wild-type mice after L-NAME treatment (1.6-fold increase over nontreated mice; P<0.01 by radioimmunoassay), but not in the ACE 10/10 mice (Figure 5B). These changes were confirmed by IHC analysis (Supplemental Figure 6). Thus, the blunted BP response of ACE 10/10 mice is accompanied by a lack of renal angiotensin II accumulation in response to L-NAME.
Figure 5.
The absence of renal ACE prevents renal angiotensin II accumulation during L-NAME–induced hypertension. (A) Representative whole-kidney sections from nontreated and L-NAME–treated (5 mg/10 ml in the drinking water for 4 weeks) wild-type (WT) and ACE 10/10 mice were stained for angiotensin II. Brown staining indicates angiotensin II–positive areas. Original magnification, X30 in A. (B) Angiotensin II quantification by radioimmunoassay in kidney homogenates. n=6–8. *P<0.05; ***P<0.001. Data are presented as individual values and mean±SEM. Both assays were performed with the same antibody.
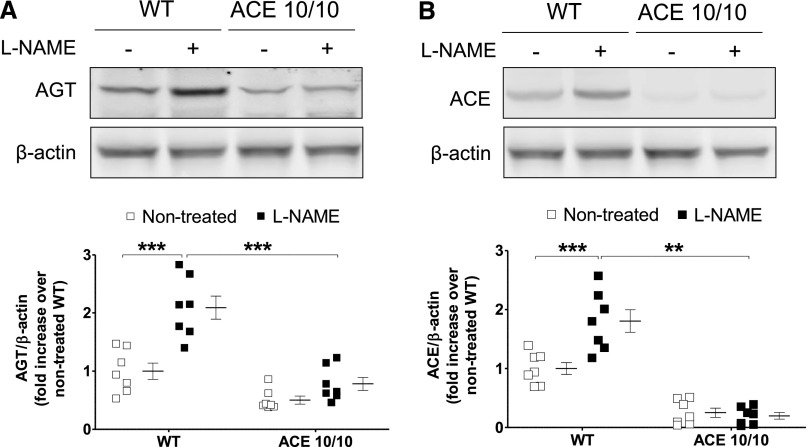
In view of the differential regulation of renal angiotensin II content, the expression of key renal RAS components was analyzed.20 As previously reported, baseline angiotensinogen levels were significantly higher in kidneys from wild-type versus ACE 10/10 mice (1.0±0.2 versus 0.48±0.05 arbitrary units [AU]; P<0.05) (Figure 6A).8 After L-NAME, renal angiotensinogen protein significantly increased in wild-type (from 1.0±0.2 to 2.3±0.3 AU; P<0.01), but not in the mutant mice (from 0.48±0.05 to 0.7±0.1 AU; P=NS) (Figure 6A). As expected, renal ACE content in the ACE 10/10 mice was negligible (Figure 6B). Further, L-NAME caused a significant increase in renal ACE expression in wild-type mice (from 1.0±0.1 to 1.9±0.3 AU; P<0.001) that was not observed in the ACE 10/10 mice (from 0.3±0.1 to 0.16±0.07 AU; P=NS).
Figure 6.
Renal angiotensinogen (A) and ACE (B) abundances increase during L-NAME–induced hypertension in wild-type (WT) mice but not in ACE 10/10 mice. Target proteins were analyzed by Western blot in total kidney homogenates of nontreated and L-NAME–treated (5 mg/10 ml in the drinking water for 4 weeks) WT and ACE 10/10 mice. AGT, angiotensinogen. n=5–7. **P<0.01; ***P<0.001. Data are presented as individual values and mean±SEM.
L-NAME Treatment Is Natriuretic in the Absence of Renal ACE
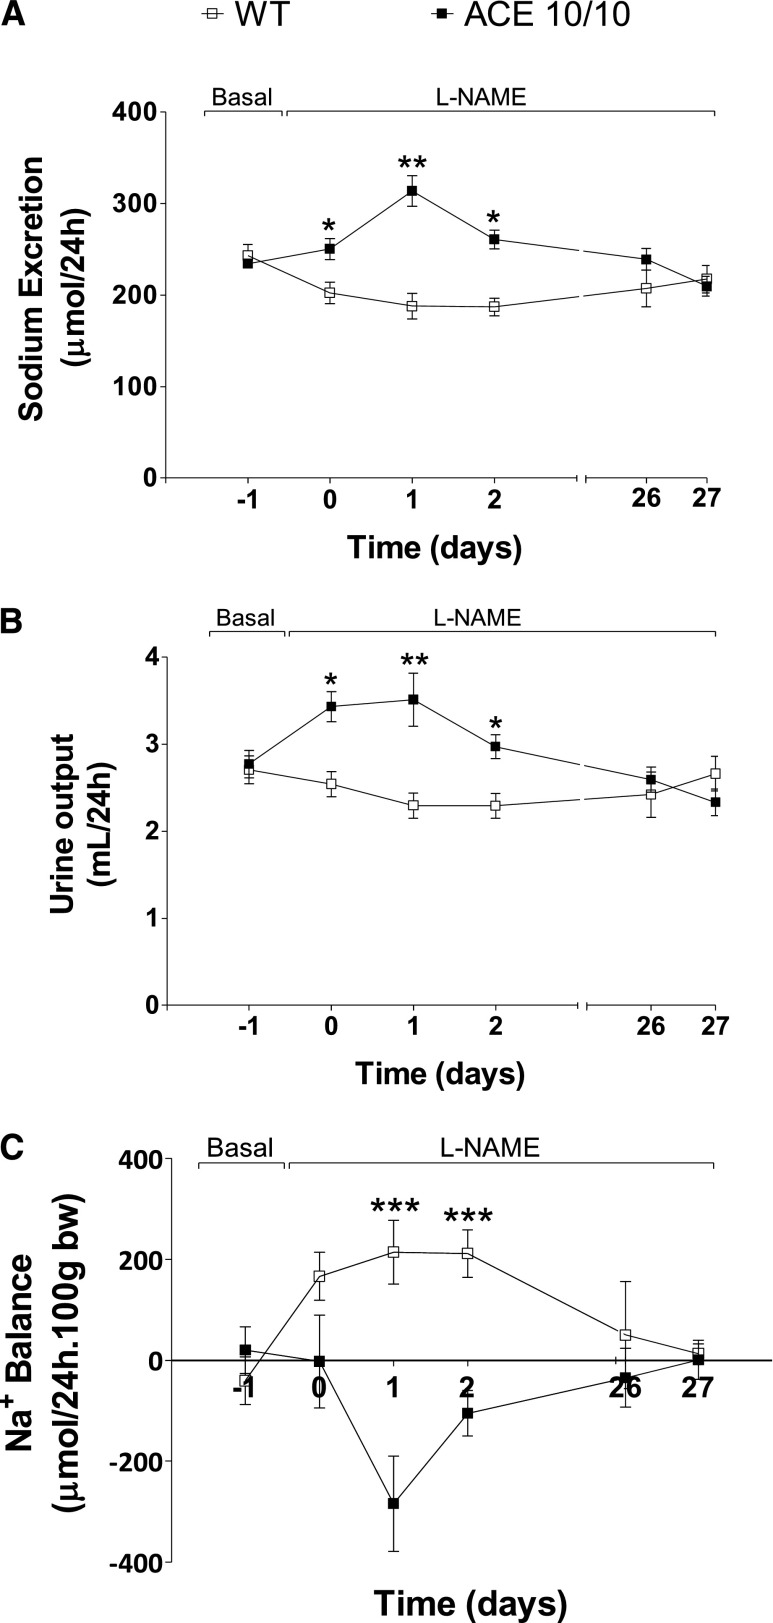
The next step was to investigate the renal response to L-NAME. For this, wild-type and mutant mice were housed individually in metabolic cages to determine daily sodium and urine output. Baseline sodium and urine excretion were similar in both strains (Figure 7). During L-NAME treatment, urinary sodium and volume excretion of wild-type mice showed small but significant reductions during the first 72 hours. After this, they returned to pretreatment levels. In this group, daily sodium excretion went from 243±12 µmol/d at baseline to 202±11, 188±14, and 187±10 µmol/d at day 0 and days 1 and 2 after L-NAME treatment (P<0.01). In sharp contrast, ACE 10/10 mice responded to L-NAME with significant natriuresis. Indeed, baseline sodium excretion was increased from 234±5 µmol/d to 250±12, 313±17, and 260±10 µmol/d at day 0 and days 1 and 2 after L-NAME treatment (P<0.001). A similar pattern was observed with analysis of urine output (Figure 7B). By the end of the experiment, sodium and water excretion were similar in wild-type and ACE 10/10 mice. Importantly, these changes cannot be attributed to water and food consumption fluctuations because those remained unchanged in both groups throughout the experiment (Supplemental Figure 1). Moreover, we confirmed that baseline sodium balance in wild-type mice and ACE 10/10 was neutral. During L-NAME treatment, wild-type mice showed a net positive balance that returned to basal levels by the end of the experiment (Figure 7C). In marked contrast, ACE 10/10 mice responded to L-NAME with a negative balance that was later corrected.
Figure 7.
The absence of renal ACE is associated with enhanced 24-hour sodium (A) and urine output (B) and negative sodium balance (C) in response to L-NAME. Wild-type (WT) and ACE 10/10 mice were housed individually in metabolic cages with free access to food and water before and during L-NAME treatment (5 mg/10 ml in the drinking water for 4 weeks). n=8–10. *P<0.05; **P<0.01; ***P<0.001. Values represent mean±SEM of daily averages.
Renal ACE and GFR
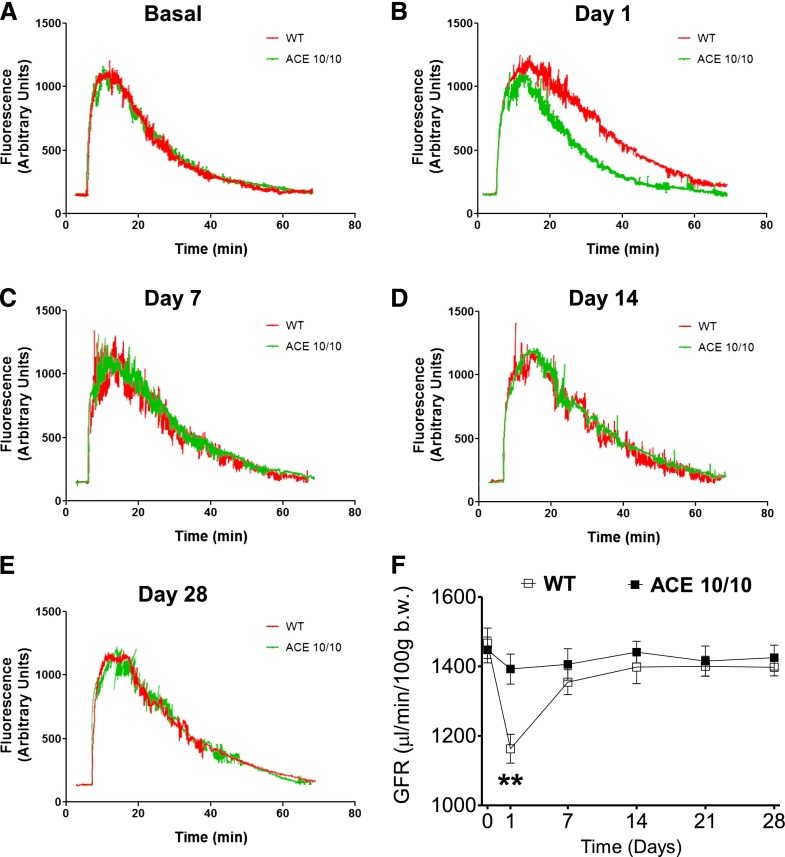
The previous observations prompted a more detail investigation of renal function during L-NAME treatment. We first measured GFR by the transcutaneous method described by Schreiber et al.21 In this, GFR is calculated from the excretion kinetics of a single intravenous bolus of fluorescein isothiocyanate (FITC)-sinistrin in conscious, unrestrained animals, measured using a miniaturized detector secured to the back of the mouse. At baseline, the GFR of wild-type and ACE 10/10 mice was indistinguishable (1467±43 versus 1448±37 μl/min per 100 g body wt; P=NS) (Figure 8). These numbers are similar to what has been reported previously in healthy mice.21 L-NAME induced an acute GFR reduction (first 24 hours) in wild-type mice that returned to pretreatment levels after 7 days (from 1467±43 to 1163±42 μl/min/100 g body wt; P<0.01) (Figure 8). In contrast, the GFR in ACE 10/10 mice remained unchanged throughout the experiment (Figure 8). Thus, the absence of renal ACE prevented the acute reductions in GFR observed in wild-type mice.
Figure 8.
L-NAME treatment induces acute GFR reductions in wild-type mice (WT) but not in the ACE 10/10 mice. (A–E) Excretion kinetics of FITC-sinistrin of WT and ACE 10/10 mice before and during L-NAME–induced hypertension (5 mg/10 ml in the drinking water for 4 weeks). Only one representative curve per group is presented. (F) Group GFR estimations based on elimination half-life of a single intravenous bolus of FITC-sinistrin. Fluorescent signal was detected with a miniaturized device attached to the back of conscious mice. n=8. **P<0.01 versus ACE 10/10 mice. Values represent mean±SEM.
Renal ACE and Renal Sodium Transporter Profile
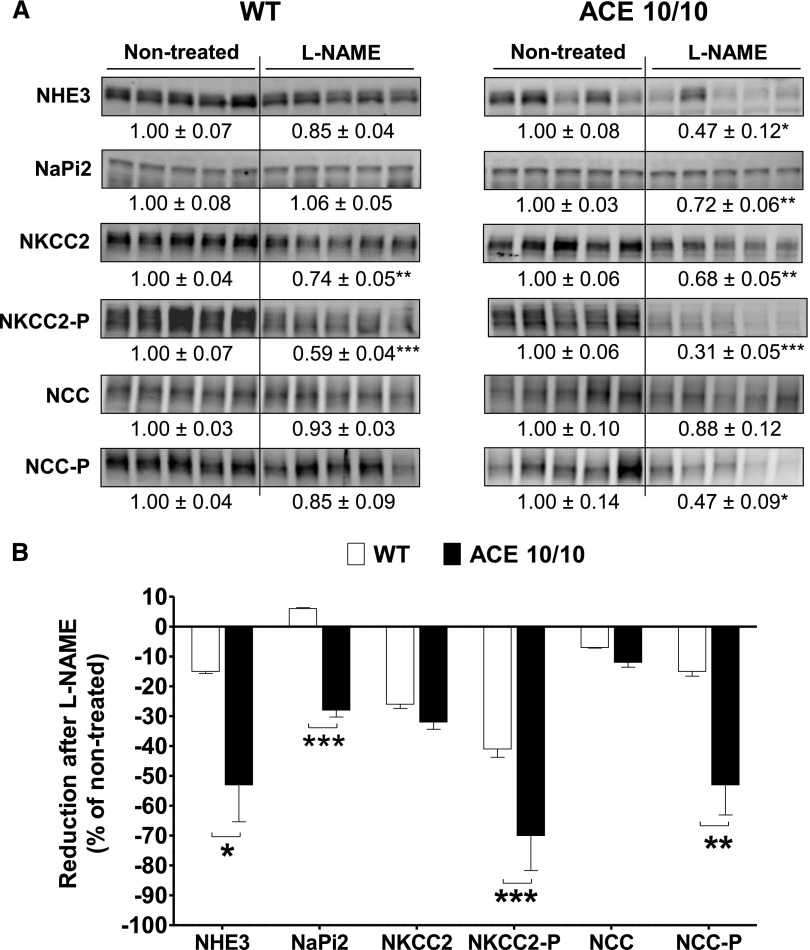
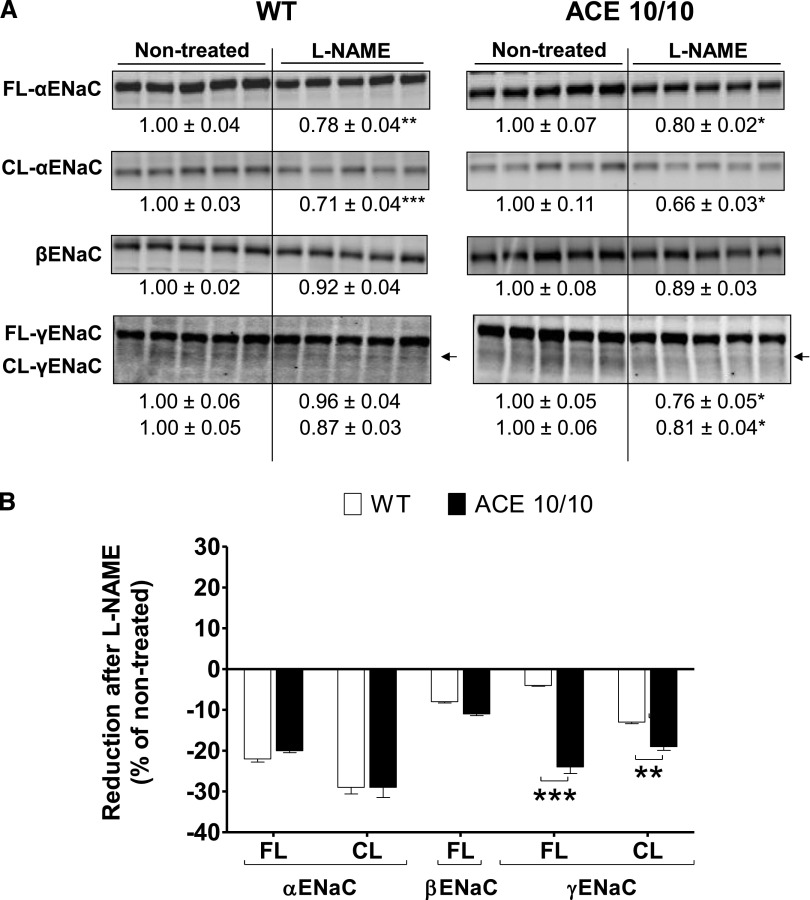
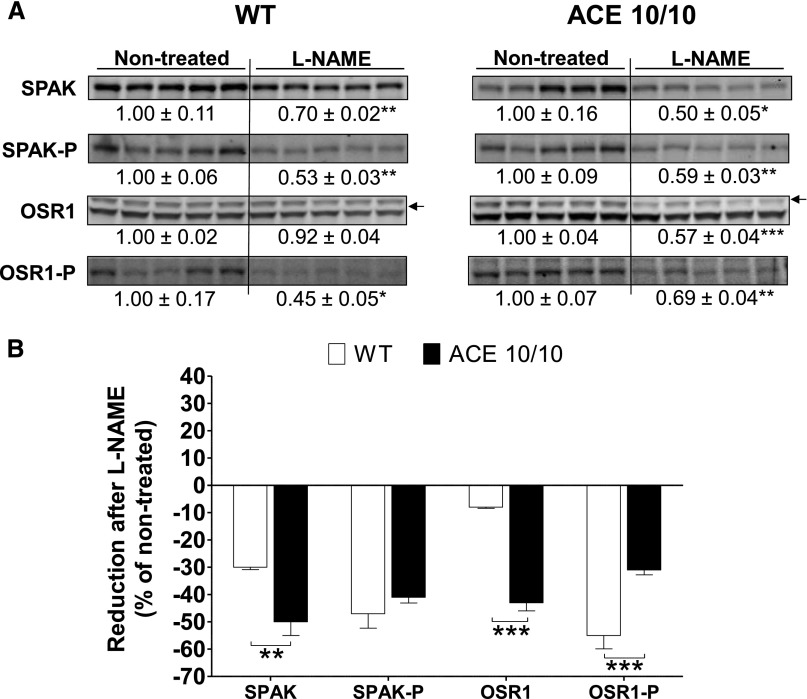
We previously reported that the renal ACE/angiotensin II pathway is an important regulator of sodium transporters along the nephron.8 Accordingly, an extensive transporter profiling was conducted in total kidney homogenates from wild-type and ACE 10/10 mice after L-NAME treatment. At baseline, the transporter profiles of wild-type and ACE 10/10 mice did not differ.8 In wild-type mice, L-NAME treatment did not increase any transport abundance or phosphorylation. Instead, chronic NOS inhibition reduced abundance and phosphorylation of loop of Henle NKCC2 by 26% and 41%, respectively (Figure 9A, left), and abundance of ENaC α-subunit and its cleavage by 22% and 29%, respectively (Figure 10A, left). In addition, the abundance and phosphorylation of the activator kinases Sterile 20 (STE20)/SPS1-related proline/alanine-rich kinase (SPAK) and the oxidative-stress responsive kinase 1 (OSR1) were reduced by 30% (total SPAK), 47% (SPAK-P), and 55% (OSR1-P) (Figure 11A, left). These changes would theoretically promote sodium and volume excretion as an adaptive, yet incomplete, pressure-induced natriuretic response to NOS inhibition. In the ACE 10/10 mice, mice that lack renal ACE and fail to accumulate angiotensin II, the reductions in transporters were far more extensive and pronounced: Proximal tubule Na+/H+ exchanger 3 (NHE3) and Na+/Pi cotransporter 2 (NaPi2), not affected by L-NAME in wild-type mice, decreased by 53% and 28%, respectively. Total NKCC2 and NKCC2-P decreased by 32% and 69%, respectively. Distal tubule NCC-P, unchanged in wild-type mice, decreased by 53% (Figure 9A, right). Further, while ENaC α-subunit and its cleavage were reduced in ACE 10/10 to the same extent as in wild-type mice, total and cleavage forms of ENaC γ-subunit were significantly reduced in L-NAME–treated ACE 10/10 mice by 24% and 19%, respectively (Figure 10A, right). In addition, total SPAK and total OSR1 were reduced by 50% and 43%, respectively, and their phosphorylation levels by 41% and 31%, respectively (Figure 11A, right). In summary, abundance, phosphorylation, or processing of NHE3, NaPi2, NKCC2, NCC, γ-ENaC, SPAK, and OSR1 were substantially more reduced in L-NAME–treated ACE 10/10 than in equally treated wild-type mice (Figures 9B, 10B, and 11B). These observations strongly suggest that the enhanced natriuresis of ACE 10/10 mice in response to L-NAME is due to significant reductions in renal sodium reabsorptive capacity.
Figure 9.
The absence of renal ACE amplifies reductions in abundance and/or phosphorylation of NHE3, NaPi2, NKCC2, and NCC observed during L-NAME–induced hypertension. (A) Transporter expression was analyzed in whole renal homogenates from nontreated and L-NAME–treated (5 mg/10 ml in the drinking water for 4 weeks) wild-type (WT) and ACE 10/10 mice. Immunoblots were performed with a constant amount of protein per lane. Relative abundance from each group is displayed below corresponding blot as mean±SEM. n=6–8 per group. *P<0.05; **P<0.01; ***P<0.001 versus corresponding nontreated mice. (B) Bars represent the relative reduction versus nontreated mice (set as 0). *P<0.05; **P<0.01; ***P<0.001.
Figure 10.
The absence of renal ACE amplifies reductions in abundance and processing of γ-ENaC during L-NAME–induced hypertension. (A) The expression of α, β and γ-subunits of ENaC were analyzed in whole renal homogenates from nontreated and L-NAME–treated (5 mg/10 ml in the drinking water for 4 weeks) wild-type (WT) and ACE 10/10 mice. Immunoblots were performed with a constant amount of protein per lane. Relative abundance from each group is displayed below corresponding blot as mean±SEM. n=5 per group. *P<0.05; **P<0.01; ***P<0.001 versus corresponding nontreated mice. (B) Bars represent the relative reduction versus nontreated mice (set as 0) of full-length (FL), cleaved (CL) ENaC subunits. **P<0.01; ***P<0.001.
Figure 11.
The absence of renal ACE amplifies reductions in SPAK and OSR1 protein abundance during L-NAME–induced hypertension. (A) Renal sodium transporter profiling: transporter expression was analyzed in whole renal homogenates from nontreated and L-NAME–treated (5 mg/10 ml in the drinking water for 4 weeks) wild-type (WT) and ACE 10/10 mice. Immunoblots were performed with a constant amount of protein per lane. Relative abundance from each group is displayed below corresponding blot as mean±SEM. n=5 per group. *P<0.05; **P<0.01; ***P<0.001 versus corresponding nontreated mice. (B) Bars represent the relative reduction versus nontreated mice (set as 0). **P<0.01; ***P<0.001.
Discussion
In considering the importance of ACE in human hypertension, one needs to look no further than the remarkable BP-lowering effects of ACE inhibitors. On the basis of the observation that endothelial ACE is shed into the bloodstream, many investigators have tried, with very limited success, to show an association between systemic ACE activity and hypertension. Meanwhile, much less is known about the role played by ACE expressed in other organs. This is particularly relevant to the kidney because large amounts of ACE are made locally, with potentially broad influences on renal function and, ultimately, on BP.6 Here, we approached this issue by investigating the responses of mice with no or minimal amounts of renal ACE to the hypertension induced by nitric oxide synthesis inhibition. Our results show a very novel finding, namely that two different mouse models with the commonality of having no or minimal amounts of renal ACE respond to L-NAME, a low plasma renin hypertension model, with blunted hypertension.
We present two lines of evidence supporting a renal mechanism as the key reason for the conferred protection of the mutant mice. First, while there were marked activation of the renal RAS and significant renal angiotensin II accumulation in L-NAME–treated wild-type mice, this was absent in the ACE 10/10 mice. The role of renal RAS versus the systemic RAS in hypertension is still a point of contention.9,22 Although most investigators agree that overexpression of RAS components along the nephron results in hypertension,23–26 the question becomes whether the local RAS works as a separate entity or whether it represents an extension of the systemic RAS.9,27 Our data argue in favor of the former hypothesis. L-NAME was purposely chosen because it suppresses plasma renin activity,10,11 minimizing potential contributions of the systemic RAS. Moreover, in agreement with previous reports,12 L-NAME increased the renal abundance of several local RAS components, including angiotensinogen, ACE, and the AT1 receptor. This is likely due to L-NAME–driven renal inflammation and oxidative stress,28 which can override the physiologic regulation of the local renal RAS and induce its activation.9
The second important point supporting a renal protective mechanism in the ACE 10/10 mice is a fundamental change in sodium handling in response to L-NAME. In L-NAME–treated ACE 10/10 mice, the lack of renal ACE was associated with strong natriuresis, whereas in equally treated wild-type mice this was not observed. Even more important, ACE 10/10 mice responded to L-NAME with a negative sodium balance, whereas equally treated wild-type mice displayed a positive sodium balance that was corrected at the expense of hypertension. According to the kidney-fluid hypothesis of Guyton, an increase in systemic BP should trigger a corresponding natriuretic and diuretic response that eventually normalizes BP.29 That such a response was absent in the wild-type mice indicates a shift in the pressure-natriuresis relationship toward hypertension facilitated by renal ACE. Fundamentally, this major change can occur via two mechanisms: (1) changes in renal hemodynamics affecting GFR and/or (2) changes in sodium transport.
L-NAME–treated wild-type mice showed an early GFR reduction that returned to pretreatment levels. In contrast, the GFR in ACE 10/10 mice remained unchanged throughout the experiment. This is despite clear data that L-NAME inhibited NO production. Two considerations can be derived from these findings. First, the initial GFR reduction in wild-type mice may be triggered by the vasoconstrictor effects of L-NAME or changes in the tubuloglomerular feedback mechanism. In early stages, the sensitivity of the tubuloglomerular feedback mechanism is probably increased due to both a reduction of NO availability (a negative modulator of tubuloglomerular feedback mechanism) and angiotensin II accumulation (a positive modulator of tubuloglomerular feedback mechanism).30,31 In this context, the lack of such an initial GFR reduction in the mutant mice is not a surprising result. Previous micropuncture studies showed that the absence of tissue-bound ACE blunts the tubuloglomerular feedback mechanism response.32 In addition, our mice lack endothelial ACE, perhaps reducing angiotensin II availability in the renal vasculature. The second and more important consideration is that modulation of glomerular hemodynamics and/or GFR by renal ACE plays an important role in the initial hypertensive response to L-NAME.
Many investigators believe that an imbalance between NO and angiotensin II is at the core of hypertension as well as many forms of CKD.33,34 While angiotensin II is a vasoconstrictor and sodium-retaining hormone, NO is a vasodilator and natriuretic. We explored how these signals are integrated along the nephron by profiling abundance and phosphorylation of sodium transporters and their regulatory kinases in response to systemic NO inhibition. In wild-type mice, L-NAME both inhibits whole-body NO production and stimulates intrarenal angiotensin II accumulation, giving rise to hypertension, secondary to the lack of the vasodilatory and natriuretic NO and the enhanced antinatriuretic effect of local angiotensin II. The kidney responds with adaptations that facilitate natriuresis, including decreases in abundance and phosphorylation of NKCC2, OSR1, and SPAK, as well as decreased ENaC. In mice with no kidney ACE and no accumulation of antinatriuretic angiotensin II, more extensive and substantial natriuretic adaptations are recruited along the entire nephron, including decreases in proximal NHE3 and NaPi2, further decrease in NKCC2-P, decrease in NCC phosphorylation, further decreases in total SPAK and OSR1, and γ-ENaC modulation. Hence, the transporter profile from the ACE 10/10 kidneys is consistent with an enhanced natriuresis and diuresis that is sufficient to maintain baseline BP in the face of systemic vasoconstriction due to NO depletion. Said another way, our transporter profiling revealed specific effects of renal angiotensin II induced by NO depletion that counteract or prevent downregulation of NHE3 and NaPi2, dephosphorylation of NKCC2 and NCC, and reductions in the abundance and processing of γ-ENaC. In total, these observations strongly suggest that the renal ACE/angiotensin II pathway acts, in this model of hypertension, as a functional positive clamp for sodium transport along the nephron.
We previously reported that the kidneys from angiotensin II–infused wild-type mice display increases in total protein abundance, phosphorylation, and processing of several key sodium transporters, most prominently NKCC2 and NCC.8 In the absence of these changes in equally treated ACE 10/10 mice, we concluded that the renal ACE/angiotensin II pathway is a master switch for sodium transport in the nephron. This is somewhat different from what we observed in L-NAME–treated wild-type mice. L-NAME hypertension is characterized by low systemic angiotensin II, generalized vasoconstriction due to lack of NO synthesis, decreased medullary blood flow and medullary O2 availability coupled to increased reactive oxygen species and interstitial hydrostatic pressure.35,36 These factors can theoretically counterbalance the antinatriuretic potential of local angiotensin II on sodium transport and deserve further analysis. Regardless of the differences in transporter profile between angiotensin II infusion and L-NAME–induced hypertension, the overall effect is the same: The presence of renal ACE is always coupled with an increased tubular reabsorptive capacity from the proximal tubule through distal segments.
In conclusion, renal ACE plays an essential role in the hypertension induced by nitric oxide synthesis inhibition. This is because the renal ACE/angiotensin II pathway elicits renal sodium retention through its modulatory effects on the renal vasculature and sodium transport. Therefore, we propose that the study of renal ACE and its downstream targets may improve our ability to treat conditions in which there is decreased NO availability, as seen in many forms of CKD.
Concise Methods
Animals and Experimental Hypertension
The generation of ACE 10/10 and ACE 3/3 mice was described elsewhere.13,14 Shortly, targeted homologous recombination was used to place the ACE gene under the control of the c-fms promoter (ACE 10/10 mice) or the albumin promoter (ACE 3/3 mice). These changes resulted in restricted expression of ACE to myelomonocytic cells and the liver, respectively. ACE 10/10 mice were backcrossed to a pure C57BL/6J background. Experiments were conducted in 8- to 12-week-old male mice of either strain and wild-type mice of the corresponding genetic background.13,14 Hypertension was induced by a 4-week course of L-NAME (5 mg/10 ml in the drinking water). BP was monitored by tail-cuff plethysmography every 3 days in previously trained mice using a Visitech BP2000 system (Visitech Systems Inc., Apex, NC). All the experiments were conducted under the approval of the Cedars-Sinai Institutional Animal Care and Use Committee.
Metabolic Studies
Mice were individually housed in metabolic cages for urine sampling and for monitoring of water and food consumption. To avoid urine contamination with food and feces, mice were fed a gelled diet containing all necessary nutrients (Nutra-gel; Bio-Serv, Frenchtown, NJ). Free access to water was provided at all times. After 3 days of baseline collection, L-NAME was added to the drinking water. Mice remained in the metabolic cages for 3 additional days. At the end of the experiment, mice were placed back in metabolic cages for 2 days. Urinary sodium and protein concentration were determined by flame photometry and the micro bicinchoninic acid assay method, respectively. NO synthase inhibition was confirmed by measuring urinary excretion of NO metabolites using a commercially available kit (Promega Corp., Fitchburg, WI). Values were adjusted to urine volume to calculate daily excretion.
Transcutaneous Measurement of GFR
This method is based on measuring the excretion kinetics of a single intravenous bolus of FITC-sinistrin. GFR is calculated using (1) the half-life derived from the rate constant (α2) of the single exponential phase of the FITC-sinistrin excretion curve and (2) a semiempirical conversion factor, as validated in rats and mice.21,37 This approach has several advantages over more traditional methods: It is less invasive, is not subject to confounding effects of anesthesia, and does not require terminal surgery. A miniaturized device (NIC-Kidney; Mannheim Pharma & Diagnostics, Mannheim, Germany) is fixed on the previously shaved back of the mouse. The device is equipped with two light-emitting diodes that transcutaneously excite FITC-sinistrin at 480 nm and a photodiode to detect the emitted light signal at 521 nm.21,37 The general protocol consisted of a resting baseline period of 10 minutes, after which FITC-sinistrin was injected through the retro orbital sinus (15 mg/100 g body wt, dissolved in 0.1 ml sterile saline solution). For this procedure, mice were briefly anesthetized with inhalatorial isoflurane. Mice were placed back into standard cages for the remaining of the experiment (approximately 1 hour). Data are collected (60 measurements/min) and stored in the internal memory of the microcontroller.21,37 After collection, the device was detached from the mouse and the data were retrieved.
Tissue Harvesting, Radioimmunoanalysis, and Histologic Analyses
After 4 weeks of L-NAME, mice were euthanized and both kidneys were quickly excised. Angiotensin II levels were measured in homogenates from the left kidney by radioimmunoanalysis as previously described.38 For immunohistochemical determination of angiotensin II, the right kidney was decapsulated, cut longitudinally, fixed in phosphate-buffered 10% formaldehyde (pH, 7.2), and embedded in paraffin as reported elsewhere.18 Sections were deparaffinized with xylene, rehydrated through a graded series of ethanol to water, and then incubated in blocking solution (1% bovine serum–enriched PBS) at room temperature for 1 hour. The sections were blocked with 3% H2O2 and incubated overnight with rabbit anti–angiotensin II antibody diluted with blocking solution (1:300; Phoenix Pharmaceuticals, Inc., Burlingame, CA) or a monoclonal antibody against TNF-α (1:50; R&D Systems, Minneapolis, MN). Negative controls consisted of histologic sections incubated with PBS (or rabbit preimmune serum) rather than the primary antibody. Immunostaining was carried out with an avidin-biotin-peroxidase complex and counterstained with hematoxylin. For renal fibrosis, Masson's trichrome staining was performed as described elsewhere.18 Stained slides were scanned with a Leica SCN400 Slide Scanner (Buffalo Grove, IL), and digital images of whole cross-sections of the kidneys were saved for analysis. A total of 20 random fields from each kidney were viewed at 400× magnification and analyzed with ImageJ (version 1.46r; National Institutes of Health, Bethesda, MD). Averaged results were expressed as percentage of positive staining area per total area.18
Total Plasma Renin/Prorenin Concentration
For this, trunk blood was collected in EDTA tubes. After plasma extraction, total renin/prorenin concentration was determined by ELISA following the kit manufacturer’s recommendation (Mouse Prorenin/Renin Total Antigen Assay; Molecular Innovations, Novi, MI).
Immunoblotting: Renal RAS and Sodium Transporter Profile
The left kidney was snap-frozen and preserved at −80°C for subsequent protein immunoblotting. To determine protein abundance of angiotensinogen and ACE, whole kidneys were thawed and homogenized in solubilization buffer containing phosphatase and protease inhibitors. Tissue extracts were centrifuged at 3000 g for 30 minutes at 4°C to eliminate insoluble material. Protein concentration was determined by the bicinchoninic acid assay method and equal amount of solubilized proteins (20 μg) were denatured in SDS-PAGE sample buffer (10 minutes, 80°C). Samples were resolved by SDS-PAGE, transferred to polyvinylidene difluoride (PVDF) membranes (Millipore Immobilon-FL; EMD Millipore, Billerica, MA), blocked (Odyssey blocking buffer, Lincoln, NE), and then probed with antibodies against angiotensinogen (1:500 dilution; Sernia, Queensland) and ACE (1:500 dilution, SC-12187; Santa Cruz Biotechnology, Santa Cruz, CA). Equivalent protein loading was confirmed by reprobing membranes with anti–β-actin antibody (1:5000 dilution; Sigma-Aldrich, St. Louis, MO).
For transporter profiling, PVDF membranes were probed with specific antibodies against NHE3 and NaPi2 (1:2000; McDonough laboratory), NKCC2 (1:1000; C. Lytle, UCR), phospho Thr96/Thr101-NKCC2 (1:2000; Forbush, Yale), NCC (1:2000; McDonough laboratory), phosho Ser71-NCC, α-ENaC (1:1000; J. Loffing, U. Zurich), β- and γ-ENaC (1:1000; Palmer, Cornell), SPAK (1:3000; Delpire, Vanderbilt), OSR1, and phospho-SPAKpS373/OSR1pS325 (1:1000; DSTT, Dundee, UK) as described.8 After extensive washing, membranes were incubated with the appropriate fluorochrome-labeled antibodies. To verify uniform loading, loading gels were run (5 μg/lane) and stained with Coomassie blue, and random bands were quantified. Linearity of signal intensity was established by loading 1 and 1/2 amounts of each sample on each gel to verify doubling of signal intensity. Signals on immunoblots were detected and quantitated with Odyssey Infrared Imaging System (Li-COR, Lincoln, NE) and accompanying software. Values were normalized to mean intensity of nontreated wild-type group defined as 1.0.
Statistical Analyses
All data are presented as individual measurements along with mean±SEM. Two-way ANOVA with Bonferroni post-test was used to analyze changes in data collected over time. One-way ANOVA and unpaired t test were used to analyze differences between nontreated and treated mice within the same genotype or to assess the differences between wild-type and mutant mice when appropriate. All statistical tests were calculated using GraphPad Prism 5.00 (GraphPad Software, San Diego, CA). P<0.05 was regarded as denoting statistically significant differences.
Supplementary Material
Acknowledgments
This study was supported by NIH grants R00-DK083455 (RAGV), 5T32DK007770-12 (KHS), GM074771 (ED), HL110353 (KEB), and DK083785 (AMcD), an AHA Beginning Grant-in-Aid 13BGIA14680069 (XZS). The authors thank K. Wawrowsky and F. Chung for their assistance in immunohistochemistry studies and B. Taylor for his assistance in preparing this manuscript.
Footnotes
Published online ahead of print. Publication date available at www.jasn.org.
See related editorial, “Renal Angiotensin-Converting Enzyme Upregulation: A Prerequisite for Nitric Oxide Synthase Inhibition–Induced Hypertension?,” on pages 2679–2681.
This article contains supplemental material online at http://jasn.asnjournals.org/lookup/suppl/doi:10.1681/ASN.2013091030/-/DCSupplemental.
References
- 1.Ng KK, Vane JR: Conversion of angiotensin I to angiotensin II. Nature 216: 762–766, 1967 [DOI] [PubMed] [Google Scholar]
- 2.Atlas SA: The renin-angiotensin aldosterone system: pathophysiological role and pharmacologic inhibition. J Manag Care Pharm 13[Suppl B]: 9–20, 2007 [DOI] [PMC free article] [PubMed] [Google Scholar]
- 3.Alderman MH, Cohen HW, Sealey JE, Laragh JH: Plasma renin activity levels in hypertensive persons: Their wide range and lack of suppression in diabetic and in most elderly patients. Am J Hypertens 17: 1–7, 2004 [DOI] [PubMed] [Google Scholar]
- 4.van den Meiracker AH, Man in ’t Veld AJ, Admiraal PJ, Ritsema van Eck HJ, Boomsma F, Derkx FH, Schalekamp MA: Partial escape of angiotensin converting enzyme (ACE) inhibition during prolonged ACE inhibitor treatment: Does it exist and does it affect the antihypertensive response? J Hypertens 10: 803–812, 1992 [PubMed] [Google Scholar]
- 5.Nussberger J, Brunner DB, Waeber B, Brunner HR: Plasma angiotensins under sustained converting enzyme inhibition with enalapril in normal humans. J Hypertens Suppl 3: S269–S270, 1985 [PubMed] [Google Scholar]
- 6.Alhenc-Gelas F, Baussant T, Hubert C, Soubrier F, Corvol P: The angiotensin converting enzyme in the kidney. J Hypertens Suppl 7: S9–S13; discussion S14, 1989 [DOI] [PubMed]
- 7.Erdös EG, Skidgel RA: Structure and functions of human angiotensin I converting enzyme (kininase II). Biochem Soc Trans 13: 42–44, 1985 [DOI] [PubMed] [Google Scholar]
- 8.Gonzalez-Villalobos RA, Janjoulia T, Fletcher NK, Giani JF, Nguyen MT, Riquier-Brison AD, Seth DM, Fuchs S, Eladari D, Picard N, Bachmann S, Delpire E, Peti-Peterdi J, Navar LG, Bernstein KE, McDonough AA: The absence of intrarenal ACE protects against hypertension. J Clin Invest 123: 2011–2023, 2013 [DOI] [PMC free article] [PubMed] [Google Scholar]
- 9.Navar LG, Kobori H, Prieto MC, Gonzalez-Villalobos RA: Intratubular renin-angiotensin system in hypertension. Hypertension 57: 355–362, 2011 [DOI] [PMC free article] [PubMed] [Google Scholar]
- 10.Pollock DM, Polakowski JS, Divish BJ, Opgenorth TJ: Angiotensin blockade reverses hypertension during long-term nitric oxide synthase inhibition. Hypertension 21: 660–666, 1993 [DOI] [PubMed] [Google Scholar]
- 11.Johnson RA, Freeman RH: Renin release in rats during blockade of nitric oxide synthesis. Am J Physiol 266: R1723–R1729, 1994 [DOI] [PubMed] [Google Scholar]
- 12.Graciano ML, Cavaglieri RC, Dellê H, Dominguez WV, Casarini DE, Malheiros DM, Noronha IL: Intrarenal Renin-Angiotensin system is upregulated in experimental model of progressive renal disease induced by chronic inhibition of nitric oxide synthesis. J Am Soc Nephrol 15: 1805–1815, 2004 [DOI] [PubMed] [Google Scholar]
- 13.Shen XZ, Li P, Weiss D, Fuchs S, Xiao HD, Adams JA, Williams IR, Capecchi MR, Taylor WR, Bernstein KE: Mice with enhanced macrophage angiotensin-converting enzyme are resistant to melanoma. Am J Pathol 170: 2122–2134, 2007 [DOI] [PMC free article] [PubMed] [Google Scholar]
- 14.Cole J, Quach DL, Sundaram K, Corvol P, Capecchi MR, Bernstein KE: Mice lacking endothelial angiotensin-converting enzyme have a normal blood pressure. Circ Res 90: 87–92, 2002 [DOI] [PubMed] [Google Scholar]
- 15.Kaikita K, Fogo AB, Ma L, Schoenhard JA, Brown NJ, Vaughan DE: Plasminogen activator inhibitor-1 deficiency prevents hypertension and vascular fibrosis in response to long-term nitric oxide synthase inhibition. Circulation 104: 839–844, 2001 [DOI] [PubMed] [Google Scholar]
- 16.Zhao D, Seth DM, Navar LG: Enhanced distal nephron sodium reabsorption in chronic angiotensin II-infused mice. Hypertension 54: 120–126, 2009 [DOI] [PMC free article] [PubMed] [Google Scholar]
- 17.Crowley SD, Gurley SB, Herrera MJ, Ruiz P, Griffiths R, Kumar AP, Kim HS, Smithies O, Le TH, Coffman TM: Angiotensin II causes hypertension and cardiac hypertrophy through its receptors in the kidney. Proc Natl Acad Sci U S A 103: 17985–17990, 2006 [DOI] [PMC free article] [PubMed] [Google Scholar]
- 18.Giani JF, Muñoz MC, Pons RA, Cao G, Toblli JE, Turyn D, Dominici FP: Angiotensin-(1-7) reduces proteinuria and diminishes structural damage in renal tissue of stroke-prone spontaneously hypertensive rats. Am J Physiol Renal Physiol 300: F272–F282, 2011 [DOI] [PubMed] [Google Scholar]
- 19.Campbell DJ, Alexiou T, Xiao HD, Fuchs S, McKinley MJ, Corvol P, Bernstein KE: Effect of reduced angiotensin-converting enzyme gene expression and angiotensin-converting enzyme inhibition on angiotensin and bradykinin peptide levels in mice. Hypertension 43: 854–859, 2004 [DOI] [PubMed] [Google Scholar]
- 20.Gonzalez-Villalobos RA, Satou R, Ohashi N, Semprun-Prieto LC, Katsurada A, Kim C, Upchurch GM, Prieto MC, Kobori H, Navar LG: Intrarenal mouse renin-angiotensin system during ANG II-induced hypertension and ACE inhibition. Am J Physiol Renal Physiol 298: F150–F157, 2010 [DOI] [PMC free article] [PubMed] [Google Scholar]
- 21.Schreiber A, Shulhevich Y, Geraci S, Hesser J, Stsepankou D, Neudecker S, Koenig S, Heinrich R, Hoecklin F, Pill J, Friedemann J, Schweda F, Gretz N, Schock-Kusch D: Transcutaneous measurement of renal function in conscious mice. Am J Physiol Renal Physiol 303: F783–F788, 2012 [DOI] [PubMed] [Google Scholar]
- 22.Navar LG, Satou R, Gonzalez-Villalobos RA: The increasing complexity of the intratubular Renin-Angiotensin system. J Am Soc Nephrol 23: 1130–1132, 2012 [DOI] [PubMed] [Google Scholar]
- 23.Ramkumar N, Ying J, Stuart D, Kohan DE: Overexpression of Renin in the collecting duct causes elevated blood pressure. Am J Hypertens 26: 965–972, 2013 [DOI] [PubMed] [Google Scholar]
- 24.Ying J, Stuart D, Hillas E, Gociman BR, Ramkumar N, Lalouel JM, Kohan DE: Overexpression of mouse angiotensinogen in renal proximal tubule causes salt-sensitive hypertension in mice. Am J Hypertens 25: 684–689, 2012 [DOI] [PMC free article] [PubMed] [Google Scholar]
- 25.Kobori H, Ozawa Y, Satou R, Katsurada A, Miyata K, Ohashi N, Hase N, Suzaki Y, Sigmund CD, Navar LG: Kidney-specific enhancement of ANG II stimulates endogenous intrarenal angiotensinogen in gene-targeted mice. Am J Physiol Renal Physiol 293: F938–F945, 2007 [DOI] [PMC free article] [PubMed] [Google Scholar]
- 26.Sachetelli S, Liu Q, Zhang SL, Liu F, Hsieh TJ, Brezniceanu ML, Guo DF, Filep JG, Ingelfinger JR, Sigmund CD, Hamet P, Chan JS: RAS blockade decreases blood pressure and proteinuria in transgenic mice overexpressing rat angiotensinogen gene in the kidney. Kidney Int 69: 1016–1023, 2006 [DOI] [PubMed] [Google Scholar]
- 27.Matsusaka T, Niimura F, Shimizu A, Pastan I, Saito A, Kobori H, Nishiyama A, Ichikawa I: Liver angiotensinogen is the primary source of renal angiotensin II. J Am Soc Nephrol 23: 1181–1189, 2012 [DOI] [PMC free article] [PubMed] [Google Scholar]
- 28.Quiroz Y, Pons H, Gordon KL, Rincón J, Chávez M, Parra G, Herrera-Acosta J, Gómez-Garre D, Largo R, Egido J, Johnson RJ, Rodríguez-Iturbe B: Mycophenolate mofetil prevents salt-sensitive hypertension resulting from nitric oxide synthesis inhibition. Am J Physiol Renal Physiol 281: F38–F47, 2001 [DOI] [PubMed] [Google Scholar]
- 29.Guyton AC: Blood pressure control—special role of the kidneys and body fluids. Science 252: 1813–1816, 1991 [DOI] [PubMed] [Google Scholar]
- 30.Mitchell KD, Navar LG: Enhanced tubuloglomerular feedback during peritubular infusions of angiotensins I and II. Am J Physiol 255: F383–F390, 1988 [DOI] [PubMed] [Google Scholar]
- 31.Thorup C, Persson AE: Inhibition of locally produced nitric oxide resets tubuloglomerular feedback mechanism. Am J Physiol 267: F606–F611, 1994 [DOI] [PubMed] [Google Scholar]
- 32.Hashimoto S, Adams JW, Bernstein KE, Schnermann J: Micropuncture determination of nephron function in mice without tissue angiotensin-converting enzyme. Am J Physiol Renal Physiol 288: F445–F452, 2005 [DOI] [PubMed] [Google Scholar]
- 33.Baylis C: Nitric oxide deficiency in chronic kidney disease. Am J Physiol Renal Physiol 294: F1–F9, 2008 [DOI] [PubMed] [Google Scholar]
- 34.Singh P, Deng A, Weir MR, Blantz RC: The balance of angiotensin II and nitric oxide in kidney diseases. Curr Opin Nephrol Hypertens 17: 51–56, 2008 [DOI] [PubMed] [Google Scholar]
- 35.Mattson DL, Meister CJ: Renal cortical and medullary blood flow responses to L-NAME and ANG II in wild-type, nNOS null mutant, and eNOS null mutant mice. Am J Physiol Regul Integr Comp Physiol 289: R991–R997, 2005 [DOI] [PubMed] [Google Scholar]
- 36.Zou AP, Cowley AW, Jr: Nitric oxide in renal cortex and medulla. An in vivo microdialysis study. Hypertension 29: 194–198, 1997 [DOI] [PubMed] [Google Scholar]
- 37.Cowley AW, Jr, Ryan RP, Kurth T, Skelton MM, Schock-Kusch D, Gretz N: Progression of glomerular filtration rate reduction determined in conscious Dahl salt-sensitive hypertensive rats. Hypertension 62: 85–90, 2013 [DOI] [PMC free article] [PubMed] [Google Scholar]
- 38.Gonzalez-Villalobos RA, Seth DM, Satou R, Horton H, Ohashi N, Miyata K, Katsurada A, Tran DV, Kobori H, Navar LG: Intrarenal angiotensin II and angiotensinogen augmentation in chronic angiotensin II-infused mice. Am J Physiol Renal Physiol 295: F772–F779, 2008 [DOI] [PMC free article] [PubMed] [Google Scholar]
Associated Data
This section collects any data citations, data availability statements, or supplementary materials included in this article.


