

Abstract
Neuroblastoma is characterized by biological and genetic heterogeneity that leads to diverse, often unpredictable, clinical behavior. Differential expression of the Trk family of neurotrophin receptors strongly correlates with clinical behavior; TrkA expression is associated with favorable outcome, whereas TrkB with unfavorable outcome. Neuroblastoma cells cultured in a microgravity rotary bioreactor spontaneously aggregate into tumor-like structures, called organoids. We wanted to determine if the clinical heterogeneity of TrkA- or TrkB-expressing neuroblastomas was reflected in aggregation kinetics and organoid morphology. Trk-null SY5Y cells were stably transfected to express either TrkA or TrkB. Short-term aggregation kinetics were determined by counting the number of single (non-aggregated) viable cells in the supernatant over time. Organoids were harvested after 8 d of bioreactor culture, stained, and analyzed morphometrically. SY5Y-TrkA cells aggregated significantly slower than SY5Y and SY5Y-TrkB cells, as quantified by several measures of aggregation. SY5Y and TrkB cell lines formed irregularly shaped organoids, featuring stellate projections. In contrast, TrkA cells formed smooth (non-stellate) organoids. SY5Y organoids were slightly smaller on average, but had significantly larger average perimeter than TrkA or TrkB organoids. TrkA expression alone is sufficient to dramatically alter the behavior of neuroblastoma cells in three-dimensional, in vitro rotary bioreactor culture. This pattern is consistent with both clinical behavior and in vivo tumorigenicity, in that SY5Y-TrkA represents a more differentiated, less aggressive phenotype. The microgravity bioreactor is a useful in vitro tool to rapidly investigate the biological characteristics of neuroblastoma and potentially to assess the effect of cytotoxic as well as biologically targeted drugs.
Keywords: Neuroblastoma, TrkA, Microgravity rotary bioreactor, Organoid morphology, Aggregation kinetics
Introduction
Neuroblastoma is the most common and deadly solid tumor of childhood and the most common cancer of infancy, accounting for about 15% of all pediatric cancer deaths (Brodeur 2003; Maris 2010). Neuroblastoma is characterized by biological and genetic heterogeneity that leads to diverse, often unpredictable, clinical behavior, from spontaneous regression to widespread dissemination (Maris 2010). We and others have shown that the pattern of expression of NTRK family gene expression contributes to this clinical diversity (Brodeur et al. 2009; Thiele et al. 2009; Light et al. 2012).
The NTRK genes code for the Trk family of neurotrophin receptors, a homologous group of transmembrane receptor tyrosine kinases that are critical for normal development of the central and peripheral nervous system. Trk receptors regulate multiple cellular processes, including proliferation, differentiation, migration, and apoptosis (Barbacid 1995). The Trk family consists of TrkA (NTRK1), TrkB (NTRK2), and TrkC (NTRK3), which are the cognate receptors for nerve growth factor (NGF), brain-derived neurotrophic factor (BDNF), and neurotrophin-3, respectively (Brodeur et al. 2009). In neuroblastoma, Trk expression has been strongly associated with clinical outcome. High TrkA expression is associated with favorable clinical and biological features and an excellent outcome, with 5-year survival rates of 95% (Nakagawara et al. 1993; Brodeur 2003). Conversely, high TrkB expression (and low TrkA expression) is associated with unfavorable biology and predictive of poor clinical outcome, with 5-year survival rates of 25% (Suzuki et al. 1993; Nakagawara et al. 1994a, b; Brodeur 2003). Interestingly, Trk-null neuroblastomas have intermediate risk and outcomes, with 5-year survivals from 40 to 50% (Brodeur 2003). Trk expression affects the tumorigenicity of neuroblastoma cells in xenograft models in a similar manner: TrkB expressing neuroblastoma lines readily form tumors, but TrkA expressing lines do not (Eggert et al. 2002).
We previously reported on the utility of in vitro, three-dimensional microgravity rotary bioreactor culture for the characterization of neuroblastoma behavior. In the rotary bioreactor, single neuroblastoma cells spontaneously aggregated into tumor-like structures called organoids, and the kinetics of aggregation and morphology of the organoids correlated with a specific biological parameter (Redden and Doolin 2011). Here, we examined the effect of Trk expression on the behavior of a Trk-null neuroblastoma cell line (SH-SY5Y) engineered to express either TrkA or TrkB. We hypothesized that the pattern of Trk expression would correlate with behaviors that could be quantitatively measured and discerned by aggregation kinetics, organoid morphology, and morphometric analysis.
Materials and Methods
Cells and cell culture
We analyzed three cell lines in this research as follows: the human neuroblastoma cell line SH-SY5Y (ATCC, Manassas, VA); SY5Y-TrkA, a subclone of SY5Y stably transfected to express the receptor TrkA at high levels; and SY5Y-TrkB, a subclone of SY5Y stably transfected to express the receptor TrkB at high levels (Eggert et al. 2000a, b; Ho et al. 2002). The parental SY5Y cell line has no detectable TrkA or TrkB expression by Western analysis (Trk-null). For a transfection control, the parental cell line (SY5Y) was transfected with an empty vector (Eggert et al. 2000). Cells in two-dimensional (2D) and three-dimensional (3D) rotary culture were maintained in RPMI media supplemented with 10% FBS, L-glutamine, gentamicin, and (if necessary) the selection agent G418. Exemption was obtained from the institutional review board regarding research with human cell lines. Unless specified otherwise, cell culture media and reagents were purchased from Life Technologies (Grand Island, NY).
Rotary bioreactor
The Rotary Cell Culture System (Synthecon, Inc., Houston, TX) consists of a culture vessel (for this research, we used the slow-turning lateral vessel), a base unit housing a rotary motor and pump, and an external power supply. Under typical operating conditions, the toroidal culture chamber of the vessel is completely filled with cells and media, connected to the base unit, and placed in toto into an incubator. The culture vessel slowly rotates about the horizontal (longitudinal) axis, and the pump pulls ambient air, i.e., the atmosphere within the incubator, across an inner semi-permeable membrane core for gas exchange within the vessel.
Cell culture in the bioreactor
Cells in 2D culture were detached before confluence with 0.05% trypsin-EDTA, and a single-cell suspension was seeded into the bioreactor at 5×10⁵ cells/ml. The bioreactor was maintained in a humidified, 37°C, 5% CO2 incubator. The bioreactor vessel was initially rotated at 10 rpm, but as cells aggregated into larger structures, the rotation speed was increased (at least daily) in order to maintain suspension and prevent sedimentation. Half of the medium was replaced every 3–4 d. In all cases, the bioreactor vessel was preconditioned with medium for 24 h before inoculation.
Analysis of cell aggregation kinetics
During the first 12 h of bioreactor culture, the supernatant was sampled hourly, concentrated by pulse centrifugation if necessary, and the single cells in the supernatant were manually counted. Viability was determined by trypan blue exclusion. The aggregation kinetics were quantified by (1) plotting the number of single cells per milliliter versus time and calculating the areas under the curve at 6 and 12 h, (2) calculating the culture time required for the number of single cells (non-aggregated) in the supernatant to reduce to a given concentration, and (3) calculating the concentration of single cells after 2 and 4 h of bioreactor culture. A more rapid aggregation was indicated by a lower area under the curve after a given time of culture, a longer time required to reach a given concentration of single cells, and a higher concentration of single cells after a given culture time. For each cell line, three separate kinetics experiments (bioreactor runs) were performed (n =3).
Analysis of organoids
In separate experiments, after 8 d of bioreactor culture, organoids were gently removed using a wide-mouthed transfer pipet, and fixed overnight at 4°C in HistoChoice MB (Electron Microscopy Sciences, Hatfield, PA). After fixation, the organoids were embedded in Cytoblock kit cassettes (ThermoFisher, Pittsburgh, PA) and histoprocessed to paraffin. The paraffin/Cytoblock polymer disks containing the organoids were embedded in paraffin, sectioned (4 μm), and stained with hematoxylin and eosin. Microscopic images were captured using IPLab (Scanalytics, Rockville, MD) and analyzed. For each cell line, ten organoids from two separate experiments were randomly selected for analysis. Images were imported into image analysis software (SigmaScan Pro, SPSS Science, Chicago, IL); organoids were manually traced; and maximum cross-sectional areas, perimeters, and shape factors (see below) were calculated by the software.
Statistical analysis
Statistical comparisons were performed using one-way ANOVA with Tukey’s post hoc analysis for determining the differences between the means of the groups (IBM SPSS Statistics, v. 20). Unless indicated, error bars depict standard deviations (SD). P values <0.05 were considered statistically significant.
Results
Aggregation kinetics
During the initial 12 h of bioreactor culture, the number of single viable cells in the supernatant decreased (Fig. 1), but no nonviable single cells were detected. This strongly suggested that this ‘disappearance’ of single cells represented cell-cell aggregation rather than cell death, as single cells adhered to one another to form doublets, triplets, and progressively larger aggregates. Aggregation curves were plotted for all three cell lines and indicated that the TrkA-expressing cell line aggregated more slowly than the Trk-null-and TrkB-expressing cell lines (Fig. 1). To quantify aggregation kinetics, we first calculated areas under the curve. As shown in Fig. 2, the TrkA curve showed a significantly higher area under the curve than the Trk-null and TrkB cell lines after 6 and 12 h of culture. No statistical differences were noted between the Trk-null and TrkB-expressing cell lines. Second, as indicated in Table 1, to reach each given single cell concentration in the bioreactor supernatant, the TrkA-expressing cell line required a longer culture time; and at each given time point, the TrkA-expressing cells had a higher single cell concentration. For all cell lines, after 12 h of bioreactor culture, less than 5% of the initially seeded single cells remained as single cells in the supernatant.
Figure 1.

Aggregation kinetics. Over the first 12 h of bioreactor culture, the number of viable, non-aggregated single cells in the supernatant rapidly decreased (initial concentration: 5×10⁵ cells/ml). The rate of the ‘disappearance’ of single non-aggregated cells represents aggregation rather than cell death, since no nonviable cells were detected. The TrkA-expressing cells (SY5Y-TrkA) aggregated more slowly than either the Trk-null (SY5Y) or TrkB-expressing cells (SY5Y-TrkB), see Fig. 2, Table 1. Error bars represent standard deviation. For each cell line, three separate experiments were performed (n =3).
Figure 2.

Quantification of the aggregation kinetics (graphically depicted in Fig. 1) by calculation of the area under the curve (AUC). SY5Y-TrkA had significantly greater AUC than the other cell lines, indicating slower cell-cell aggregation (6 h: p =0.013 v. SY5Y, p = 0.003 v. TrkB; 12 h: p =0.001 v. SY5Y, TrkB).
Table 1.
Quantification of the aggregation of SY5Y (Trk-null) and SY5Y-TrkA cell lines from the experiments graphically depicted in Fig. 1
| Cell line | Time to reach given concentration of single cells; hours (SD)
|
Single cell concentration after given culture time; single cells/ml×105 (SD)
|
|||
|---|---|---|---|---|---|
| 3.0× 10⁵ | 2.5×10⁵ | 2.0×10⁵ | 2 h | 4 h | |
| SY5Y | 2.62 (0.16) | 3.26 (0.10) | 3.77 (0.09) | 3.40 (0.12) | 1.78 (0.09) |
| TrkA | 4.63 (1.01) | 5.23 (1.36) | 6.73 (1.32) | 4.51 (0.21) | 2.95 (0.81) |
First, the culture time in h required to reach a given concentration of single cells. Second, the amount of aggregation (single cells/ml) after a given length of culture time. All data is presented as mean (SD). All differences between SY5Y and SY5Y-TrkA were statistically significant at p <0.05
Organoid morphology and morphometry
After 8 d of bioreactor culture, SY5Y and SY5Y-TrkB cell lines formed complex, irregularly shaped organoids featuring multiple stellate projections (Fig. 3). In contrast, SY5Y-TrkA cells formed more regular organoids with a smooth (non-stellate) periphery. In all cases, the organoids featured an outer region of viable cells and an inner core of nonviable cells. In terms of maximum cross-sectional area, no significant differences were seen between the organoids formed by the three cell lines (n = 10; Fig. 4). However, the SY5Y organoids had a significantly larger average perimeter than the TrkA and TrkB organoids (Fig. 4), which was largely due to the complex morphology. Finally, we calculated the shape factor (SF) of the organoids, a quantification of the deviation from a perfect sphere/circle (SF=1 indicates a perfect circle). After 8 d of bioreactor culture, the TrkA organoids showed a significantly higher SF than SY5Y and TrkB organoids (SY5Y-TrkA: 0.79± 0.05; SY5Y: 0.10±0.03; TrkB: 0.55±0.07; p <0.001 for all).
Figure 3.

Organoid morphology. The morphology of organoids formed after 8 d of bioreactor culture from SY5Y (left), SY5Y-TrkA (middle), and SY5Y-TrkB (right) at 50X (top) and 200X (bottom). SY5Y and SY5Y-TrkB cells formed complex, stellate organoids, but SY5Y-TrkA did not. Scale bar depicted.
Figure 4.
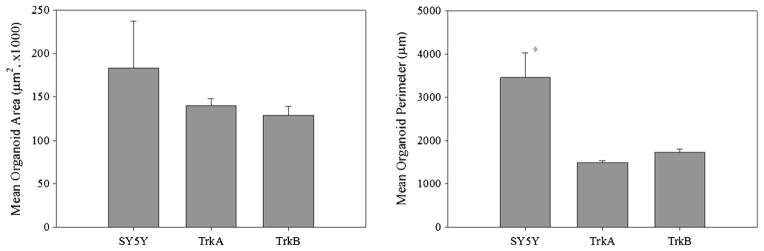
Average maximum cross-sectional areas (left) and perimeters (right) of SY5Y, TrkA, and TrkB organoids at day 8 (*p =0.004 vs. TrkA; p =0.001 vs. TrkB).
Discussion
In vitro culture offers several distinct advantages to both clinical analyses and in vivo models. For example, in vitro culture allows for the control and manipulation of single, specific biologic factors, and it can provide rapid, inexpensive, reproducible assays that generate multiple quantitative parameters of cellular behavior, often in real-time. 3D in vitro culture systems, such as the rotary bioreactor, offer further advantages compared to traditional 2D monolayer culture. In 2D culture, cell deformation (spreading) on the rigid cell culture surface, and lack of proper cell-cell adhesions and 3D architecture can induce widespread genotypic and phenotypic changes that are not necessarily indicative of cancer cells in vivo. Indeed, many researchers have shown that cancer cells in 3D bioreactor culture better emulate in vivo cancer cells in terms of behavior (proliferation, humoral responses, etc.), morphology, and cell-cell interactions (Jessup et al. 1993; Freed and Vunjak-Novakovic 1997; Ingram et al. 1997; O’Connor 1999; Rhee et al. 2001; Vamvakidou et al. 2007; Licato et al. 2009).
These results demonstrated that Trk expression alone is sufficient to radically alter the behavior of neuroblastoma cells in vitro. The TrkA-expressing cell line aggregated significantly slower than either the Trk-null or TrkB-expressing cell lines, and the morphology of the TrkA cell line was dramatically different. The distinct, contrasting behavior of SY5Y-TrkA compared to the Trk-null and TrkB lines in rotary bioreactor culture is similar to that seen both in clinical behavior and animal tumorigenicity (Nakagawara et al. 1993; Nakagawara et al. 1994a, b; Eggert et al. 2002). This suggests that slower aggregation kinetics and less complex organoid morphology (decreased perimeter) represent specific in vitro parameters that are indicative of a benign phenotype. In contrast, rapid aggregation and complex organoid morphology, with projections resembling invasiveness, are consistent with a more aggressive phenotype. The association here between rapid aggregation and aggressive phenotype supports previous research in which we demonstrated that a MYCN-amplified neuroblastoma cell line (an unfavorable genotype) showed a significantly more rapid aggregation compared to non-MYCN-amplified cell lines (Redden and Doolin 2011). Notably, SY5Y cells (as well as SY5Y-TrkA and SY5Y-TrkB cells) are not MYCN-amplified.
The specific mechanisms behind these phenotypes remain to be elucidated. Increased aggregation, in this case by the SY5Y and TrkB cells, could indicate an increased expression of certain cell-surface adhesion molecules. But the more ‘loose’ structure of the SY5Y and TrkB organoids after 8 d of culture, compared to the more compact TrkA organoids, may indicate that in the 3D organoid milieu, SY5Y and TrkB cells lose expression of adhesion molecules over time. The former could be a specific characteristic of SY5Y and TrkB cells in 2D culture that is maintained during early rotary bioreactor culture. In terms of the latter, reduced expression of adhesion factors has been reported in aggressive/metastatic neuroblastomas in vitro, in animal models, and in clinical tumors (Lammens et al. 2012; Lee et al. 2012). Reduced expression of specific adhesion factors in the tumor-like 3D organoids in the bioreactor could explain the stellate morphology, but more importantly could further demonstrate the potential of bioreactor culture to emulate in vivo tumors. The larger organoids and more complex morphometry of the Trk-null organoids could also indicate an increased heterogeneity of the SY5Y cell line in terms of its profile of adhesion factors. Regardless, these data validate the utility of the in vitro bioreactor assay for the characterization of differences in cancer cell behavior, and provides an advantageous environment for the investigation of the mechanisms driving specific behaviors.
The cell line SH-SY5Y is a subclone of the neuroblastoma cell line SK-N-SH that was established from a bone metastatic site (Biedler et al. 1978). It has been reported that SY5Y cells express low or undetectable TrkA and TrkB, though the signaling pathways appear to be intact (Lavenius et al. 1995; Ho et al. 2002), and they do not synthesize endogenous NGF (Arien-Zakay et al. 2007). In contrast, SY5Y cells express endogenous BDNF (Ho et al. 2002). In the absence of NGF, neuroblastoma cells undergo apoptosis, presumably mediated through p75 expression (Bunone et al. 1997), and transfection with TrkA inhibits this process (Eggert et al. 2000a, b). No exogenous NGF was added to the culture media in our experiments, and no nonviable cells were detected in the first 24 h of bioreactor culture. However, a substantial advantage of the bioreactor is the manipulation of specific, individual biologic and/or genetic variables and observation of the resultant behavior, allowing the discrimination and parsing of the relative contributions of these variables. In future analyses with these cell lines, we will evaluate the specific influence of external ligand, chemotherapeutic agents, biologically targeted agents, and environmental factors, which may inform the development of clinical treatments.
Contributor Information
Robert A. Redden, Department of General, Thoracic, and Fetal Surgery, The Children’s Hospital of Philadelphia, 34th and Civic Center Blvd. Wood Center, 5th Floor, Philadelphia, PA 19104, USA
Radhika Iyer, Division of Oncology, Department of Pediatrics, The Children’s Hospital of Philadelphia, Philadelphia, PA, USA.
Garrett M. Brodeur, Division of Oncology, Department of Pediatrics, The Children’s Hospital of Philadelphia, Philadelphia, PA, USA. Department of Pediatrics, Perelman School of Medicine at the University of Pennsylvania, Philadelphia, PA, USA
Edward J. Doolin, Email: doolin@email.chop.edu, Department of General, Thoracic, and Fetal Surgery, The Children’s Hospital of Philadelphia, 34th and Civic Center Blvd. Wood Center, 5th Floor, Philadelphia, PA 19104, USA. Department of Surgery, Perelman School of Medicine at the University of Pennsylvania, Philadelphia, PA, USA
References
- Arien-Zakay H, Nagler A, Galski H, Lazarovici P. Neuronal conditioning medium and nerve growth factor induce neuronal differentiation of collagen-adherent progenitors derived from human umbilical cord blood. J Mol Neurosci. 2007;32:179–191. doi: 10.1007/s12031-007-0027-2. [DOI] [PubMed] [Google Scholar]
- Barbacid M. Structural and functional properties of the TRK family of neurotrophin receptors. Ann N Y Acad Sci. 1995;766:442–458. doi: 10.1111/j.1749-6632.1995.tb26693.x. [DOI] [PubMed] [Google Scholar]
- Biedler JL, Roffler-Tarlov S, Schachner M, Freedman LS. Multiple neurotransmitter synthesis by human neuroblastoma cell lines and clones. Cancer Res. 1978;38:3751–3757. [PubMed] [Google Scholar]
- Brodeur GM. Neuroblastoma: biological insights into a clinical enigma. Nat Rev Cancer. 2003;3:203–216. doi: 10.1038/nrc1014. [DOI] [PubMed] [Google Scholar]
- Brodeur GM, Minturn JE, Ho R, Simpson AM, Iyer R, Varela CR, Light JE, Kolla V, Evans AE. Trk receptor expression and inhibition in neuroblastomas. Clin Cancer Res. 2009;15:3244–3250. doi: 10.1158/1078-0432.CCR-08-1815. [DOI] [PMC free article] [PubMed] [Google Scholar]
- Bunone G, Mariotti A, Compagni A, Morandi E, Della Valle G. Induction of apoptosis by p75 neurotrophin receptor in human neuroblastoma cells. Oncogene. 1997;14:1463–1470. doi: 10.1038/sj.onc.1200972. [DOI] [PubMed] [Google Scholar]
- Eggert A, Grotzer MA, Ikegaki N, X-g L, Evans AE, Brodeur GM. Expression of the neurotrophin receptor TRKA downregulates expression and function of angiogenic stimulators in sh-sy5y neuroblastoma cells. Cancer Res. 2002;62:1802–1808. [PubMed] [Google Scholar]
- Eggert A, Ikegaki N, Liu X, Chou TT, Lee VM, Trojanowski JQ, Brodeur GM. Molecular dissection of TrkA signal transduction pathways mediating differentiation in human neuroblastoma cells. Oncogene. 2000a;19:2043–2051. doi: 10.1038/sj.onc.1203518. [DOI] [PubMed] [Google Scholar]
- Eggert A, Sieverts H, Ikegaki N, Brodeur GM. p75 mediated apoptosis in neuroblastoma cells is inhibited by expression of TrkA. Med Pediatr Oncol. 2000b;35:573–576. doi: 10.1002/1096-911x(20001201)35:6<573::aid-mpo17>3.0.co;2-a. [DOI] [PubMed] [Google Scholar]
- Freed LE, Vunjak-Novakovic G. Microgravity tissue engineering. In Vitro Cell Dev Biol Anim. 1997;33:381–385. doi: 10.1007/s11626-997-0009-2. [DOI] [PubMed] [Google Scholar]
- Ho R, Eggert A, Hishiki T, Minturn JE, Ikegaki N, Foster P, Camoratto AM, Evans AE, Brodeur GM. Resistance to chemotherapy mediated by TrkB in neuroblastomas. Cancer Res. 2002;62:6462–6466. [PubMed] [Google Scholar]
- Ingram M, Techy G, Saroufeem R, Yazan O, Narayan K, Goodwin T, Spaulding G. Three-dimensional growth patterns of various human tumor cell lines in simulated microgravity of a NASA bioreactor. In Vitro Cell Dev Biol Anim. 1997;33:459–466. doi: 10.1007/s11626-997-0064-8. [DOI] [PubMed] [Google Scholar]
- Jessup JM, Goodwin TJ, Spaulding G. Prospects for use of microgravity-based bioreactors to study three-dimensional host-tumor interactions in human neoplasia. 1993;51:290–300. doi: 10.1002/jcb.240510308. [DOI] [PubMed] [Google Scholar]
- Lammens T, Swerts K, Derycke L, De Craemer A, De Brouwer S, De Preter K, Van Roy N, Vandesompele J, Speleman F, Philippé J, Benoit Y, Beiske K, Bracke M, Laureys G. N-Cadherin in Neuroblastoma Disease: expression and clinical significance. PLoS ONE. 2012;7:e31206. doi: 10.1371/journal.pone.0031206. [DOI] [PMC free article] [PubMed] [Google Scholar]
- Lavenius E, Gestblom C, Johansson I, Nanberg E, Pahlman S. Transfection of TRK-A into human neuroblastoma cells restores their ability to differentiate in response to nerve growth factor. Cell Growth Differ. 1995;6:727–736. [PubMed] [Google Scholar]
- Lee S, Qiao J, Paul P, O’Connor KL, Evers M, Chung DH. FAK is a critical regulator of neuroblastoma liver metastasis. Oncotarget. 2012;3:1576–1587. doi: 10.18632/oncotarget.732. [DOI] [PMC free article] [PubMed] [Google Scholar]
- Licato LL, Prieto VG, Grimm EA. A novel preclinical model of human malignant melanoma utilizing bioreactor rotating-wall vessels. In Vitro Cell Dev Biol Animal. 2009;37:121–126. doi: 10.1290/1071-2690(2001)037<0121:ANPMOH>2.0.CO;2. [DOI] [PubMed] [Google Scholar]
- Light JE, Koyama H, Minturn JE, Ho R, Simpson AM, Iyer R, Mangino JL, Kolla V, London WB, Brodeur GM. Clinical significance of NTRK family gene expression in neuroblastomas. Pediatric blood & cancer. 2012;59:226–232. doi: 10.1002/pbc.23343. [DOI] [PMC free article] [PubMed] [Google Scholar]
- Maris JM. Recent advances in neuroblastoma. New Eng J Med. 2010;362:2202–2211. doi: 10.1056/NEJMra0804577. [DOI] [PMC free article] [PubMed] [Google Scholar]
- Nakagawara A, Arima-Nakagawara M, Scavarda NJ, Azar CG, Cantor AB, Brodeur GM. Association between high levels of expression of the TRK gene and favorable outcome in human neuroblastoma. N Engl J Med. 1993;328:847–854. doi: 10.1056/NEJM199303253281205. [DOI] [PubMed] [Google Scholar]
- Nakagawara A, Azar CG, Scavarda NJ, Brodeur GM. Expression and function of TRK-B and BDNF in human neuroblastomas. Molecular and cellular biology. 1994a;14:759–767. doi: 10.1128/mcb.14.1.759. [DOI] [PMC free article] [PubMed] [Google Scholar]
- Nakagawara A, Azar CG, Scavarda NJ, Brodeur GM. Expression and function of TRK-B and BDNF in human neuroblastomas. Mol Cell Biol. 1994b;14:759–767. doi: 10.1128/mcb.14.1.759. [DOI] [PMC free article] [PubMed] [Google Scholar]
- O’Connor KC. Three-dimensional cultures of prostatic cells: tissue models for the development of novel anti-cancer therapies. Pharm Res. 1999;16:486–493. doi: 10.1023/a:1011906709680. [DOI] [PubMed] [Google Scholar]
- Redden RA, Doolin EJ. Microgravity assay of neuroblastoma: in vitro aggregation kinetics and organoid morphology correlate with MYCN expression. In Vitro Cell Dev Biol Anim. 2011;47:312–317. doi: 10.1007/s11626-011-9393-8. [DOI] [PubMed] [Google Scholar]
- Rhee HW, Zhau HE, Pathak S, Multani AS, Pennanen S, Visakorpi T, Chung LWK. Permanent phenotypic and genotypic changes of prostate cancer cells cultured in a three-dimensional rotating-wall vessel. In Vitro Cell Dev Biol Anim. 2001;37:127–140. doi: 10.1290/1071-2690(2001)037<0127:PPAGCO>2.0.CO;2. [DOI] [PubMed] [Google Scholar]
- Suzuki T, Bogenmann E, Shimada H, Stram D, Seeger RC. Lack of high-affinity nerve growth factor receptors in aggressive neuroblastomas. J Natl Cancer Inst. 1993;85:377–384. doi: 10.1093/jnci/85.5.377. [DOI] [PubMed] [Google Scholar]
- Thiele CJ, Li Z, McKee AE. On Trk—the TRKB signal transduction pathway is an increasingly important target in cancer biology. Clin Cancer Res. 2009;15:5962–5967. doi: 10.1158/1078-0432.CCR-08-0651. [DOI] [PMC free article] [PubMed] [Google Scholar]
- Vamvakidou AP, Mondrinos MJ, Petushi SP, Garcia FU, Lelkes PI, Tozeren A. Heterogeneous breast tumoroids: an in vitro assay for investigating cellular heterogeneity and drug delivery. J Biomol Screen. 2007;12:13–20. doi: 10.1177/1087057106296482. [DOI] [PubMed] [Google Scholar]