

Abstract
Plants respond to nitrogen availability by changing their root : shoot ratios. One hypothesis used to explain this allocation is that plants optimize their behaviour by maximizing their relative growth rate. The consequences of this hypothesis were investigated by formulating two models for root : shoot allocation, with and without explicit inclusion of maintenance respiration. The models also took into account that relative growth rate is a linear function of plant nitrogen concentration. The model without respiration gave qualitatively reasonable results when predictions were compared with observed results from growth experiments with birch and tomato. The explicit inclusion of maintenance respiration improved considerably the agreement between prediction and observation, and for birch was within the experimental accuracy. Further improvements will require additional details in the description of respiratory processes and the nitrogen uptake function. Plants growing under extreme nutrient stress may also optimize their behaviour with respect to other variables in addition to relative growth rate.
Key words: Birch, Betula pendula, tomato, Lycopersicon esculentum, respiration, nitrogen
INTRODUCTION
It is a standard assumption in plant ecology that plants respond to their environment in such a way as to optimize their resource use (e.g. Bloom et al., 1985). One expression of such an optimization is the allocation between shoots and roots in response to nutrient availability. In general, when nutrient availability increases, plants allocate relatively less to their roots, which is consistent with a resource optimization hypothesis as increasing nutrient availability means that less effort is required to acquire this resource. Exceptions to this rule, when K, Mg or Mn are limiting (Ericsson, 1995), can be recast into the resource optimization hypothesis. Deficiencies of these elements lead also to a shortage of carbohydrates, which signifies to the plant that the allocation to light acquisition is sub‐optimal.
Several models have been developed to explain the mechanisms behind the root : shoot allocation (see reviews by Wilson, 1988; Ågren and Wikström, 1993; Cannell and Dewar, 1994). All models are based on a carbon balance, but some additional constraints are required. Two general routes can then be followed. First, some plant property is optimized, which, in practise, always turns out to be the relative growth rate (Johnson and Thornley, 1987; Hilbert, 1990; Thornley, 1995). Secondly, a sink strength depending either on nitrogen concentration (Ågren and Ingestad, 1987; Ingestad and Ågren, 1991) or on carbon and nitrogen substrate concentrations (Thornley, 1972, 1995, 1998) is added. The problem with the latter group of models is that they require phenomenological formulation of plant properties (nitrogen productivity, substrate utilization rates or transport rates) and, therefore, only show consistency between plant properties without explaining them in terms of some underlying principle. Formulations derived by maximizing the relative growth rate give, in general, qualitatively satisfactory results but quantitative tests seem to be lacking. One reason for this is the problem of independently estimating all the necessary parameters required for testing the predictions; in particular the relationship between net assimilation rate and plant nitrogen concentration has to be specified.
In this paper, a relationship between the shoot fraction (fS) and plant nitrogen concentration (cN) will be derived by maximizing the relative growth rate. The problem of the arbitrariness in the relationship between assimilation rate and plant nitrogen concentration will be avoided. Instead the strong empirical, linear relationship between relative growth rate and plant nitrogen concentration (Ågren and Wikström, 1993) will be used to derive the assimilation rate as a function of plant nitrogen concentration. The final relationship, fS(cN), will then have only one or two free parameters that will be adjusted when comparing predictions with experimental results.
MATERIALS AND METHODS
For simplicity, a plant consisting of only a shoot biomass and a root biomass will be considered. The total dry mass of the plant is W, its nitrogen content N, the shoot fraction fS, the carbon assimilation rate per unit shoot mass A, and the uptake rate of nitrogen per unit root mass U. Due to the constancy of carbon concentration in plant biomass, dry weight increase equals carbon assimilation × a constant factor included in A. It is further assumed that respiratory losses are proportional to plant nitrogen content (Ryan et al., 1996; Cannell and Thornley, 2000). The growth rate and the nitrogen uptake rate are then
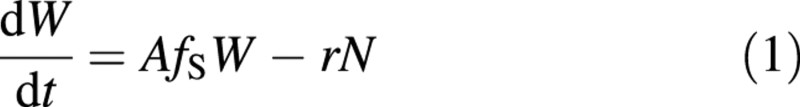
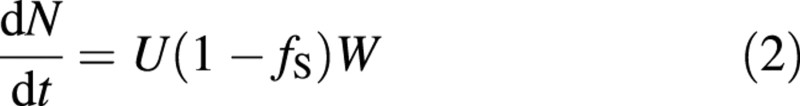
where r is the respiration rate per unit of nitrogen. A list of symbols is given in Table 1.
Table 1.
List of symbols and units
| A | Dry weight assimilation rate per unit shoot biomass, d–1 |
| c A , c B | Integration constants, g N (g d. wt)–1 |
| c N | Plant nitrogen concentration (N/W), g N (g d. wt)–1 |
| c Nmin | Minimum plant nitrogen concentration for growth, g N (g d. wt)–1 |
| f S | Shoot fraction, dimensionless |
| N | Plant nitrogen content, g N |
| NAR W | Net assimilation rate per unit shoot mass, d–1 |
| P N | Nitrogen productivity, g d. wt (g N)–1 d–1 |
| r | Maintenance respiration per unit plant nitrogen, g d. wt (g N)–1 d–1 |
| R N | Relative rate of nitrogen uptake, d–1 |
| R W | Relative growth rate, d–1 |
| t | Time, d |
| U | Uptake rate of nitrogen per unit root biomass, g N (g d. wt)–1 d–1 |
| W | Plant biomass, g d. wt |
For plants with balanced growth (constant exponential rates), the relative growth rate RW = (dW/dt)/W and the relative nitrogen uptake rate RN = (dN/dt)/N must be equal. Applying this to eqns (1) and (2) gives
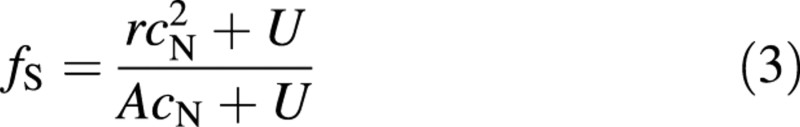
where cN = N/W is the whole‐plant nitrogen concentration. Equation (3), for r = 0, is identical to the expression derived by Hilbert (1990). We can use eqns (1) and (3) to express the relative growth rate in terms of assimilation rate, uptake rate and plant nitrogen concentration
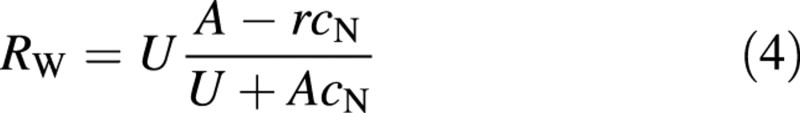
However, the assimilation rate is also a function of the plant nitrogen concentration (e.g. Field and Mooney, 1983). On the other hand, the uptake rate of nitrogen can be expected to be more dependent on the environmental supply of nitrogen than on plant properties and it will, therefore, be assumed that it is independent of the plant nitrogen concentration. For a plant that optimizes its performance by maximizing its relative growth rate through adjustment of its nitrogen concentration, and thus also its root : shoot ratio, the result is
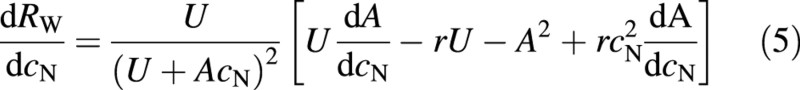
or at optimum
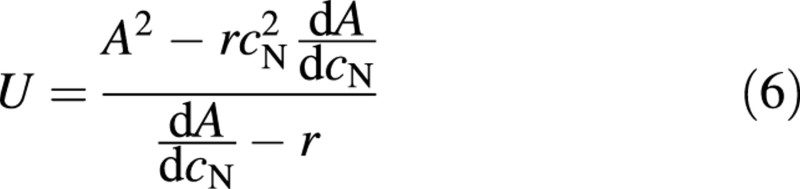
which gives
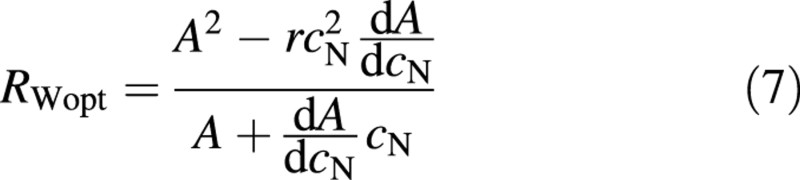
To proceed, some relationship between A and cN could be assumed. However, such assignments would be rather arbitrary (e.g. Ågren and Ingestad, 1987). Instead A will be calculated by utilizing the strict relationship between relative growth rate and nitrogen concentration that exists through the nitrogen productivity, PN (e.g. Ågren, 1985, 1996).
RW = PN(cN – cNmin)(8)
where cNmin is the minimum nitrogen concentration in the plant required for growth. Equation (8) is only valid for nitrogen‐limited plants, but this is the only domain of interest in this paper.
Combining eqns (7) and (8) gives
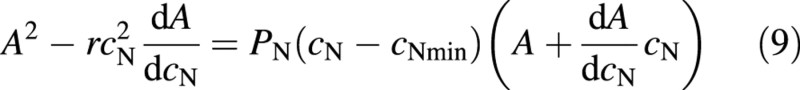
Equation (9) can be solved exactly for two special cases: (A) r = 0 and (B) cNmin = 0. In case (A), the differential equation in eqn (9) can be solved with the substitution y = AcN to give
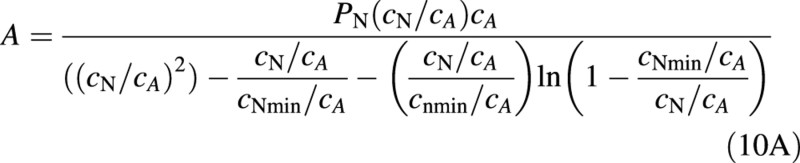
where cA > 0 is an integration constant. The integration constant cA, which also has absorbed a PN, plays the role of a scale factor for the concentration. It should be noted that the integration constant depends on external factors such as light and temperature and will change when factors that alter PN change. Finally
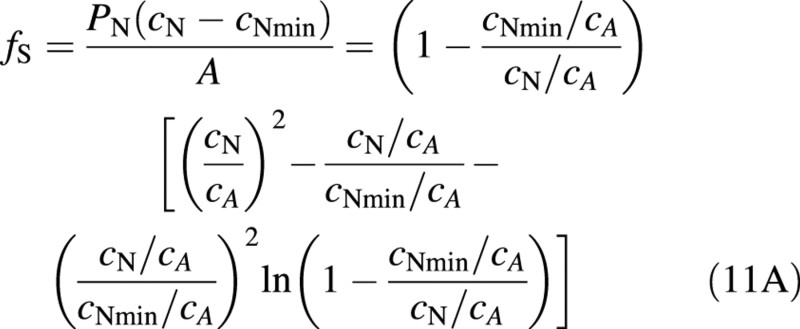
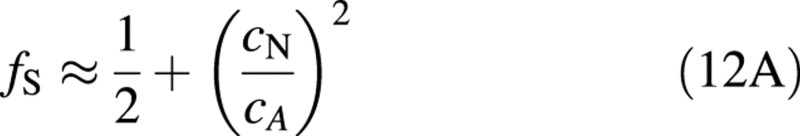
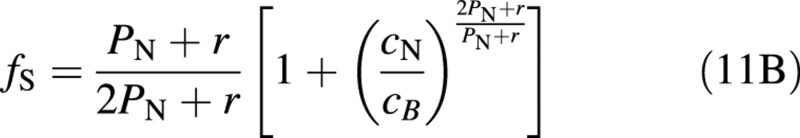
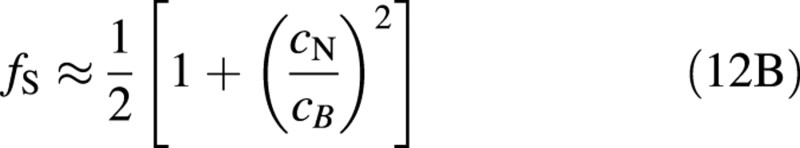
In the second expression for fS, the explicit dependence on PN has disappeared and all effects of other variables, apart from plant nitrogen concentration, are included in the integration constant cA. When cNmin/cA <0·1, eqn (11A) can be simplified with an error of less than 10 % for most values of cN to
In case (B), the substitution A = ycN leads to the solution
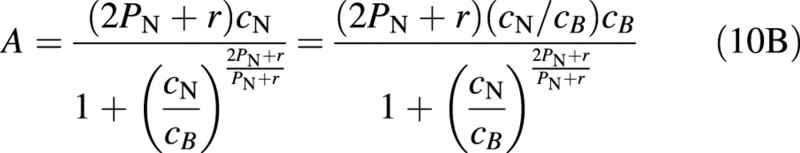
where cB is another integration constant, which also, in this case: enters a scale factor, and
which for r/PN <1/4 can be approximated with an error of less than 10 % with
In the limits of r = 0 and cNmin = 0, cases (A) and (B) are the same, except that the integration constants are slightly different.
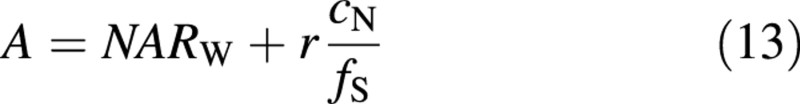
The net assimilation rate per unit shoot mass (NARW) is related to A through
Examples of net assimilation rates and shoot fractions as functions of plant nitrogen concentrations are given in Fig. 1. These figures show that the qualitative behaviour of the results agrees with general knowledge. The lack of an effect of increasing light on allocation for case (A) and the increasing allocation to shoots with increasing PN in case (B) in Fig. 1 have to be interpreted with caution because the same value for the integration constants has been used for all curves.

Fig. 1. Assimilation rate (A) and shoot fraction (fS) as functions of plant nitrogen concentrations (cN) for different values of nitrogen productivity (PN). Case A: cA = 0·0534 gN (g d. wt)–1. For A, cNmin = 0·004 gN (g d. wt)–1 and PN = 4·3, 5·5 and 7·1 g d. wt (gN)–1 d–1 corresponding to quantum fluxes of 5, 14 and 30 mol m–2 d–1, respectively, in the experiments with birch by Ingestad et al. (1994b). For fS, cNmin = 0 and 0·004 gN (g d. wt)–1. Case B: cB = 0·0511 gN (g d. wt)–1, PN = 4·3 and 7·1 g d. wt (gN)–1 d–1, and r = 0 and 2. The lower curve for each PN for A correspond to r = 0. The curves for fS with r = 0 coincide for the two values of PN (dotted line).
COMPARISON WITH DATA
The prediction of allocation was tested against growth data for tomato (Lycopersicon esculentum) (Ingestad et al., 1994a; de Groot et al., 2002) and birch (Betula pendula) (Ingestad et al., 1994b). These studies were performed at different light intensities and using different relative addition rates of nitrogen, but otherwise under constant environmental conditions. This led to a time series of steady‐state growth. For any given light intensity and relative addition rate of nitrogen, the plant nitrogen concentration and shoot fraction remained stable during the whole experimental period, in spite of increases in plant size by more than a factor of 20. From the experiments of Ingestad et al. (1994a, b) we used PN and cNmin calculated by Ågren and Bosatta (1998) and estimated cA and cB such that fS agreed with the experimental values when cN = 0·03 for birch and 0·05 g g–1 for tomato, respectively (Table 2). Ideally, cA and cB should have been estimated from measurements of the A – cN curve, but such data were not available. In all cases a parameter value of r = 2 g d. wt (gN)–1 d–1 was chosen, which was somewhat higher than Cannell and Thornley (2000) estimated from the work of Ryan et al. (1996).
Table 2.
Plant parameters for comparison with experiments
| P N | c Nmin | c A | c B | r | |
| g d. wt (gN)–1 d–1 | gN (g d. wt)–1 | gN (g d. wt)–1 | gN (g d. wt)–1 | g d. wt (gN)–1 d–1 | |
| Birch1 | 6·3 | 0·004 | 0·0534 | 0·0575 | 2 |
| Tomato2 | 11·0 | 0·015 | 0·0698 | 0·0746 | 2 |
| Tomato3 | 7·1 | 0·00817 | 0·119 | 0·065 | 2 |
| Tomato4 | 12·51 | 0·00738 | 0·069 | 0·043 | 2 |
Data from 1 Ingestad et al. (1994b); 2 Ingestad et al. (1994a); 3 de Groot et al. (2002) at low light; 4 de Groot et al. (2002) at high light.
RESULTS
The comparison between experimental results and predictions is shown in Fig. 2. It is clear that case (A) fails to give a satisfactory agreement for both species. The agreement between experimental data from Ingestad et al. (1994a, b) and predictions using eqn (11B) is good for birch, while the observed root : shoot ratio is less flexible than predicted for tomato. The importance of the intercept cNmin is also much smaller for birch than for tomato. Another observation is that at the lowest nitrogen concentrations, corresponding to low relative growth rates (less than 0·05 d–1 for birch and 0·10 d–1 for tomato), the experimental root : shoot ratios respond differently to plant nitrogen concentration than at higher nitrogen concentrations. Moreover, birch and tomato behave differently. Birch shows a rapid decrease in the shoot fraction whereas tomato, contrary to expectations, shows an increase in the shoot fraction. With birch, there is also a region of high nitrogen concentration with no response in root : shoot ratio. A part of this region is possibly involved in the uptake and storage of excess nitrogen not required for immediate physiological use. The increasing allocation to shoots in tomato at the lowest plant nitrogen concentrations is, at least partly, associated with an increased allocation to stem growth at the expense of leaves.
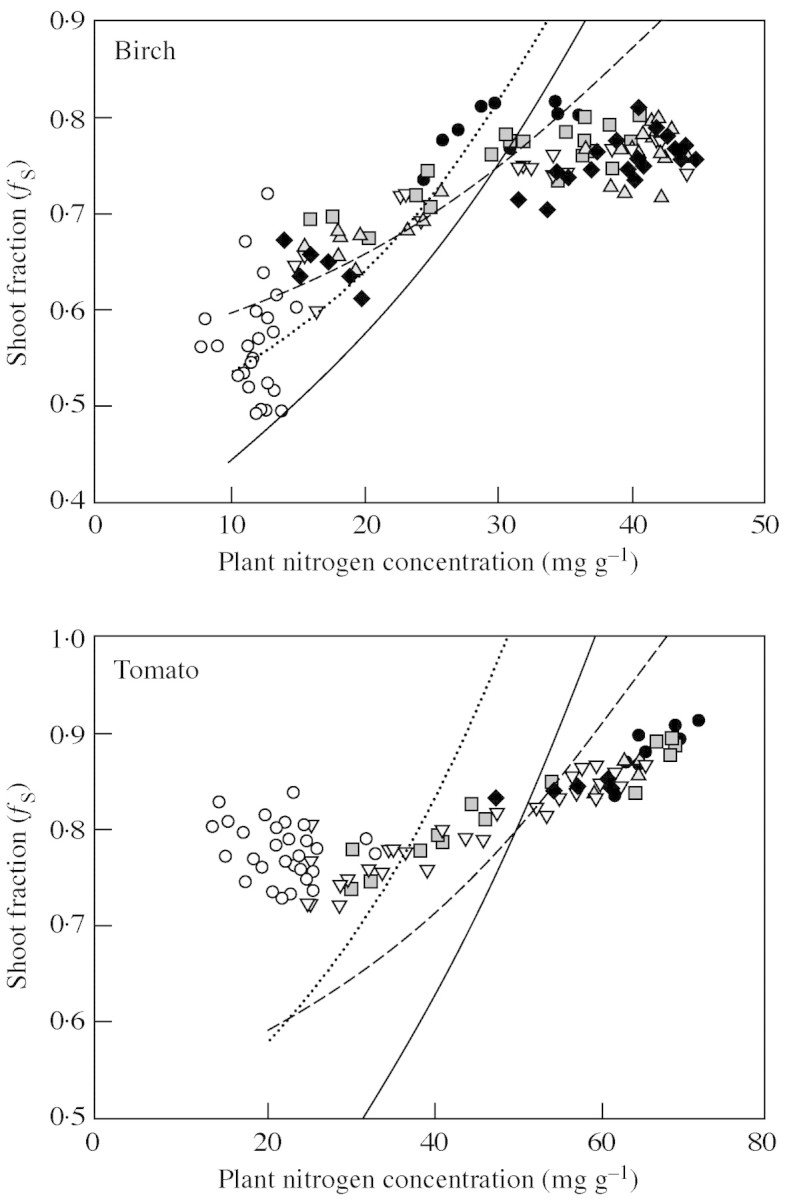
Fig. 2. Shoot fraction as a function of plant nitrogen concentration. Solid line, cNmin > 0, eqn (11A); dotted line, cNmin = 0, eqn (12A); broken line: r = 2, eqn (11B). Other parameters as in Table 1. Symbols are data from experiments with birch (Ingestad et al., 1994b) and tomato (Ingestad et al., 1994a). Open symbols represent experiments with low relative addition rates of nitrogen. Solid symbols (circles, squares, triangles, inverted triangles and diamonds) represent faster growing plants at five different light intensities (5, 11, 22, 30 and 39 mol m–2 d–1) for birch and (3, 6, 10, 18 and 23 mol m–2 d–1) for tomato.
From the experiment of de Groot et al. (2002) PN and cNmin were estimated from observations on relative growth rate and plant nitrogen concentration. The integration constants (cA and cB) have then been adjusted to meet the observed values of NARW (Table 2). The comparisons between experimental results and predictions are shown in Fig. 3. The fit to the observed assimilation rate is quite good for case (A) but for case (B) there is a tendency towards too high values at low plant nitrogen concentrations. The predictions for this experiment with tomato also show too high a flexibility in allocation, except for case B at low light.

Fig. 3. Simulated and measured assimilation (A) and shoot fraction (fS). Solid circles, low light; open circles, high light; solid lines, case (A); broken lines, case (B). Data from de Groot et al. (2002).
DISCUSSION
The behaviour of the allocation response to nitrogen availability is in good agreement with general observations for birch. For tomato, the general behaviour is as expected but not entirely satisfactory quantitatively. It would be easy to adjust the assimilation curve (Fig. 3) to the experimental data by replacing c with c – cNmin in eqn (10B). This would still leave the relative growth rate as an almost perfectly linear function of plant nitrogen concentration. Such a substitution is, however, contrary to the spirit of this paper as it is pure curve fitting. Moreover, it does not improve the behaviour of fS.
There are several options for improving the agreement between prediction and observation. It should be noted that the plants are sufficiently small that self‐shading is not a problem. The simplification of dividing the plants into only roots and shoots should be acceptable as leaves constitute generally more than 80 % of shoots of fast‐growing plants, and changes in allocation in response to light are small. However, in the experiment on tomatoes by Ingestad et al. (1994a), there is a large shift in the allocation between leaves and stems where the leaf fraction of the shoot decreases from 85–90 % at high nitrogen concentrations to about 60 % at low nitrogen concentrations. For larger plants, the subdivision into only roots and shoots is an oversimplification.
The considerable improvement when an explicit respiratory term is included indicates that there might be additional possibilities for improving the models for allocation by adding additional respiratory costs. However, maximizing the relative growth rate may not be the correct optimization criterion. This could explain the problems at the lowest growth rates where plants may be adapted to optimize properties other than relative growth rate. At higher growth rates, this is less likely to be a problem but the assumption of a constant uptake rate per unit root biomass must be challenged. However, replacing the constant U requires a model of the interaction between roots and the nutrient‐supplying medium that is lacking. Such a model seems necessary before better descriptions of allocation can be made. Ingredients of such a model must probably take into account the extent to which the nutrient supply is replenishment‐limited or concentration‐limited (Rastetter and Shaver, 1992).
An interesting aspect of the results is that there seems to be no shift in allocation as a response to light availability, although such results are standard (e.g. Cannell and Dewar, 1994; Canham et al., 1996) but are not always observed (e.g. Shipley, 2000). It is suggested that the explanation for this is that the shoot fraction has been expressed as a function of plant nitrogen concentration and that when analysed in this way there is little effect of light on allocation. Indeed, when Canham et al. (1996) plotted root fractions as functions of plant nitrogen concentrations instead of as functions of light intensity, the effects of light disappeared and it turned out that the effect of light was to change the nitrogen concentration. It is expected that most observations of decreased allocation to shoots when light is increased can be explained in this way. An increase in light will increase carbon assimilation and if this is not accompanied by a similar increase in nitrogen supply, the plant nitrogen concentration will decrease along with the allocation to the shoot. However, this is only an indirect effect of a change in light intensity; the driving force for the change in allocation is the change in nitrogen concentration (Ingestad and McDonald, 1989; De Pinheiro Henriques and Marcelis, 2000). Ågren et al. (1999) have made a similar observation with respect to the interaction between carbon dioxide and nitrogen.
One particular point is that the shoot fraction cannot decrease below 0·5 when cNmin = 0. The value 0·5 is also a lower limit for case (B), which is obtained when r = 0. Experimental evidence indicates also that root biomass rarely exceeds shoot biomass (e.g. Ågren and Ingestad, 1987; Baxter et al., 1994; Canham et al., 1996; Bolinder et al., 1997; Ryser et al., 1997; McConnaughay and Coleman, 1998). These studies represent seven tree (coniferous and hardwood) species, three old‐field annuals, four cereals and six grass species grown under a range of experimental conditions.
Two models have been used to investigate how different aspects could modify the response of root : shoot allocation to nitrogen availability. Although the two models give quantitatively differing results, qualitative effects are lacking. This indicates that the general approach is robust and that improving the predictability of root : shoot models requires other approaches. It should also be noted that, if we add a respiratory cost for growth of about 25 % of net growth (cf. Cannell and Thornley, 2000), the total respiration is about 50 % of gross assimilation for birch but somewhat lower for tomato. This is a level that is considered an average value for most plants (Waring et al., 1998).
The approach described here has, compared with other models, the advantage that it requires only a small number of parameters which are relatively easy to estimate experimentally. For this reason, it has been possible to test the predictions of the model against experimental data, which has indicated where improvements in root : shoot models might be required. The linear relationship between relative growth rate and plant nitrogen concentration imposed in eqn (8) closely resembles the slightly curved relationship derived by Hilbert (1990), but seems more difficult to reproduce with other approaches (cf. Ingestad and Ågren, 1991).
In conclusion, it has been shown that a functional equilibrium approach (Brouwer, 1983) where the relative growth rate is maximized can serve as a basis for describing root : shoot allocation. However, this approach may not be valid for plants growing under extreme conditions of high or low nutrient availability. Moreover, to have quantitatively correct root : shoot allocations it seems necessary to have a better understanding and formulation of how plants regulate nitrogen uptake and plant respiration. The focus on the partitioning of mass rather than other functional attributes can also lead to inappropriate optimization criteria (Reich, 2002).
ACKNOWLEDGEMENTS
We thank Bill Shipley and Annikki Mäkelä for helpful comments on the manuscript. This work was supported by the Swedish Council for Forestry and Agricultural Research.
Supplementary Material
Received: 25 April 2003; Returned for revision: 21 July 2003; Accepted: 3 September 2003 Published electronically: 17 October 2003
References
- ÅgrenGI.1985. Theory for growth of plants derived from the nitrogen productivity concept. Physiologia Plantarum 64: 17–28. [Google Scholar]
- ÅgrenGI.1996. Nitrogen productivity or photosynthesis minus respiration to calculate plant growth. Oikos 76: 529–535. [Google Scholar]
- ÅgrenGI, Bosatta E.1998.Theoretical ecosystem ecology – understanding element cycles. Cambridge: Cambridge University Press. [Google Scholar]
- ÅgrenGI, Ingestad T.1987. Root:shoot ratio as a balance between nitrogen productivity and photosynthesis. Plant, Cell and Environment 10: 579–586. [Google Scholar]
- ÅgrenGI, Wikström JF.1993. Modelling carbon allocation – a review. New Zealand Journal of Forestry Science 23: 343–353. [Google Scholar]
- ÅgrenGI, Shaver GR, Rastetter EB.1999. Nutrients: dynamics and limitations. In: Lou Y, Mooney HA eds. Carbon dioxide and environmental stress San Diego: Academic Press, 333–345. [Google Scholar]
- BaxterR, Ashenden TW, Sparks TH, Farrar JF.1994. Effects of elevated carbon‐dioxide on 3 montane grass species. 1. Growth and dry‐matter partitioning. Journal of Experimental Botany 45: 305–315. [Google Scholar]
- BloomAJ, Chapin III TS, Mooney HA.1985. Resource limitation in plants – an economic analogy. Annual Review of Ecology and Systematics 16: 363–392. [Google Scholar]
- BolinderMA, Angers DA, Dubuc JP.1997. Estimating shoot to root ratios and annual carbon inputs in soils for cereal crops. Agriculture, Ecosystems and Environment 63: 61–66. [Google Scholar]
- BrouwerR.1983. Functional equilibrium: sense or nonsense. Netherlands Journal of Agricultural Science 31: 335–348. [Google Scholar]
- CanhamCD, Berkowitz AR, Kelly VR, Lovett GM, Ollinger SV, Schnurr J.1996. Biomass allocation and multiple resource limitation in tree seedlings. Canadian Journal of Forest Research 26: 521–1530. [Google Scholar]
- CannellMGR, Dewar RC.1994. Carbon allocation in trees: a review of concepts for modelling. Advances in Ecological Research 25: 59–104. [Google Scholar]
- CannellMGR, Thornley JHM.2000. Modelling the components of plant respiration: some guiding principles. Annals of Botany 85: 45–54. [Google Scholar]
- de GrootCC, Marcelis LFM, van den Boogaard R, Lambers H.2002. Interactive effects of nitrogen and irradiance on growth and partitioning of dry mass and nitrogen in young tomato plants. Functional Plant Biology 29: 1319–1328. [DOI] [PubMed] [Google Scholar]
- De Pinheiro HenriquesAR, Marcelis LFM.2000. Regulation of growth at steady‐state nitrogen nutrition in lettuce (Lactuca sativa L.): interactive effects of nitrogen and irradiance. Annals of Botany 86: 1073–1080. [Google Scholar]
- EricssonT.1995. Growth and shoot:root ratio of seedlings in relation to nutrient availability. Plant and Soil 168/169: 205–214. [Google Scholar]
- FieldC, Mooney HA.1983. Leaf age and seasonal effects on light, water, and nitrogen use efficiency in a California shrub. Oecologia (Berlin) 56: 348–355. [DOI] [PubMed] [Google Scholar]
- HilbertDW.1990. Optimization of plant root: shoot ratios and internal nitrogen concentration. Annals of Botany 66: 91–99. [Google Scholar]
- IngestadT, Ågren GI.1991. The influence of plant nutrition on biomass allocation. Ecological Applications 1: 168–174. [DOI] [PubMed] [Google Scholar]
- IngestadT, McDonald AJS.1989. Interaction between nitrogen and photon flux density in birch seedlings at steady‐state nutrition. Physiologia Plantarum 77: 1–11. [Google Scholar]
- IngestadT, Hellgren O, Ingestad Lund AB.1994a.Data base for tomato plants at steady state. Methods and performance of tomato plants (Lycopersicon esculentum Mill. cv. solentos) under non‐limiting conditions and under limitation by nitrogen and light. Report 74. Department of Ecology and Environmental Research, Swedish University of Agricultural Sciences. [Google Scholar]
- IngestadT, Hellgren O, Ingestad Lund AB.1994b.Data base for birch plants at steady state. Performance of birch plants (Betula pendula Roth.) under non‐limiting conditions and under limitation by nitrogen and light. Report 75. Department of Ecology and Environmental Research, Swedish University of Agricultural Sciences. [Google Scholar]
- JohnsonIR, Thornley JHM.1987. A model of shoot: root partitioning with optimal growth. Annals of Botany 60: 133–142. [Google Scholar]
- McConnaughayKDM, Coleman JS.1998. Can plants track changes in nutrient availability via changes in biomass partitioning? Plant and Soil 202: 201–209. [Google Scholar]
- RastetterEB, Shaver GR.1992. A model of multiple‐element limitations for acclimating vegetation. Ecology 73: 1157–1174. [Google Scholar]
- ReichPB.2002. Root–shoot relations: optimality in acclimation and adaptation or the ‘‘Emperor’s new clothes’’? In: Waisel Y, Eshel A, Kafkafi U eds. Plant roots – the hidden half New York: Marcel Dekker, 205–220. [Google Scholar]
- RyanMG, Hubbard RM, Pongracic S, Raison RJ, McMurtrie RE.1996. Foliage, fine‐root, woody‐tissue and stand respiration in Pinus radiata in relation to nitrogen status. Tree Physiology 16: 333–343. [DOI] [PubMed] [Google Scholar]
- RyserP, Verduyn B, Lambers H.1997. Phosphorus allocation and utilization in three grass species with contrasting response to N and P supply. New Phytologist 137: 293–302. [DOI] [PubMed] [Google Scholar]
- ShipleyB.2000. Plasticity in relative growth rate and its components following a change in irradiance. Plant Cell and Environment 23: 1207–1216. [Google Scholar]
- ThornleyJHM.1972. A balanced quantitative model for root: shoot ratios in vegetative plants. Annals of Botany 36: 431–441. [Google Scholar]
- ThornleyJHM.1995. Shoot: root allocation with respect to C, N and P: an investigation and comparison of resistance and teleonomic models. Annals of Botany 75: 391–405. [Google Scholar]
- ThornleyJHM.1998. Modelling shoot: root relations: the only way forward? Annals of Botany 81: 165–171. [Google Scholar]
- WaringRH, Landsberg JJ, Williams M.1998. Net primary production of forests: a constant fraction of gross primary production? Tree Physiology 18: 129–134. [DOI] [PubMed] [Google Scholar]
- WilsonJB.1988. A review of evidence on the control on shoot: root ratio, in relation to models. Annals of Botany 61: 433–449. [Google Scholar]
Associated Data
This section collects any data citations, data availability statements, or supplementary materials included in this article.