

Abstract
Background
Chronic obstructive pulmonary disease (COPD) is associated with local and systemic inflammation. The knowledge of interaction and co-variation of the inflammatory responses in different compartments is meagre.
Method
Healthy controls (n = 23), smokers with (n = 28) and without (n = 29) COPD performed spirometry and dental examinations. Saliva, induced sputum, bronchoalveolar lavage (BAL) fluid and serum were collected. Inflammatory markers were assessed in all compartments using ELISA, flow cytometry and RT-PCR.
Results
Negative correlations between lung function and saliva IL-8 and matrix metalloproteinase-9 (MMP-9) were found in smokers with COPD. IL-8 and MMP-9 in saliva correlated positively with periodontal disease as assessed by gingival bleeding in non-smokers.
Tumor necrosis factor-α (TNF-α) in saliva, serum and TNF-α mRNA expression on macrophages in BAL-fluid were lower in smokers than in non-smokers. There were positive correlations between soluble TNF-α receptor 1 (sTNFR1) and soluble TNF-α receptor 2 (sTNFR2) in sputum, BAL-fluid and serum in all groups. Sputum interleukin-8 (IL-8) or interleukin-6 (IL-6) was positively correlated with sTNFR1 or sTNFR2 in non-smokers and with sTNFR2 in COPD.
Conclusion
Saliva which is convenient to collect and analyse, may be suitable for biomarker assessment of disease activity in COPD. An attenuated TNF-α expression was demonstrated by both protein and mRNA analyses in different compartments suggesting that TNF-α response is altered in moderate and severe COPD. Shedding of TNFR1 or TNFR2 is similarly regulated irrespective of airflow limitation.
Keywords: Chronic obstructive pulmonary disease, Tumor necrosis factor, Biomarkers, Saliva
Introduction
Chronic obstructive pulmonary disease (COPD) is characterized by airway inflammation, chronic airflow limitation, progressive tissue destruction, extra-pulmonary manifestations and systemic inflammation. Several studies had shown the relationship between inflammatory biomarkers and exacerbations as well as systemic inflammation in COPD [1,2]. The inflammatory response in COPD is dominated by neutrophils and chemokines/cytokines such as tumor necrosis factor-α (TNF-α) and interleukin-8 (IL-8), which are of importance for neutrophils recruitment [3]. Also interleukin-6 (IL-6), a pro-inflammatory cytokine, is increased locally in the airways and systemically in COPD, especially in association with acute exacerbations [4]. TNF-α is capable of macrophage activation and stimulation of matrix metalloproteinase production [5], and the effects are mediated through interaction with tumor necrosis factor receptor 1 (TNFR1, TNF receptor 55) and tumor necrosis factor receptor 2 (TNFR2, TNF receptor 75), which are expressed on the surface of a number of cell types [6]. The TNFRs also appear in soluble forms which are generated by proteolytic cleavage of the cell surface bound TNFR in response to inflammatory mediators such as endogenous TNF-α [7]. Matrix metalloproteinase-9 (MMP-9) degrades components of the extracellular matrix which alters the balance between MMP-9 and its inhibitor [8], tissue inhibitor of metaloproteinases-1 (TIMP-1) that plays a critical role in inducing airway remodelling. Chronic destructive periodontal disease is characterized by chronic inflammation of the periodontal tissues. Smoking, which is the main risk factor for COPD, also increases the risk for periodontal disease by 5 to 20 times [9]. There are epidemiological studies suggesting a co-variation between periodontal disease and COPD [10] but a causal relationship between the two diseases has not been convincingly demonstrated.
In this cross sectional study inflammatory biomarkers, of importance in COPD were assessed in different compartments (mouth, large and small airways and blood) in smokers with and without COPD and healthy non-smokers. The aim was to find out whether or not the inflammatory processes in smokers are similarly regulated in different tissues and to what extent the presence of airway obstruction influences these outcomes.
Materials and methods
Subjects and study design
Twenty-three non-allergic, healthy non-smokers and 57 current smokers with a cumulative exposure of ≥5 pack-years were included. Smokers with a post-bronchodilator FEV1/FVC <0.7 and FEV1 of 40-70% of predicted value were included in the COPD group (n = 28), and smokers with a post-bronchodilator FEV1/FVC >0.7 and FEV1 > 70% of predicted value were included in the non-COPD group (n = 29) (Table 1). Spirometry was performed according to the ATS/ERS guidelines. Subjects with a history of asthma, other pulmonary disease or serious heart disease were excluded. Exacerbations during the last month prior to the study constituted an exclusion criterion.
Table 1.
Characteristics of the participants
| Healthy non-smokers | Smokers without COPD | Smokers with COPD | |
|---|---|---|---|
| Subjects n | n = 23 | n = 29 | n = 28 |
| Age yrs Mean (range) | 55 (41-72) | 53 (38-66) | 61 (48-73)**### |
| Gender male/female | 15/8 | 14/15 | 11/17 |
| BMI Mean (range) | 25.0 (19.7-31.2) | 25.1 (20.4-32.7) | 23.7 (17.3-29.7) |
| Smoking(pack-yrs) Mean (range) | 0 | 36 (5-120) | 37 (15-60) |
| FEV1% predicted (post- bronchodilator) | 102 (97-106) | 96 (91-100) | 58***### (51-65) |
| FEV1/FVC (post-bronchodilator) | 0.80 (0.77-0.82) | 0.77 (0.75-0.79) | 0.55***### (0.51-0.58) |
Results are presented as mean and 95% confidence intervals or range.
Between groups comparisons were assessed by ANOVA and Fisher’s PLSD.
BMI: Body mass index; FVC: Forced Vital Capacity; FEV 1: Forced Expiratory Volume in one second.
**, ***indicate P < 0.01 and P < 0.001, respectively, compared with healthy non-smokers.
### indicate P < 0.001 compared with smokers without COPD.
A clinical periodontal examination included assessment of periodontal pockets depth, gingival bleeding, and number of remaining teeth and occurrence of dental plaque. Periodontal tissue inflammation was assessed by gingival bleeding on probing, expressed as percentage of bleeding sites. Saliva, induced sputum and broncho-alveolar lavage (BAL) were collected on three separate days. Blood samples were drawn on the bronchoscopy day. Characterizations and periodontal status of the subjects have been described elsewhere [11].
All subjects gave their informed consent and the study was approved by the ethics committee at Karolinska Institutet, Stockholm, Sweden.
Saliva
The subjects were not allowed to brush their teeth, eat, drink (except water) or smoke at least 90 minutes before the visit. After rinsing their mouth twice with cold water, salivation was stimulated by watching a basket of lemons. After 10 minutes collection by repeated spitting into a sterile Falcon tube, the saliva was weighed and centrifuged at 3600 rpm, at 4°C, 4 minutes. The supernatant was collected and stored in -80°C until analyses.
Induced sputum
Sputum induction and processing were performed as previously described [12]. After inhalation of salbutamol (0.4 mg), sputum was induced by inhaling increased concentrations of saline (0.9%, 3%, 4% and 5%), by using an ultrasonic nebulizer. At each saline concentration, FEV1 was measured. The subjects were asked to blow their noses and rinse their mouths with water after each concentration, and then to cough deeply and to make an attempt to expectorate sputum. A sample that macroscopically appeared to be free from saliva and had a weight > 1 g was considered adequate. An equal volume of 0.1% dithiothreitol was added to the whole sputum sample and rocked for 15-20 minutes in a 37°C water bath, and then the samples were filtered and centrifuged. The supernatant was collected and stored at -80°C until analyses. The cell pellet was re-suspended using PBS and put on ice until antibody staining for flow cytometry.
Trypan blue was used to determine total cell number and cell viability. Differential cell counts were performed by counting approximately 300 cells on cytospins and stained with May-Grünwald Giemsa, and the data have been presented elsewhere [13]. Sputum samples containing more than 30% of squamous epithelial cells were excluded from the analysis.
Broncho-alveolar lavage (BAL)
Bronchoscopy was performed as previously described [14]. After pre-medication with morphine or pethidine and scopolamine, a bronchoscopy was performed using local anesthesia with xylocaine. The bronchoscope was wedged in a middle lobe segmental bronchus and isotonic saline (5 × 50 ml) was instilled into the airway tree and gently sucked back. The lavage fluid was collected and after centrifugation, the supernatant was stored in - 80°C until analyses. The cell pellet was re-suspended, then total cell count and differential cell count were performed as done with sputum samples [13]. The cells were re-suspended in RPMI cell medium supplemented with 5% serum and then put into petri dishes at a concentration of 2 million cells/dish After 2 hours the non-adherent cells and supernatants were discarded and the adhered cells (macrophages) were prepared for mRNA analysis.
Serum/blood
Peripheral blood was collected in supplement-free tubes and ethylene diaminetetra-acid (EDTA) vacutainer tubes (BD Bioscience, New Jersey, USA). The samples in supplement free tubes were left 60 minutes to clot and then centrifuged twice at 3000 rpm, for 10 minutes. The obtained serum was then aliquoted and stored in -70°C until analyses. The samples in EDTA vacutainer tubes were used for flow cytometry analysis.
Flow cytometry
For TNFR1 and TNFR2 analyses of neutrophils in sputum (100 000 cells in total) and blood neutrophils and monocytes in whole blood (100 μL) were incubated with 10 μL monoclonal antibodies (anti-CD120a (TNFR1)-PE clone H398, anti-CD120b (TNFR2)-PE clone 80 M2, IOTest®) for 20 minutes. Isotype-matched antibodies were used as negative controls. After incubation, the samples were fixed and centrifuged, then stored at 2 – 8°C and analyzed within 2 hours. Analyses were performed by FACSCalibur™ and median fluorescent intensity (MFI) was determined by CELLQuest™ (BD Bioscience Pharmingen) and relative median fluorescent intensity (rMFI) was calculated.
The sTNFR1 and sTNFR2 in supernatant from sputum, BAL fluid and serum were detected using BD™ Cytometric Bead Array (CBA) flex set (BD Bioscience Pharmingen). Analyses were performed by FACSCalibur™ and the concentration of sTNFR1 and sTNFR2 were determined by FCAP Array™ Software (BD Bioscience Pharmingen). The range of the standard curve was 0-10000 pg/ml for sTNFR1 and 0-2500 pg/ml for sTNFR2.
mRNA preparation and real-time PCR
Preparation of mRNA from alveolar macrophage was performed in eight subjects from each group. Total mRNA was isolated by PureLink™ Micro-to-Midi Total RNA Purification System (Initrogen). DNase I, amplification grade was used to remove the genomic DNA (Initrogen). First-strand cDNA was synthesized from 0.5 μg of total mRNA, using QuantiTect® Reverse Transcription Kit (Qiagen, Hilden, Germany). The ABI Power SYBR Green Master mix (Applied Biosystems) was used to perform the RT-PCR, also the primers were purchased from Invitrogen. The widely used cDNA of glyceraldehydes-3-phosphate dehydrogenase (GAPDH) was adopted as an internal control gene. 1 μl cDNA was used in each 25 μl PCR reaction volume to identify the products of interest.
Data were analyzed using 7500 Software v.2.0.1, the results were then calculated and expressed as 2-ΔCt.
ELISA
Measurement of IL-6 and IL-8 in saliva, sputum and BAL-fluid was performed using an in- house ELISA [15]. The lower detection limit of the IL-6 assay was 3 pg/ml in all compartments. The limit of IL-8 assay of saliva and sputum was 50 pg/ml and for BAL was 12.5 pg/ml.
MMP-9 and TIMP-1 in supernatant from saliva, sputum, BAL-fluid and serum were measured using purchased DouSet ELISA MMP-9 Kit and DouSet ELISA TIMP-1 Kit (R&D SYSTEMS®). The measurements of TNF-α in supernatant from saliva, sputum and serum were performed by purchased HS quantikine ELISA Kit (R&D SYSTEMS®). The analyses of MMP-9, TIMP-1 and TNF-α were performed according to the manufacturer. For all the duplicated samples, an intra-assay variation <10% (for TNF-α, <20%) was accepted.
High-sensitivity CRP test
A high-sensitivity CRP (hs-CRP) test was used to measure serum level of C-reactive protein (CRP) with laser nephelometry.
Statistics
Depending on distribution of the data results are presented as means (95% confidence intervals) or medians (25 - 75 percentiles). Between groups comparisons were assessed by ANOVA followed by Fisher’s protected least significant difference (PLSD), or by Kruskal- Wallis test with the Mann-Whitney U test as a post hoc test when appropriate, and by means of Spearman’s rank correlation. A p-value <0.05 was considered significant. All data were analyzed using StatView version 5.0.1 (SAS Institute Inc., Cary NC).
Results
Clinical characteristics and dental signs
Characteristics of the subjects are shown in Table 1. Smoking habits were approximately 35 pack-years in both smoker groups. An impaired periodontal status was found in both smokers with and without COPD with no major difference between the two groups as previously described [11].
Saliva
The level of salivary TNF-α was significantly lower in the two smoker groups than in non- smokers (P < 0.001) whereas IL-8, MMP-9 and TIMP-1 in saliva did not differ between the groups (Table 2). There was a negative correlation between lung function and the salivary levels of IL-8 and MMP-9 in the COPD group (Figure 1). Gingival bleeding correlated positively with IL-8 and MMP-9 levels in saliva of non-smokers (Figure 2).
Table 2.
Inflammatory mediators in saliva
| Healthy non-smoker | Smokers without COPD | Smokers with COPD | ||
|---|---|---|---|---|
| IL-8 (pg/ml) | 307 (225-558) | 262 (208-407) | 360 (165-474) | P = 0.512 |
| MMP-9 (ng/ml) | 338 (105-679) | 170 (62-465) | 217 (101-351) | P = 0.437 |
| TIMP-1 (ng/ml) | 449 (225-814) | 354 (221-535) | 360 (241-469) | P = 0.556 |
| MMP-9/TIMP-1 | 0.54 (0.29-1.16) | 0.37 (0.23-1.10) | 0.38 (0.27-0.96) | P = 0.789 |
| TNF-α (pg/ml) | 2.04 (1.19-3.82) | 0.529*** (<0.5-1.25) | 0.704*** (<0.5-1.23) | P < 0.001 |
Results are presented as median and 25th-75th percentiles.
P-values indicate comparisons between groups (Kruskal-Wallis test), bold data indicate significance.
***indicate P < 0.001 compared with healthy non-smokers (Mann-Whitney U test).
Figure 1.
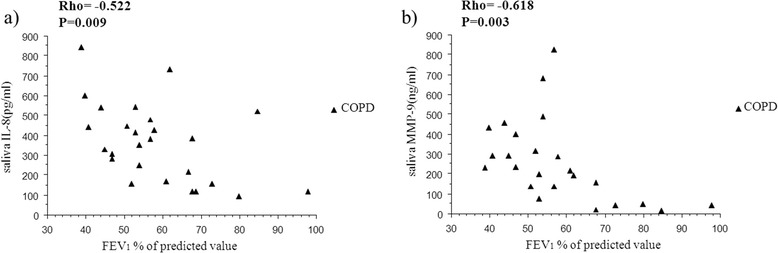
Relationship between lung function index and salivary biomarkers. Relationship between FEV1 (percent of predicted value) and IL-8 (a) and MMP-9 (b) in saliva in smokers with COPD. Rho indicates coefficient of correlation according to Spearman.
Figure 2.
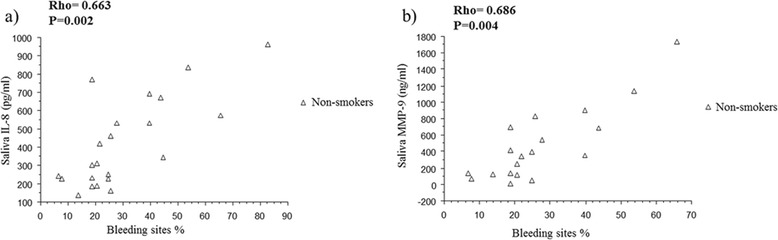
Relationship between dental statues and salivary biomarkers. Relationship between gingival bleeding index and IL-8 (a) and MMP-9 (b) in saliva in healthy non-smokers. Rho indicates coefficient of correlation according to Spearman.
Sputum
Both groups of smokers had higher levels of IL-6 in sputum than had non-smokers (P < 0.001), and sputum IL-8 was higher in COPD patients than in the non-smokers (P = 0.006; Table 3). TNF-α level in sputum was under detection limit in almost all cases. Sputum neutrophil TNFRs expression and sputum sTNFRs did not differ between the groups. The levels of sputum IL-6 and IL-8 were positively correlated with sputum sTNFR1 and sTNFR2 in healthy controls, and with sputum sTNFR2 in COPD patients (Figure 3).
Table 3.
Inflammatory mediators in respiratory tracts
| Healthy non-smoker | Smokers without COPD | Smokers with COPD | P-value | ||
|---|---|---|---|---|---|
| Sputum | IL-6 (pg/ml) | 33.4 (11.5-62.6) | 223*** (78.9-641) | 486*** (262-1031) | P < 0.001 |
| IL-8 (pg/ml) | 628 (430-1351) | 1100 (595-1710) | 2941**# (980-4912) | P = 0.010 | |
| MMP-9 (ng/ml) | 21.6 (13.3-109) | 57.3 (30.2-106) | 97.5 (17.4-408) | P = 0.091 | |
| TIMP-1 (ng/ml) | 117.5 (28.7-257) | 96.6 (46.4-242) | 166 (69.4-346) | P = 0.423 | |
| MMP-9/TIMP-1 | 0.35 (0.14-1.36) | 0.78 (0.19-1.72) | 0.70 (0.22-1.80) | P = 0.636 | |
| TNF-α (pg/ml) | 1.17 (<1.00-4.88) | <1.00 (<1.00) | <1.00 (<1.00-8.05) | P = 0.123 | |
| sTNFR1 (pg/ml) | 589 (59-996) | 205 (36-536) | 80 (16-560) | P = 0.207 | |
| sTNFR2 (pg/ml) | 140 (65-469) | 196 (118-344) | 204 (43-545) | P = 0.996 | |
| TNFR1 on neutrophils (rMFI) | 1.94 (1.46-2.48) | 2.70 (2.36-2.94) | 1.76 (1.44-2.12) | P = 0.076 | |
| TNFR2 on neutrophils (rMFI) | 1.58 (1.37-1.67) | 1.63 (1.35-1.93) | 1.34 (1.17-1.49) | P = 0.236 | |
| BAL | IL-8 (pg/ml) | <12.5 (<12.5-15.8) | <12.5 (<12.5-33.0) | 20.3 (<12.5-31.8) | P = 0.459 |
| MMP-9 (ng/ml) | 0.69 (0.44-1.45) | 0.97 (0.58-1.27) | 1.38 (0.93-3.87) | P = 0.112 | |
| TIMP-1 (ng/ml) | 1.85 (1.46-3.71) | 3.92** (2.71-9.34) | 3.46** (2.18-7.85) | P = 0.010 | |
| MMP-9/TIMP-1 | 0.51 (0.18-0.77) | 0.25 (0.11-0.62) | 0.42 (0.11-0.74) | P = 0.654 | |
| sTNFR1 (pg/ml) | 82.2 (75.4-118) | 161** (102-203) | 92.9 # (73.7-133) | P = 0.009 | |
| sTNFR2 (pg/ml) | 36.0 (24.8-50.2) | 77.7** (54.6-110) | 69.5* (34.6-88.5) | P = 0.003 | |
| Macrophages TNF-α (2 -∆Ct) | 0.05 (0.04-0.12) | 0.02* (0.02-0.03) | 0.01* (0.01-0.05) | P = 0.027 | |
| Macrophages TNFR1 (2 − ∆Ct) | 0.008 (0.005-0.01) | 0.006 (0.005-0.016) | 0.004*# (0.004-0.005) | P = 0.037 | |
| Macrophages TNFR2 (2 − ∆Ct) | 0.003 (0.001-0.003) | 0.003 (0.003-0.004) | 0.002 (0.001-0.002) | P = 0.055 |
Results are presented as median and 25th-75th percentiles.
P-values indicate comparisons between groups (Kruskal-Wallis test), bold data indicate significance.
In BAL fluid IL-6 was below detection limit (<3 pg/ml) with a few exceptions and TNF-α was below detection limit (<0.5 pg/ml) in all samples.
*, **, ***indicate P < 0.05 P < 0.01 and P < 0.001, respectively, compared with healthy non- smokers (Mann-Whitney U test).
# indicate P < 0.05 compared with smokers without COPD (Mann-Whitney U test).
Figure 3.
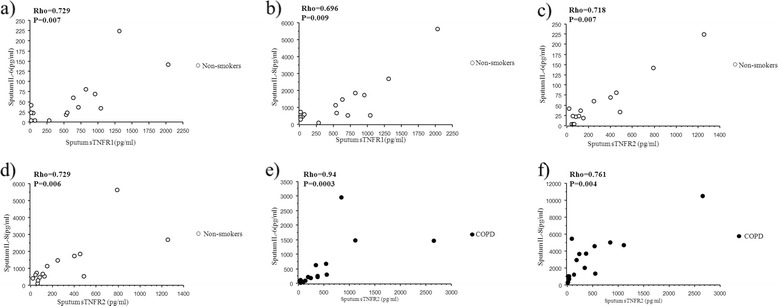
Relationship between sputum soluble TNFRs and sputum biomarkers. Relationship between sputum concentration of soluble TNF- α receptors and IL-6 and (a, c) and IL-8 (b, d) in healthy non-smokers. Relationship between sputum concentration of sTNFR2 and IL-6 and (e) and IL-8 (f) in smokers with COPD. Rho indicates coefficient of correlation according to Spearman.
Bronchoalveolar lavage (BAL)
In BAL-fluid, IL-8 was under detection limit in most cases and MMP-9 did not differ between the groups (P = 0.112; Table 3). The levels of TIMP-1 were higher in the two smoker groups than in non-smokers (P = 0.01; Table 3). The macrophage mRNA TNF-α was lower in both smoker groups than in the non-smokers (P = 0.027) while its receptor (TNFR1) was higher in COPD group than the other two groups (P = 0.037; Table 3). sTNFR1 levels in BAL fluid were higher in smokers without COPD than in the other two groups, and sTNFR2 levels were increased in both smoker groups compared with non-smokers (Table 3).
Serum/blood
TNF-α in serum was lower in the COPD group than in other two groups (P = 0.049; Table 4).
Table 4.
Inflammatory mediators in serum/blood
| Healthy non-smoker | Smokers without COPD | Smokers with COPD | |||
|---|---|---|---|---|---|
| Serum | MMP-9 (ng/ml) | 430 (251-577) | 490 (382-801) | 757** (557-1000) | P = 0.006 |
| TIMP-1 (ng/ml) | 282 (221-367) | 358 (266-442) | 338 (298-544) | P = 0.104 | |
| MMP-9/TIMP-1 | 1.21 (0.92-1.93) | 1.31 (0.96-2.29) | 2.13 (1.57-2.81) | P = 0.116 | |
| CRP (mg/l) | 0.75 (0.40-1.20) | 1.80** (1.00-2.70) | 2.45** (0.73-4.30) | P = 0.004 | |
| TNF-α (pg/ml) | 1.39 (0.72-1.93) | 1.22 (1.08-1.53) | 0.64*# (<0.5-1.30) | P = 0.049 | |
| sTNFR1 (pg/ml) | 1353 (817-1570) | 1322 (1166-1855) | 1302 (943-1829) | P = 0.848 | |
| sTNFR2 (pg/ml) | 3499 (2806-3708) | 3561 (3097-3919) | 3750 (2975-4261) | P = 0.826 | |
| Blood | TNFR1 on monocytes (rMFI) | 11.8 (10.5-15.0) | 12.5 (9.9-13.7) | 13.2 (11.3-15.7) | P = 0.600 |
| TNFR2 on monocytes (rMFI) | 28.2 (21.3-47.8) | 31.1 (25.0-40.9) | 44.0 (28.9-52.2) | P = 0.342 | |
| TNFR1 on neutrophils (rMFI) | 6.95 (6.24-9.45) | 6.74 (5.42-7.70) | 6.69 (5.70-7.92) | P = 0.509 | |
| TNFR2 on neutrophils (rMFI) | 11.8 (8.79-14.6) | 8.28 (7.30-9.97) | 7.82 (6.58-10.6) | P = 0.117 |
Results are presented as median and 25th-75th percentiles.
P-values indicate comparisons between groups (Kruskal-Wallis test), bold data indicate significance.
IL-6 and IL-8 were below detection limit (<3 pg/ml, <12.5 pg/ml) in serum in almost all subjects.
*, **indicate P < 0.05 and P < 0.01, respectively, compared with healthy non-smokers (Mann-Whitney U-test).
# indicate P < 0.05 compared with smokers without COPD (Mann-Whitney U-test).
The levels of CRP in serum were lower in non-smokers than in the two groups of smokers with no difference between the latter two (P = 0.004; Table 4). Serum MMP-9-level was higher in COPD than in healthy controls (P = 0.006; Table 4).
TNFR1 and TNFR2
There was a significant positive correlation between sTNFR1 and sTNFR2 both in BAL fluid and serum in all three groups (Figure 4). In sputum, there was a significant correlation between sTNFR1 and sTNFR2 in healthy controls and in smokers with COPD (Figure 4) but not in smokers without COPD (Rho = 0.476; P = 0.09).
Figure 4.
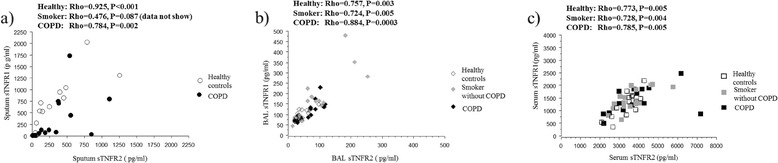
Relationship between soluble TNFR1 and TNFR2. Relationship between soluble TNFR1 and TNFR2 in sputum (a), BAL fluid (b) and serum (c). Rho indicates coefficient of correlation according to Spearman.
Pooled data from all three groups revealed a positive correlation between TNFR1 and TNFR2 expression on circulating neutrophils (Rho = 0.843; P = 0.0001; data not shown).
Discussion
In the present study it was shown that smokers have an ongoing inflammation in the central airways (sputum), peripheral airways (BAL fluid), and systemically (blood) and that this inflammatory response is rather associated with smoking than with the presence or absence of chronic airflow limitation.
Although the levels of IL-8 and MMP-9 did not differ between the groups there was a significant negative relationship between saliva levels of IL-8 and MMP-9 and lung function in COPD. The findings may indicate that the inflammatory markers in saliva may be related to disease severity in COPD. A similar relationship has previously been shown between biomarkers in serum and lung function [16]. However whether or not that saliva analyses may be useful for analyses of inflammatory markers in COPD has to be further explored. Intriguingly, we found a very strong correlation between IL-8 and MMP-9 in saliva and periodontal inflammation assessed by gingival bleeding in healthy non-smokers but not in the two groups of smokers. This finding indicates that these markers of inflammation in saliva are associated with periodontal inflammation under normal conditions and that this association is masked in smokers when inflammatory activity is triggered by a potent pro- inflammatory stimulus such as tobacco smoke.
The levels of TNF-α in saliva and serum as well as TNF-α mRNA expression in macrophages in BAL fluid were lower in smokers with COPD than in non-smokers. The attenuated TNF-α response was thus demonstrated in different compartments (mouth, serum, alveolar macrophages) by the use of different methods (protein and mRNA expression) clearly indicating a generally diminished TNF production and secretion. It has previously been shown that pro-inflammatory cytokine, e.g. TNF-α, responses to different stimuli are attenuated in macrophages and monocytes from smokers compared with non-smokers [17–19]. In a study by Pinto-Plata et al. [20], there was a positive relationship between the blood levels of TNF-α and the severity of the disease in patients with COPD and the patients with moderate disease (GOLD stage II) had the lowest blood levels of TNF-α [21]. Di Francia et al. [22] demonstrated unaltered TNF-α in patients with severe COPD who did not lose weight while COPD patients with unintentional weight loss had high TNF-α serum levels. Our COPD patients had normal BMI and were in stage II and III with a FEV1 > 40% of predicted value implying that, patients with low BMI and the most severe disease were not included. The clinical effect of TNF-α inhibitors has been shown to be poor in mild and moderate.
COPD [23,24] whereas an improved physical performance of TNF-α inhibition has been indicated in COPD patients with severe disease and cachexia [25]. It could thus be speculated that the TNF-α response in COPD is bimodal with an attenuated response in moderate disease and an enhanced response in more severely ill patients; in particular those who also experience weight loss. In addition, our COPD patients were in a stable phase with no recent exacerbations. According to Sapey et al. [26] TNF-α is quiescent in stable COPD and becomes biologically active during exacerbations which is in agreement with the low TNF-α activity found in our stable COPD patients.
Interestingly, sTNFR1 and sTNFR2 were strongly correlated in sputum, BAL fluid and serum as was TNF-receptor expression on blood neutrophils. We therefore conclude, although the production of TNFRs is assumed to use different signaling pathways , the regulation and shedding of TNFRs occur in parallel on a cellular level, as assessed by TNFR expression on neutrophils, locally in BAL fluid and sputum and systemically in serum.
The levels of sTNFRs in BAL fluid were higher in both groups of smokers than in non- smokers. It has previously been reported that high levels of sTNFRs may regulate TNF-α formation [27] and compete with membrane bound TNFRs [28]. Therefore, it seems likely that the high levels of sTNFRs in the smokers may inhibit the production of membrane bound TNFRs. This is in agreement with our finding of lower mRNA expression of TNFRs on BAL macrophages from both groups of smokers compared with non-smokers. In addition, as macrophages are a major producer of TNF-α [6], it could be speculated that macrophages respond to inflammation by regulating the levels of TNFRs along two different lines, enhancement of TNFR shedding and reduced production of membrane bound TNFRs.
The increased levels of the MMP-9 in extracellular matrix is of importance for remodeling processes in COPD, and its expression is considered to be regulated by specific inhibitors, such as TIMP-1 [29]. We found elevated levels of TIMP-1 in BAL fluid from both groups of smokers compared with healthy non-smokers and increased levels of MMP-9 in serum in the COPD group. Elevated levels of MMP-9 and TIMP-1 have been observed in serum [30], sputum [31] and BAL fluid in COPD [32,33]. However, there are contradicting results indicating decreased plasma levels of MMP-9 and TIMP-1 in COPD [33]. These inconsistent results might be due to the fact that MMP levels may vary over time in COPD [33]. Differences in the severity of the disease and smoking habits in the study population may also explain differences between studies.
In conclusion, we demonstrated that saliva, which is easy to collect, might be suitable for studies of biomarkers in smokers with and without COPD. Also, our study provides comprehensive information about different inflammatory biomarkers in different compartments and showed associations of different inflammatory markers both locally and systemically in smokers with and without COPD. An attenuated local and systemic TNF-α response as assessed both by mRNA and protein analyses was demonstrated in moderate COPD. Furthermore, a close relationship between TNF-α receptor expression and other inflammatory markers as well as between two different soluble TNF-α receptors was shown.
Acknowledgements
We would like to thank, Dr Maria Skedinger, Dr Anita Simhag Britt-Marie Sundblad Kristin Blidberg and Flora Gaber for valuable technical assistance.
Fundings
This study was support by grants from Swedish Heart and Lung Foundation, Karolinska Institutet, AstraZeneca Sweden and King Gustaf V’s and Queen Victoria’s Foundation.
Footnotes
Competing interests
The authors declare that they have no competing interests.
Authors’ contributions
Conceived and designed the experiments: JJ, IVS, JB, BB, BD, ASL, KL and LP. Performed the experiments and analyzed the data: JJ, IVS, JB, BB, BD, ASL, LP and KL. Wrote the paper: JJ, IVS, JB, BB, BD, ASL, KL and LP. All authors read and approved the final manuscript.
Contributor Information
Jie Ji, Email: jie.ji@ki.se.
Ida von Schéele, Email: idavonscheele@hotmail.com.
Jan Bergström, Email: jan.bergstrom@ki.se.
Bo Billing, Email: bo.billing@karolinska.se.
Barbro Dahlén, Email: Barbro.Dahlen@ki.se.
Ann-Sofie Lantz, Email: Ann-Sofie.Lantz@ki.se.
Kjell Larsson, Email: Kjell.Larsson@ki.se.
Lena Palmberg, Email: Lena.Palmberg@ki.se.
References
- 1.Agusti A, Edwards LD, Rennard SI, MacNee W, Tal-Singer R, Miller BE, Vestbo J, Lomas DA, Calverley PM, Wouters E, Crim C, Yates JC, Silverman EK, Coxson HO, Bakke P, Mayer RJ, Celli B. Persistent systemic inflammation is associated with poor clinical outcomes in COPD: a novel phenotype. PLoS One. 2012;7(5):e37483. doi: 10.1371/journal.pone.0037483. [DOI] [PMC free article] [PubMed] [Google Scholar]
- 2.Thomsen M, Ingebrigtsen TS, Marott JL, Dahl M, Lange P, Vestbo J, Nordestgaard BG. Inflammatory biomarkers and exacerbations in chronic obstructive pulmonary disease. JAMA. 2013;309(22):2353–2361. doi: 10.1001/jama.2013.5732. [DOI] [PubMed] [Google Scholar]
- 3.Keatings VM, Collins PD, Scott DM, Barnes PJ. Differences in interleukin-8 and tumor necrosis factor-alpha in induced sputum from patients with chronic obstructive pulmonary disease or asthma. Am J Respir Crit Care Med. 1996;153(2):530–534. doi: 10.1164/ajrccm.153.2.8564092. [DOI] [PubMed] [Google Scholar]
- 4.He ZH, Chen Y, Chen P, Wu GB, Cai S. Local inflammation occurs before systemic inflammation in patients with COPD. Respirology. 2010;15(3):478–484. doi: 10.1111/j.1440-1843.2010.01709.x. [DOI] [PubMed] [Google Scholar]
- 5.Lim S, Roche N, Oliver BG, Mattos W, Barnes PJ, Chung KF, 4 Pt 1 Balance of matrix metalloprotease-9 and tissue inhibitor of metalloprotease-1 from alveolar macrophages in cigarette smokers. regulation by interleukin-10. Am J Respir Crit Care Med. 2000;162:1355–1360. doi: 10.1164/ajrccm.162.4.9910097. [DOI] [PubMed] [Google Scholar]
- 6.Tartaglia LA, Goeddel DV. Two TNF receptors. Immunol Today. 1992;13(5):151–153. doi: 10.1016/0167-5699(92)90116-O. [DOI] [PubMed] [Google Scholar]
- 7.Vernooy JH, Kucukaycan M, Jacobs JA, Chavannes NH, Buurman WA, Dentener MA, Wouters EF. Local and systemic inflammation in patients with chronic obstructive pulmonary disease: soluble tumor necrosis factor receptors are increased in sputum. Am J Respir Crit Care Med. 2002;166(9):1218–1224. doi: 10.1164/rccm.2202023. [DOI] [PubMed] [Google Scholar]
- 8.Churg A, Zhou S, Wright JL. Series “matrix metalloproteinases in lung health and disease”: matrix metalloproteinases in COPD. Eur Respir J. 2012;39(1):197–209. doi: 10.1183/09031936.00121611. [DOI] [PubMed] [Google Scholar]
- 9.Bergstrom J. Tobacco smoking and chronic destructive periodontal disease. Odontology. 2004;92(1):1–8. doi: 10.1007/s10266-004-0043-4. [DOI] [PubMed] [Google Scholar]
- 10.Si Y, Fan H, Song YQ, Zhou X, Zhang J, Wang ZM. Association between periodontitis and chronic obstructive pulmonary disease in a Chinese population. J Periodontol. 2012;83(10):1288–1296. doi: 10.1902/jop.2012.110472. [DOI] [PubMed] [Google Scholar]
- 11.Bergstrom J, Cederlund K, Dahlen B, Lantz AS, Skedinger M, Palmberg L, Sundblad BM, Larsson K. Dental health in smokers with and without COPD. Plos One. 2013;8(3):e59492. doi: 10.1371/journal.pone.0059492. [DOI] [PMC free article] [PubMed] [Google Scholar]
- 12.Strandberg K, Ek A, Palmberg L, Larsson K. Fluticasone and ibuprofen do not add to the effect of salmeterol on organic dust-induced airway inflammation and bronchial hyper-responsiveness. J Intern Med. 2008;264(1):83–94. doi: 10.1111/j.1365-2796.2008.01928.x. [DOI] [PubMed] [Google Scholar]
- 13.von Scheele I, Larsson K, Dahlen B, Billing B, Skedinger M, Lantz AS, Palmberg L. Toll-like receptor expression in smokers with and without COPD. Resp Med. 2011;105(8):1222–1230. doi: 10.1016/j.rmed.2011.02.012. [DOI] [PubMed] [Google Scholar]
- 14.Larsson BM, Palmberg L, Malmberg PO, Larsson K. Effect of exposure to swine dust on levels of IL-8 in airway lavage fluid. Thorax. 1997;52(7):638–642. doi: 10.1136/thx.52.7.638. [DOI] [PMC free article] [PubMed] [Google Scholar]
- 15.Larsson K, Tornling G, Gavhed D, Muller-Suur C, Palmberg L. Inhalation of cold air increases the number of inflammatory cells in the lungs in healthy subjects. Eur Respir J. 1998;12(4):825–830. doi: 10.1183/09031936.98.12040825. [DOI] [PubMed] [Google Scholar]
- 16.Vestbo J, Edwards LD, Scanlon PD, Yates JC, Agusti A, Bakke P, Calverley PMA, Celli B, Coxson HO, Crim C, Lomas DA, MacNee W, Miller BE, Silverman EK, Tal-Singer R, Wouters E, Rennard SI. Changes in forced expiratory volume in 1 second overtime in COPD. New Engl J Med. 2011;365(13):1184–1192. doi: 10.1056/NEJMoa1105482. [DOI] [PubMed] [Google Scholar]
- 17.Berenson CS, Wrona CT, Grove LJ, Maloney J, Garlipp MA, Wallace PK, Stewart CC, Sethi S. Impaired alveolar macrophage response to Haemophilus antigens in chronic obstructive lung disease. Am J Respir Crit Care Med. 2006;174(1):31–40. doi: 10.1164/rccm.200509-1461OC. [DOI] [PMC free article] [PubMed] [Google Scholar]
- 18.Chen H, Cowan MJ, Hasday JD, Vogel SN, Medvedev AE. Tobacco smoking inhibits expression of proinflammatory cytokines and activation of IL-1R-associated kinase, p38, and NF-kappaB in alveolar macrophages stimulated with TLR2 and TLR4 agonists. J Immunol. 2007;179(9):6097–6106. doi: 10.4049/jimmunol.179.9.6097. [DOI] [PubMed] [Google Scholar]
- 19.Birrell MA, Wong S, Catley MC, Belvisi MG. Impact of tobacco-smoke on key signaling pathways in the innate immune response in lung macrophages. J Cell Physiol. 2008;214(1):27–37. doi: 10.1002/jcp.21158. [DOI] [PubMed] [Google Scholar]
- 20.Pinto-Plata V, Casanova C, Mullerova H, de Torres JP, Corado H, Varo N, Cordoba E, Zeineldine S, Paz H, Baz R, Cortopassi F, Celli BR. Inflammatory and repair serum biomarker pattern association to clinical outcomes in COPD. Respir Res. 2012;13:71. doi: 10.1186/1465-9921-13-71. [DOI] [PMC free article] [PubMed] [Google Scholar]
- 21.American thoracic society Standardization of spirometry, 1994 update. Am J Respir Crit Care Med. 1995;152(3):1107–1136. doi: 10.1164/ajrccm.152.3.7663792. [DOI] [PubMed] [Google Scholar]
- 22.Di Francia M, Barbier D, Mege JL, Orehek J. Tumor necrosis factor-alpha levels and weight loss in chronic obstructive pulmonary disease. Am J Respir Crit Care Med. 1994;150(5 Pt 1):1453–1455. doi: 10.1164/ajrccm.150.5.7952575. [DOI] [PubMed] [Google Scholar]
- 23.van der Vaart H, Koeter GH, Postma DS, Kauffman HF, ten Hacken NH. First study of infliximab treatment in patients with chronic obstructive pulmonary disease. Am J Respir Crit Care Med. 2005;172(4):465–469. doi: 10.1164/rccm.200501-147OC. [DOI] [PubMed] [Google Scholar]
- 24.Dentener MA, Creutzberg EC, Pennings HJ, Rijkers GT, Mercken E, Wouters EF. Effect of infliximab on local and systemic inflammation in chronic obstructive pulmonary disease: a pilot study. Respiration. 2008;76(3):275–282. doi: 10.1159/000117386. [DOI] [PubMed] [Google Scholar]
- 25.Rennard SI, Fogarty C, Kelsen S, Long W, Ramsdell J, Allison J, Mahler D, Saadeh C, Siler T, Snell P, Korenblat P, Smith W, Kaye M, Mandel M, Andrews C, Prabhu R, Donohue JF, Watt R, Lo KH, Schlenker-Herceg R, Barnathan ES, Murray J. The safety and efficacy of infliximab in moderate to severe chronic obstructive pulmonary disease. Am J Respir Crit Care Med. 2007;175(9):926–934. doi: 10.1164/rccm.200607-995OC. [DOI] [PubMed] [Google Scholar]
- 26.Sapey E, Ahmad A, Bayley D, Newbold P, Snell N, Rugman P, Stockley RA. Imbalances between Interleukin-1 and Tumor Necrosis Factor Agonists and Antagonists in Stable COPD. J Clin Immunol. 2009;29(4):508–516. doi: 10.1007/s10875-009-9286-8. [DOI] [PubMed] [Google Scholar]
- 27.Yanbaeva DG, Dentener MA, Creutzberg EC, Wouters EF. Systemic inflammation in COPD: is genetic susceptibility a key factor? COPD. 2006;3(1):51–61. doi: 10.1080/15412550500493436. [DOI] [PubMed] [Google Scholar]
- 28.Mukhopadhyay S, Hoidal JR, Mukherjee TK. Role of TNFalpha in pulmonary pathophysiology. Respir Res. 2006;7:125. doi: 10.1186/1465-9921-7-125. [DOI] [PMC free article] [PubMed] [Google Scholar]
- 29.Brew K, Dinakarpandian D, Nagase H. Tissue inhibitors of metalloproteinases: evolution, structure and function. Biochim Biophys Acta. 2000;1477(1–2):267–283. doi: 10.1016/S0167-4838(99)00279-4. [DOI] [PubMed] [Google Scholar]
- 30.Navratilova Z, Zatloukal J, Kriegova E, Kolek V, Petrek M. Simultaneous up- regulation of matrix metalloproteinases 1, 2, 3, 7, 8, 9 and tissue inhibitors of metalloproteinases 1, 4 in serum of patients with chronic obstructive pulmonary disease. Respirology. 2012;17(6):1006–1012. doi: 10.1111/j.1440-1843.2012.02197.x. [DOI] [PubMed] [Google Scholar]
- 31.Beeh KM, Beier J, Kornmann O, Buhl R. Sputum matrix metalloproteinase-9, tissue inhibitor of metalloprotinease-1, and their molar ratio in patients with chronic obstructive pulmonary disease, idiopathic pulmonary fibrosis and healthy subjects. Respir Med. 2003;97(6):634–639. doi: 10.1053/rmed.2003.1493. [DOI] [PubMed] [Google Scholar]
- 32.Sethi S, Maloney J, Grove L, Wrona C, Berenson CS. Airway inflammation and bronchial bacterial colonization in chronic obstructive pulmonary disease. Am J Respir Crit Care Med. 2006;173(9):991–998. doi: 10.1164/rccm.200509-1525OC. [DOI] [PMC free article] [PubMed] [Google Scholar]
- 33.D’Armiento JM, Goldklang MP, Hardigan AA, Geraghty P, Roth MD, Connett JE, Wise RA, Sciurba FC, Scharf SM, Thankachen J, Islam M, Ghio AJ, Foronjy RF. Increased matrix metalloproteinase (MMPs) levels do not predict disease severity or progression in emphysema. Plos One. 2013;8(2):e56352. doi: 10.1371/journal.pone.0056352. [DOI] [PMC free article] [PubMed] [Google Scholar]