

This study describes an assessment of local data uses and needs in large urban health departments.
Keywords: BCHC, informatics, informatics needs, information, public health data
Abstract
Context:
The epidemiologic shift in the leading causes of mortality from infectious disease to chronic disease has created significant challenges for public health surveillance at the local level.
Objective:
We describe how the largest US city health departments identify and use data to inform their work and we identify the data and information that local public health leaders have specified as being necessary to help better address specific problems in their communities.
Design:
We used a mixed-methods design that included key informant interviews, as well as a smaller embedded survey to quantify organizational characteristics related to data capacity. Interview data were independently coded and analyzed for major themes around data needs, barriers, and achievements.
Participants:
Forty-five public health leaders from each of 3 specific positions—local health official, chief of policy, and chief science or medical officer—in 16 large urban health departments.
Results:
Public health leaders in large urban local health departments reported that timely data and data on chronic disease that are available at smaller geographical units are difficult to obtain without additional resources. Despite departments' successes in creating ad hoc sources of local data to effect policy change, all participants described the need for more timely data that could be geocoded at a neighborhood or census tract level to more effectively target their resources. Electronic health records, claims data, and hospital discharge data were identified as sources of data that could be used to augment the data currently available to local public health leaders.
Conclusions:
Monitoring the status of community health indicators and using the information to identify priority issues are core functions of all public health departments. Public health professionals must have access to timely “hyperlocal” data to detect trends, allocate resources to areas of greatest priority, and measure the effectiveness of interventions. Although innovations in the largest local health departments in large urban areas have established some methods to obtain local data on chronic disease, leaders recognize that there is an urgent need for more timely and more geographically specific data at the neighborhood or census tract level to efficiently and effectively address the most pressing problems in public health.
Industrialization and immigration resulted in overcrowded housing and a general lack of sanitation in large urban areas throughout the United States in the 1900s. These conditions contributed to repeated outbreaks of infectious disease.1,2 Local health departments (LHDs) in these large urban areas responded to this challenge with innovations and improvements to sanitation, vaccination programs, and disease surveillance; this significantly reduced infectious disease morbidity and mortality.1,2 In the early 1900s, for example, New York City had at least 8 major epidemics of cholera, dysentery, smallpox, and diphtheria, which together took more than 25 000 lives.3 However, by 1925, the city had virtually eliminated deaths due to these communicable diseases. These accomplishments were possible, in part, because local health officials were able to collect and use data about specific practices in specific places. During the 20th century, advances in laboratory techniques and technologies, improved screening tests, and more accurate disease reporting translated into faster and better responses to disease outbreaks.4
While control of communicable diseases—both known and emerging—continues to be a priority,1,2,5–14 the increased prevalence of chronic disease presents new challenges for LHDs.15–23 Chronic disease accounted for 4 times the proportion of all US deaths in 2000 compared with those in 1900.24 By 1925 in New York City, mortality rates for cancer and heart disease were more than 175%, which is greater than that just 50 years earlier. By 1925, the mortality rate associated with diseases of the arteries had already increased 650% compared with that of the late 1800s.3 The top 3 causes of death in 1900—pneumonia, tuberculosis, and diarrhea and enteritis—have been replaced by heart disease, cancer, and stroke.1,24
As disease dynamics have changed and the role of personal behaviors in premature mortality has been more widely recognized, surveys—such as the Behavioral Risk Factor Surveillance Survey (BRFSS; piloted in 1981, initiated nationally in 1993), Youth Risk Behavior Survey (initiated in 1991), Pregnancy Risk Assessment and Monitoring System (initiated in 1988), National Health and Nutrition Examination Survey (first conducted in 1971, done annually since 1999)—were implemented to provide state-level data to aid agencies trying to target resources to reduce behavioral risks and their consequent illnesses.25 The emergence of these state-level surveys demonstrated an understanding that national data may not be applicable to the conditions found in any given state.25 A similar argument could justify the need for data at the substate and subcounty levels—state- or county-level data may not be applicable to the conditions in a given community or neighborhood. However, for methodologic reasons, these surveys rarely provide any data below county levels, such as data from neighborhoods, census tracts, block groups, or other common subcity geographic jurisdictions.26,27 States and even some cities have implemented corresponding efforts to collect estimates of disease prevalence and correlates below the county level,26,28 but few mechanisms were developed that had the geographic precision and clinical accuracy necessary to monitor chronic conditions at the local level.3,29,30
The relatively recent expansion of health information technology (IT) has presented new opportunities for the systematic collection and analysis of large-scale health care data to inform public health practice.31 In 2008, 9.4% of all nonfederal acute care hospitals had adopted at least a basic electronic health record (EHR) system.32 Federally funded incentives have contributed to a 5-fold increase in at least basic EHR adoption from 2008 to 2013.32 The increase in EHR adoption along with the proliferation of other electronically captured, digitized health information has increased the availability of health care data.33 However, it is unclear how public health leaders will capitalize on this new source of information.
Today, leaders in large urban health departments are developing strategies to meet the critical need for precise and timely local data to inform decision-making both to improve public health and to use evidence-based policies to inform their work.34–42 These strategies have not been documented systematically, nor have the opinions of this group in relation to ongoing data needs that are required to ensure the continued future impact of LHDs. To gather this information, we interviewed local health officials and senior staff members—including scientific leads—who are responsible for the health of some of the country's largest municipalities, about their perspectives on data, their achievements to date in getting and using data to inform their public health strategies, and their views on the challenges and concerns they now face.
Methods
This analysis was part of a larger project that gathered perspectives on critical public health issues from leaders of the Big City Health Coalition (BCHC), a group representing 20 of the largest health departments. The BCHC LHDs cover 46 million people, or 15% of the US population. Detailed methods of the larger study have been described elsewhere.43 For this analysis, we used a mixed-methods design that included interviews with key informants and a smaller survey to capture organizational characteristics related to data capacity.
Between August and October 2013, we conducted semistructured interviews using a single interviewer with 45 leaders from 16 participating LHDs in the BCHC. The instruments were pretested with 5 current and former public health practitioners. These participants held 1 of 3 positions in each LHD—local health official, chief of policy, or chief science/medical officer. All 3 positions were not represented by every BCHC, as each agency does not necessarily have a chief science/medical officer or a chief of policy. Interview questions were open-ended and focused primarily on data needs, capacities, perceived achievements, and predictions about the future of public health informatics. Qualitative data were independently coded by 2 of the authors and were managed and analyzed in NViVo 10 (QSR International, Cambridge, Massachusetts). A preliminary codebook was developed on the basis of major sections of the interview instrument. The codebook was used independently by 2 researchers to code the interviews in 2 groups. After each round of coding, researchers compared results, disagreements in coding were resolved, and data were recoded using a finalized codebook. Data were analyzed in aggregate, as well as by department location.
All 45 participants took part in the open-ended interviews. However, only the chief science/medical officers were asked to complete the Web-based survey portion of the project, which asked about data and informatics capacities in their departments, since staff in these positions have the most experience and expertise in this aspect of health department work. We integrated the data during analysis, per the embedded mixed-methods design.44 This involved linking survey responses to interviewees and conducting several qualitative analyses with, for example, organizational capacities or levels of data use/sophistication in mind. We report these integrated results later. We pretested all instruments used in this study with 5 current and former public health practitioners. We report descriptive statistics below. Quantitative data were cleaned, managed, and analyzed in Stata 13 (StataCorp LP, College Station, Texas).
Results
LHD health IT and informatics capacity: Survey results
Survey questions given to health departments' chief science/medical officers (n = 12/14 responded) asked about how IT was used in their departments to collect and disseminate data. These departments more often collected data related to traditional public health concerns, such as monitoring of infectious disease and food inspections; collecting data about more contemporary health indicators, such as cancer or chronic disease was much less common.
Less than half of the LHDs used systems that collected or disseminated data from EHRs or health information exchanges (HIEs). Participants also indicated that there was considerable variation between departments systems capability for bidirectional reporting and exchange, as well as whether systems were able to access and use local or state data.
Prevalence of electronic data collection
Figure 1 shows the use of electronic data collections by the study participants. Twelve departments most commonly used electronic systems to collect data about control and prevention of communicable diseases. Eleven of 12 responding BCHC LHDs used electronic disease reporting systems, 10 used immunization registries, and 9 used electronic laboratory reporting. Few departments used electronic systems for disease registries: 2 had electronic cancer registries, and 7 had electronic registries for other diseases. At the program level, use of electronic data was more common in traditional public health areas such as (eg, reportable diseases, laboratory results, and case management). Few departments had data on food service inspections, mapping, and EHRs, or on management of disease outbreaks.
FIGURE 1 •.

Programs' Use of Electronic Data Collection (N = 12).
Use of HIEs
The use of HIEs was not widespread (Figure 2). Half of the LHDs reported that they had no interaction with HIEs, whereas the other half used HIEs for a variety of data, typically related to collecting and analyzing/integrating data on emerging infectious diseases. The HIEs were less commonly used for monitoring indicators of health care quality, chronic disease, or health disparities. Two departments reported using HIEs to monitor risk factors for chronic disease, such as smoking, physical activity, and diet; only one reported using an HIE for syndromic surveillance and another for environmental exposures. Only a few LHDs reported using HIEs to collect data, with several reporting use of HIEs for laboratory results and reportable diseases. Fewer than 3 respondents reported using HIEs for any other program activity, including EHRs, hospital discharge data, chronic disease monitoring, vital records, and the Supplemental Nutrition Program for Women, Infants, and Children.
FIGURE 2 •.
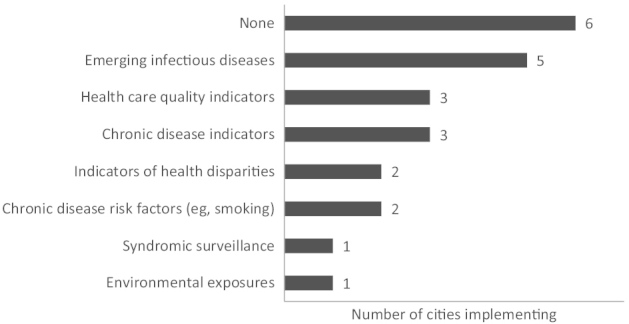
Cities' Use of Health Information Exchange (N = 12)
Capability for bidirectional reporting and exchange
Not all electronic systems are capable of sharing data bidirectionally, where each system is able to send and receive information from the other. Overall, this capability is uncommon among responding BCHC LHDs. Bidirectional exchange in health-related electronic data systems generally has developed following the pattern of electronic data collection overall, with 2-way exchange of data about reportable diseases and laboratory results coming first. While 12 departments reported that they collected information electronically on reportable diseases, only 9 had the capability for 2-way data exchange. Five of 10 departments that collected electronic data on case management could share information bidirectionally. Both of the 2 cancer registries were capable of bidirectional data exchange, but only 4 of 11 departments had the same capability with electronic laboratory reports on communicable diseases (Figure 3).
FIGURE 3 •.
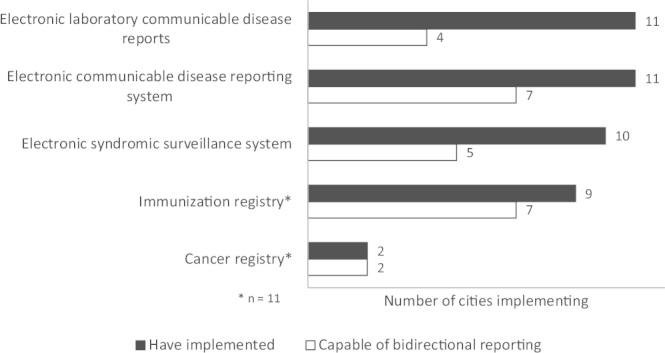
Cities' Implemenatation of Information Technology (N = 12)
Respondent perspectives on health IT and informatics needs and achievements: Interview results
Local sources of data
Interviews with 45 leaders of BCHC LHDs revealed that health departments collect data from a variety of local sources outside the health department to augment their local-level knowledge. Local sources of data included hospital discharge information, emergency medical services (EMS) data, school system data, and data from other city agencies. Thirteen of 16 participating BCHC departments received a variety of data from local hospitals or EMS, including hospital discharge data. One department collected EMS data to track bicycle and pedestrian injuries, homicides, intentional injuries, and narcotics-related information. In addition, some health departments create surveys and other data collection methods as ways to collect the local information they need.
In efforts to build a more comprehensive picture of health citywide, 7 departments reported collecting data from other city agencies, including departments of planning, housing, transportation, education, and law enforcement. Direct data-sharing agreements were also in place between 6 health departments and school systems within their jurisdictions, which allowed access to data on childhood body mass index. Ten health departments reported fielding their own community health surveys, paying for oversampling in their cities on state-administered surveys, such as the BRFSS, or collecting community data in some other way. All of these efforts were focused on gathering data that would allow analyses at small area levels.
Achievements using data
Respondents were asked to highlight their greatest public health achievements using local data. They stated that efforts to collect more data from more sources at increasingly local levels are needed to ensure that the right information is available to guide their efforts to promote and protect health (Table 1).
TABLE 1 •. Achievements Using Data.
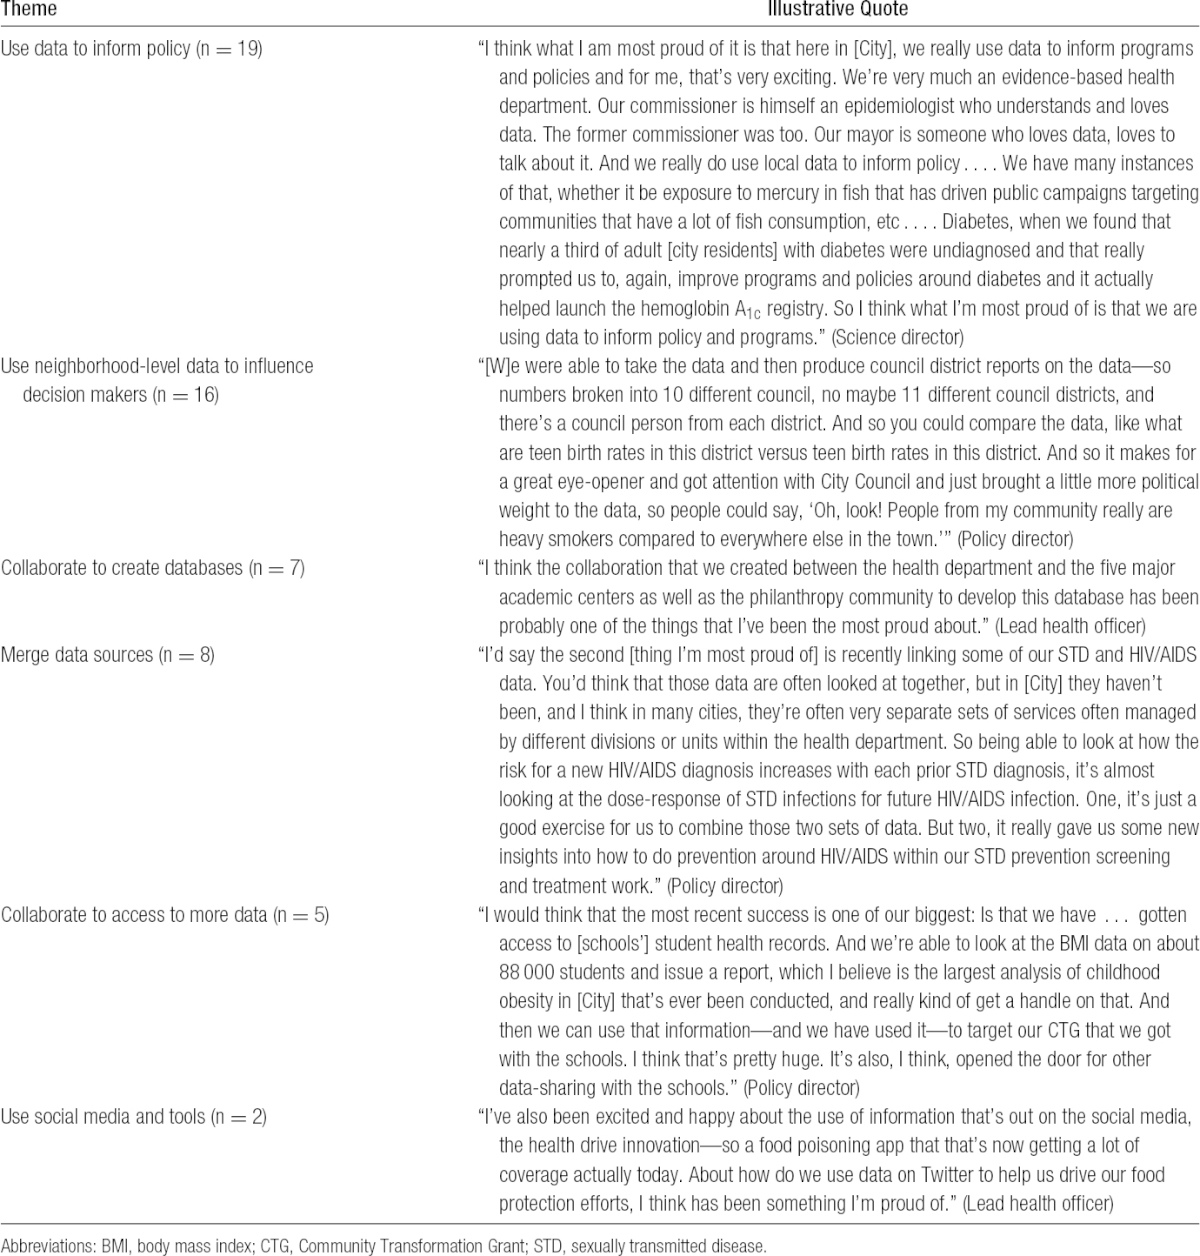
Most commonly, leaders said that their best achievements were being able to use data to inform policy decisions and using neighborhood-level data to educate local decision makers. They enumerated efforts either to use data to inform internal policy or to provide data to other health departments or community groups in efforts to improve policy. For instance, participants used:
measures of blood cotinine in the city's nonsmokers to advocate for smoke-free public spaces;
dynamic modeling of influenza outbreaks to recommend policies that limited the spread of influenza in schools;
health disparity data as drivers of overall population health status to inform policy makers on how to address disparities;
surveillance data to demonstrate the effectiveness of measures implemented to curb childhood obesity; and
alcohol outlet density data to support community organizations engaged in policy change.
Departments also sought to make public health problems more understandable to decision makers by using neighborhood-level data to highlight specific problems. One department created district-level reports for city council members on topics such as smoking or teen birth rates, information that became an “eye-opener” for council members whose own districts fared poorly. Another department used data on community-level environmental impacts to make the case for environmental justice regulation, whereas another used data on disparities to spur capital investment in new facilities to provide integrated health and human services.
In addition to using granular data to support arguments for policy change and action, respondents said that departments also used novel combinations of data sets to shed new light on problems. For example, one department noted the value of linking identifiers between sexually transmitted disease and HIV/AIDS data, which are often collected separately by isolated programs. Participants said that they also had successes with efforts that involved collaborating on data with other agencies and community partners to achieve common goals. As noted previously, some departments worked with schools as a way of accessing childhood body mass index data. Collaboration with schools was the most common, although leaders from one department reported collaborating with their city's housing authority to track the health of public housing residents as compared with non-public housing residents over time. In addition to forming partnerships to access key data, departments formed partnerships to share data, for example, working with outside entities to create a clearinghouse for data from both public health and nonpublic health sources. Health departments also mined “big data,” including the analysis of social media, such as Twitter.
Data needs
Despite big city health departments' perceived successes in creating ad hoc sources for local data and effecting policy change and other interventions by using that information, participants uniformly discussed persisting needs for more and higher-quality data (summarized in Table 2). Data specific to smaller local areas were cited as a top need by participants from 14 of 16 departments. Participants also said there would be benefits from access to community-level economic development data, along with more data from school systems, and improved “chronic disease and behavioral risk factor surveillance systems at a small-area level.” Respondents said that very granular data were most valuable for local decision making, whether those decisions were made within health departments or at levels that affected wider city or county policies, as indicated by comments in Table 2.
TABLE 2 •. Top Data Needs.
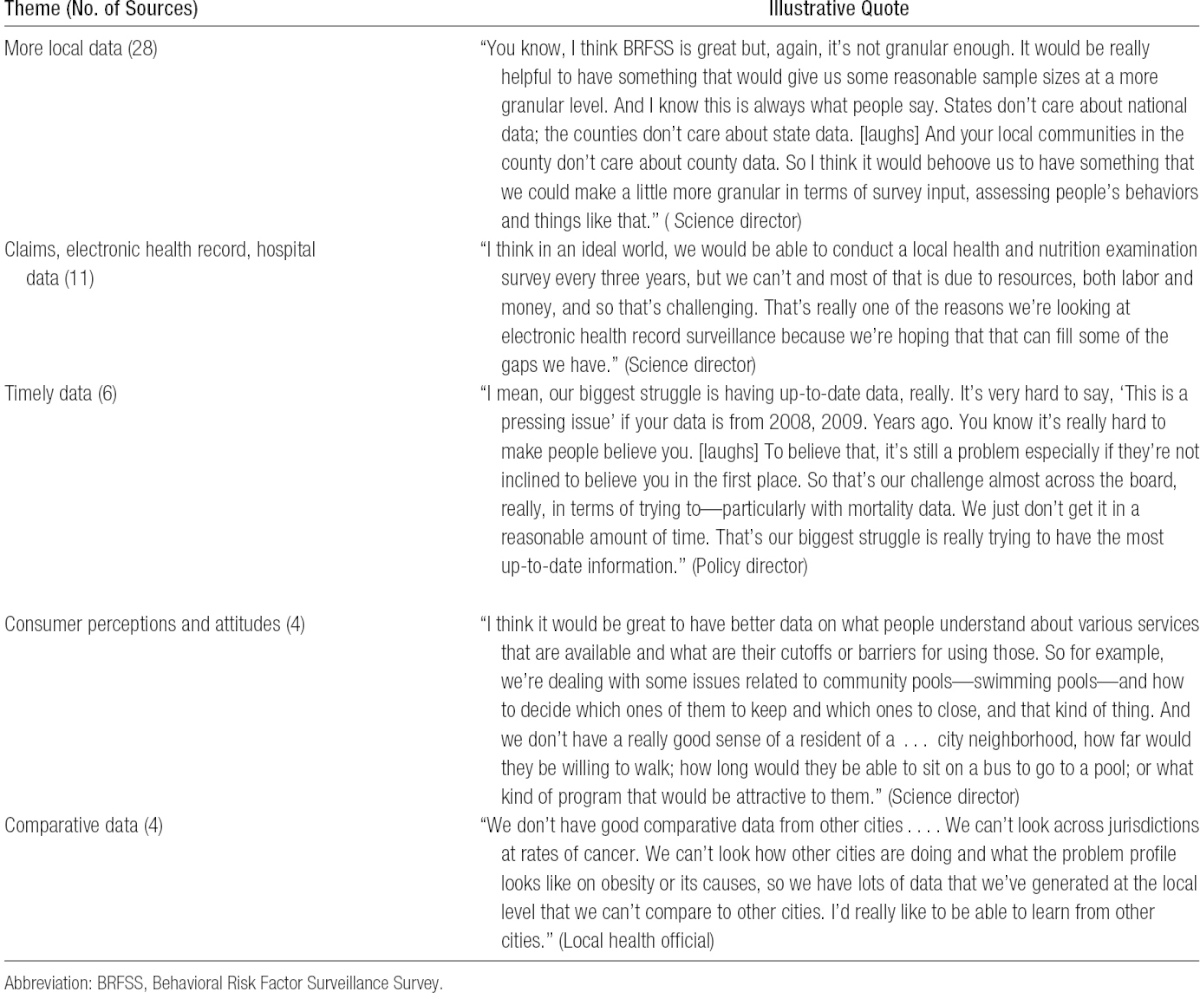
Participants expressed serious concern about the frequent long delays in getting data from sources such as state health departments, noting that they have sometimes had to wait 2 to 4 years to receive vital statistics data on their jurisdiction. Department heads noted that it was difficult to argue that a certain issue was important to address quickly when they only had outdated data to support their claims. Although some leaders said that they have found inventive ways to get information needed to take action, most said that they remained frustrated with the slow pace and bureaucratic hurdles in getting access to needed data.
Participants believed that their LHDs would benefit from additional data from hospital and ambulatory care settings, particularly data from EHRs. Respondents said that EHRs held significant potential for LHD surveillance, especially for chronic disease monitoring to guide action and geographic “hot spotting” of both communicable and chronic diseases not included in statutory reporting requirements. Some participants also noted that information about consumer perceptions and attitudes would be helpful in certain decision-making processes. For example, one participant explained how information about how far community members would travel to access a local swimming pool would help inform decisions about whether closing certain pools would have adverse effects on surrounding communities. Health department leaders also said that they needed data that would facilitate comparison of health indicators between jurisdictions to determine how their community's health status compared with others.
Discussion
A useful way to view these findings is in the context of the timeliness and geographic specificity of public health data as presented in Figure 4. In the early 1900s, health departments used current and address-level data (cell 3 in Figure 4) to study, understand, and address their problems controlling a limited number of communicable diseases. Public health departments were able to address problems effectively because they had the right information available to them.3 Timely local data are still the core ingredient for solutions to public health problems. However, as uniformly described by participants in our study, local public health professionals have limited access to geographically specific and timely local data, especially related to chronic disease.
FIGURE 4 •.
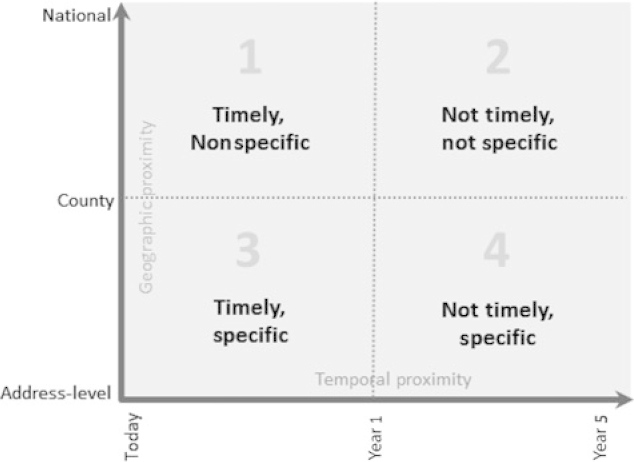
Conceptual Model of Public Health Data Needs in Local Health Departments
Today, chronic disease surveillance focuses on collecting data at national and state levels. These surveys, including the BRFSS, the Youth Risk Behavior Survey, the Pregnancy Assessment and Monitoring System, the National Health and Nutrition Examination Survey, and the National Health Interview Survey, rarely provide any data below the county level and can take years to be released when their potential benefit to strategic planning is more limited (cell 2 in Figure 4). While these surveillance strategies have developed, few mechanisms have been developed that provided the geographic precision and clinical accuracy necessary to monitor chronic conditions at the local level. Thus, LHDs have lost much of their ability to accurately monitor the health status of their communities with geographically specific and timely data.30,45 The chronic disease data available to LHDs do not have the precision to identify health problems at census tract, neighborhood, or even zip code levels; to provide the necessary evidence base to support programmatic and policy solutions; or to measure the impact of interventions. Even when data are available at an address level, as is the situation with mortality data, the delay in their availability drastically limits their impact and places LHDs in the position of implementing solutions today for problems documented more than a year ago (cell 4 in Figure 4).
Some cities have implemented local surveys similar to those implemented nationally to gather subcity data (eg, the Los Angeles County Health Survey and the New York City Health and Nutrition Examination Survey). While effective, local surveys can be costly and require significant staff resources. Completion of the 2013 New York City Health and Nutrition Examination Survey, for example, cost more than $4 million and required the efforts of the New York Department of Health and Mental Hygiene, the Hunter College School of Public Health, and several additional partners. Partly because of the cost, this was the first time that this type of survey had been fielded in New York City since 2004. Similarly, the Los Angeles County Heath Survey has an annual cost of $2 million. The costs and intensity of completing locally driven community surveys and competition for resources in local public health departments limit replication.
In the absence of the data needed, local public health leaders have implemented “guerilla-style” data-gathering techniques to access the information to make better and more timely decisions.46 For example, the Boston Public Health Commission (BPHC) investigated an increase in opioid overdose deaths.47 The BPHC first checked mortality data, but the only data available were 4 years old. The emergency department data it could access were 3 years old. However, because the BPHC has authority over Boston's EMS, it was able to access real-time, address-level EMS data that allowed it to pinpoint sources of the overdose problem and take action. Like the data used in Boston, several study participants noted the value of clinical data to provide geographically specific and timely data on chronic disease (cell 3 in Figure 4). Public health should strive for “gold standard” data collection and research studies whenever or wherever possible. However, this is often infeasible.48,49 Our respondents indicated that they frequently encounter situations that require rapid decisions or warrant immediate action. In these situations, public health leaders may need to use data for operational decision making that may not be “gold standard” but, nonetheless, can impact and improve the health of the public.
The major public health problems have changed over the last century—from communicable to chronic disease. The BCHC LHDs stated that to address population health issues, they must reduce the lag in data access. Data should also change from aggregate (above county level) information (cell 2 in Figure 4) to be as “hyperlocal” as possible, perhaps even to the census tract or address level (cell 3 in Figure 4). Although great advances have been made in chronic disease surveillance at the national and state levels, additional funding needs to focus on developing chronic disease and risk factor surveillance capacity at the local level.
The participants in this study noted the opportunity to leverage the national investment in the EHR infrastructure as a strategy to gain access to chronic disease data that are more timely and geographically specific (cell 3, Figure 4). In the next decade, the total cost of the federal EHR incentive program will exceed $19 billion.50 Given this investment, determining how these data can be augmented with other contextualizing data (eg, location of fast food outlets, availability of parks, incidents of violent crime, location of public housing, or housing foreclosures), and their use in developing policies with more timely and detailed information should be a priority. Some large urban health departments have already initiated projects that can capitalize on EHR data for public health purposes. For example, New York City is developing the NYC Macroscope as a way to use primary care practice EHRs to track conditions that are important to public health.51 Work is underway to compare the information in the NYC Macroscope against a gold standard, population-based examination survey to validate the effectiveness of using an EHR as a population health surveillance tool.51 The public health leaders who participated in this study supported the use of electronic health data to fill the many gaps in local health information. However, clear strategies and “how-to” guides are needed to facilitate partnerships between health care providers and public health leaders to maximize the potential impact of EHRs on population health.
Conclusion
Monitoring the status of community health is a core function of all public health departments.52 Public health professionals must have access to current local data on both risk factors and health status to effectively target interventions, wisely allocate resources, and assess the effects of interventions. While the innovations in our largest cities have allowed access to some local data related to chronic disease, LHDs still urgently need timelier and geographically specific data to efficiently and effectively address the most pressing problems in public health.
Footnotes
The authors declare no conflicts of interest.
REFERENCES
- 1.Centers for Disease Control and Prevention. Control of infectious diseases. MMWR Morb Mortal Wkly Rep. 1999;48(29):621–629. [PubMed] [Google Scholar]
- 2.Nelson KE, Williams CFM, Masters Williams C. Early history of infectious disease: epidemiology and control of infectious diseases. In: Infectious Disease Epidemiology: Theory and Practice. 2nd ed. Burlington, MA: Jones & Bartlett Publishers; 2007:1–15. [Google Scholar]
- 3.Novick LF, Morrow CB, Mays GP. Public Health Administration: Principles for Population-Based Management. Burlington, MA: Jones & Bartlett Publishers; 2007. [Google Scholar]
- 4.Achievements in public health, 1900-1999: changes in the public health system [reprinted from MMWR Morb Mortal Wkly Rep. 1999;48:1141-1147]. JAMA 2000;283(6):735–738. [DOI] [PubMed] [Google Scholar]
- 5.Morens DM, Folkers GK, Fauci AS. The challenge of emerging and re-emerging infectious diseases. Nature. 2004;430(6996):242–249. [DOI] [PMC free article] [PubMed] [Google Scholar]
- 6.Robinson KA, Baughman W, Rothrock G, et al. Epidemiology of invasive Streptococcus pneumoniae infections in the united states, 1995-1998: opportunities for prevention in the conjugate vaccine era. JAMA. 2001;285(13):1729–1735. [DOI] [PubMed] [Google Scholar]
- 7.McCaig LF, Hughes JM. Trends in antimicrobial drug prescribing among office-based physicians in the united states. JAMA. 1995;273(3):214–219. [PubMed] [Google Scholar]
- 8.Armstrong GL, Conn LA, Pinner RW. Trends in infectious disease mortality in the United States during the 20th century. JAMA. 1999;281(1):61–66. [DOI] [PubMed] [Google Scholar]
- 9.Mead PS, Slutsker L, Dietz V, et al. Food-related illness and death in the United States. Emerg Infect Dis. 1999;5(5):607–625. 10.3201/eid0505.990502. [DOI] [PMC free article] [PubMed] [Google Scholar]
- 10.National Center for Infectious Diseases. Addressing Emerging Infectious Disease Threats: A Prevention Strategy for the United States. Atlanta, GA: Centers for Disease Control and Prevention; 1994. [PubMed] [Google Scholar]
- 11.Citron KM. Trends in tuberculosis. Postgrad Med J. 1984;60(701):187–193. [DOI] [PMC free article] [PubMed] [Google Scholar]
- 12.Beitsch LM, Brooks RG, Menachemi N, Libbey PM. Public health at center stage: new roles, old props. Health Aff (Millwood). 2006;25(4):911–922. [DOI] [PubMed] [Google Scholar]
- 13.Baker EL, Potter MA, Jones DL, et al. The public health infrastructure and our nation's health. Annu Rev Public Health. 2005;26:303–318. 10.1146/annurev.publhealth.26.021304.144647. [DOI] [PubMed] [Google Scholar]
- 14.Bell JA, Hyland S, DePellegrin T, Upshur RE, Bernstein M, Martin DK. SARS and hospital priority setting: a qualitative case study and evaluation. BMC Health Serv Res. 2004;4(1):36. 10.1186/1472-6963-4-36. [DOI] [PMC free article] [PubMed] [Google Scholar]
- 15.Frieden TR. Asleep at the switch: local public health and chronic disease. Am J Public Health. 2004;94(12):2059–2061. 94/12/2059. [DOI] [PMC free article] [PubMed] [Google Scholar]
- 16.McKenna M, Taylor W, Marks J, Koplan J. Current issues and challenges in chronic disease control. Chronic Dis Epidemiol Control. 1998;2:1–26. [Google Scholar]
- 17.Steinbrook R. Facing the diabetes epidemic—mandatory reporting of glycosylated hemoglobin values in New York City. N Engl J Med. 2006;354(6):545–548. [DOI] [PubMed] [Google Scholar]
- 18.Frieden TR, Bassett MT, Thorpe LE, Farley TA. Public health in New York City, 2002-2007: confronting epidemics of the modern era. Int J Epidemiol. 2008;37(5):966–977. 10.1093/ije/dyn108. [DOI] [PubMed] [Google Scholar]
- 19.Plescia M, Young S, Ritzman RL. Statewide community-based health promotion: a North Carolina model to build local capacity for chronic disease prevention [published online ahead of print November 1, 2005]. Prev Chronic Dis. 2005;2(Spec no. A10). [PMC free article] [PubMed] [Google Scholar]
- 20.Stamatakis KA, Leatherdale ST, Marx CM, Yan Y, Colditz GA, Brownson RC. Where is obesity prevention on the map? Distribution and predictors of local health department prevention activities in relation to county-level obesity prevalence in the United States. J Public Health Manag Pract. 2012;18(5):402–411. 10.1097/PHH.0b013e318221718c. [DOI] [PMC free article] [PubMed] [Google Scholar]
- 21.McCord C. What's needed to fight chronic disease. Am J Public Health. 2005;95(6):930–931; author reply 931-932. 95/6/930-a. [DOI] [PMC free article] [PubMed] [Google Scholar]
- 22.United States Public Health Service. Office of the Surgeon General, Centers for Disease Control, National Center for Chronic Disease Prevention, Health Promotion, President's Council on Physical Fitness, Sports. Physical Activity and Health: A Report of the Surgeon General. Burlington, MA: Jones & Bartlett Learning; 1996. [Google Scholar]
- 23.Mokdad AH, Serdula MK, Dietz WH, Bowman BA, Marks JS, Koplan JP. The spread of the obesity epidemic in the United States, 1991-1998. JAMA. 1999;282(16):1519–1522. [DOI] [PubMed] [Google Scholar]
- 24.Mokdad AH, Marks JS, Stroup DF, Gerberding JL. Actual causes of death in the United States, 2000. JAMA. 2004;291(10):1238–1245. [DOI] [PubMed] [Google Scholar]
- 25.Centers for Disease Control and Prevention. BRFSS. http://www.cdc.gov/brfss/about/about_brfss.htm. Accessed June 1, 2014.
- 26.Committee on Public Health Strategies to Improve Health, Institute of Medicine. For the Public's Health: The Role of Measurement in Action and Accountability. Washington, DC: National Academies Press; 2010. [Google Scholar]
- 27.Simon PA, Wold CM, Cousineau MR, Fielding JE. Meeting the data needs of a local health department: the Los Angeles County Health Survey. Am J Public Health. 2001;91(12):1950–1952. [DOI] [PMC free article] [PubMed] [Google Scholar]
- 28.Hughes E, McCracken M, Roberts H, et al. Surveillance for Certain Health Behaviors Among States and Selected Local Areas: Behavioral Risk Factor Surveillance System, United States, 2004. Washington, DC: US Department of Health and Human Services; 2006. [PubMed] [Google Scholar]
- 29.Thacker SB, Berkelman RL. Public health surveillance in the United States. Epidemiol Rev. 1988;10:164–190. [DOI] [PubMed] [Google Scholar]
- 30.Thacker SB. Historical development. In: Principles and Practice of Public Health Surveillance. 2nd ed. New York, NY: Oxford University Press; 2000:1–15. [Google Scholar]
- 31.Diamond CC, Mostashari F, Shirky C. Collecting and sharing data for population health: a new paradigm. Health Aff (Millwood). 2009;28(2):454–466. 10.1377/hlthaff.28.2.454. [DOI] [PubMed] [Google Scholar]
- 32.Charles D, Gabriel M, Furukawa M. Adoption of Electronic Health Record Systems Among U.S. Non-federal Acute Care Hospitals: 2008-2013. Washington, DC: Office of the National Coordinator for Health Information Technology; 2014. ONC Data Brief No. 16. [Google Scholar]
- 33.de Brantes F, Emery DW, Overhage JM, Glaser J, Marchibroda J. The potential of HIEs as infomediaries. J Healthc Inf Manag. 2007;21(1):69–75. [PubMed] [Google Scholar]
- 34.Shefer A, Briss P, Rodewald L, et al. Improving immunization coverage rates: an evidence-based review of the literature. Epidemiol Rev. 1999;21(1):96–142. [DOI] [PubMed] [Google Scholar]
- 35.Joffe M, Mindell J. A framework for the evidence base to support health impact assessment. J Epidemiol Commun Health. 2002;56:132. [DOI] [PMC free article] [PubMed] [Google Scholar]
- 36.Brownson RC, Baker EA, Leet TL, Gillespie KN. Evidence-Based Public Health. New York, NY: Oxford University Press; 2003. [Google Scholar]
- 37.Anderson LM, Brownson RC, Fullilove MT, et al. Evidence-based public health policy and practice: Promises and limits. Am J Prev Med. 2005;28(5)(suppl):226–230. [DOI] [PubMed] [Google Scholar]
- 38.Hoard M, Homer J, Manley W, Furbee P, Haque A, Helmkamp J. Systems modeling in support of evidence-based disaster planning for rural areas. Int J Hyg Environ Health. 2005;208:117. [DOI] [PMC free article] [PubMed] [Google Scholar]
- 39.Brownson RC, Ballew P, Dieffenderfer B, Haire-Joshu D, Heath GW. Evidence-based interventions to promote physical activity: what contributes to dissemination by state health departments. Am J Prev Med. 2007;33:S66. [DOI] [PubMed] [Google Scholar]
- 40.Dobbins M, Jack S, Thomas H, Kothari A. Public health decision-makers' informational needs and preferences for receiving research evidence. Worldviews Evid-Based Nurs. 2007;4(3):156–163. [DOI] [PubMed] [Google Scholar]
- 41.Bagley P, Lin V. Public health systems research: the state of the field. Aust Health Rev. 2008;32(4):721–732. [DOI] [PubMed] [Google Scholar]
- 42.Mays GP, Smith SA. Evidence links increases in public health spending to declines in preventable deaths. Health Aff. 2011;30(8):1585–1593. [DOI] [PMC free article] [PubMed] [Google Scholar]
- 43.Hearne S, Castrucci B, Leider JP, Russo P, Rhoades E, Bass V. The future of urban health: needs, barriers, opportunities, and policy advancement at big city health departments. J Public Health Manag Pract. 2014;21(1):4–13. [DOI] [PMC free article] [PubMed] [Google Scholar]
- 44.Creswell JW, Clark VLP. Designing and Conducting Mixed Methods Research. Thousand Oaks, CA: Sage; 2007. [Google Scholar]
- 45.Remington P, Brownson RC, Wegner MV. Chronic Disease Epidemiology and Control. Washington, DC: American Public Health Association; 2010. [Google Scholar]
- 46.Tarini P. Big strides in community-level interventions at Health Datapalooza. http://www.rwjf.org/en/blogs/pioneering-ideas/2014/06/big_strides_in_commu.html. Accessed July 1, 2014.
- 47.Ferrer B. Lessons from the Big City Health Coalition. Paper presented at: Health Datapalooza 2014; June 3, 2014; Washington, DC. [Google Scholar]
- 48.Brownson RC, Roux AVD, Swartz K. Commentary. Generating rigorous evidence for public health: The need for new thinking to improve research and practice. Annu Rev Public Health. 2014;35(1):1–7. 10.1146/annurev-publhealth-112613-011646. [DOI] [PubMed] [Google Scholar]
- 49.Sanson-Fisher R, D'Este CA, Carey ML, Noble N, Paul CL. Evaluation of systems-oriented public health interventions: alternative research designs. Annu Rev Public Health. 2014;35(1):9–27. 10.1146/annurev-publhealth-032013-182445. [DOI] [PubMed] [Google Scholar]
- 50.Jha AK. Meaningful use of electronic health records: the road ahead. JAMA. 2010;304(15):1709–1710. [DOI] [PubMed] [Google Scholar]
- 51.New York City Department of Health and Mental Hygiene. New York City Macroscope. http://www.nyc.gov/html/doh/downloads/pdf/data/nyc-macro-summary.pdf. Accessed July 1, 2014.
- 52.Centers for Disease Control and Prevention. Ten essential services of public health. http://www.cdc.gov/nphpsp/essentialServices.html. Accessed March 5, 2014.