

This study discusses the organizational characteristics of the country's largest health departments, including those that form the Big Cities Health Coalition and quantifies the differences and variation among them.
Keywords: Big Cities Health Coalition (BCHC), large LHDs, organizational characteristics
Abstract
Approximately 150 million Americans lived in large metropolitan jurisdictions in 2013. About 1 in 7 Americans is served by a member of the Big Cities Health Coalition (BCHC), a group of 20 of the largest local health departments (LHDs) in the United States. In this brief, we describe the organizational characteristics of the country's largest health departments, including those that form the BCHC, and quantify the differences and variation among them. We conducted secondary analyses of the 2013 National Association of County & City Health Officials Profile, specifically characterizing differences between BCHC members and other large LHDs. The data set contained 2000 LHDs that responded to National Association of County & City Health Officials' 2013 Profile. While LHDs serving 500 000 or more people account for only 5% of all LHDs, they covered 50% of the US population in 2013. The BCHC members served approximately 46 million people. The BCHC LHDs had a greater number of staff, larger budgets, and were more involved in policy than their larger peers.
This supplement focuses on leadership perspectives from members of the Big Cities Health Coalition (BCHC)—a membership group of 20 of the nation's largest local health departments (LHDs). But what makes for a big city health department?
Public health systems and services researchers often examine characteristics of LHDs using the National Association of County & City Health Officials (NACCHO) Profile, a systematic longitudinal survey of LHDs in the United States. These comparisons frequently group health departments into categories on the basis of the size of the population served. As Mays has noted, one means of making these comparisons historically came from dichotomizing at 100 000 people served, as noted in Mays' critical works on operations and finance of large LHDs.1–4 More recently, these LHDs were typically grouped together by population served: fewer than 50 000 people served (small), 50 000 to 499 999 people served (medium), and 500 000 or more people served (large). Much of the previous research comparing LHDs of different jurisdictional sizes assumes homogeneity within these groups. However, all large LHDs are not the same; there may be as much variation among the large-sized LHD groups as there is between groups.5 The population served by the nation's 137 large-sized LHDs can range from 500 000 people to more than 9000 000; a range significantly greater than that found in any other group. The heterogeneity inherent among the large-sized LHDs contributed to the creation of the BCHC.
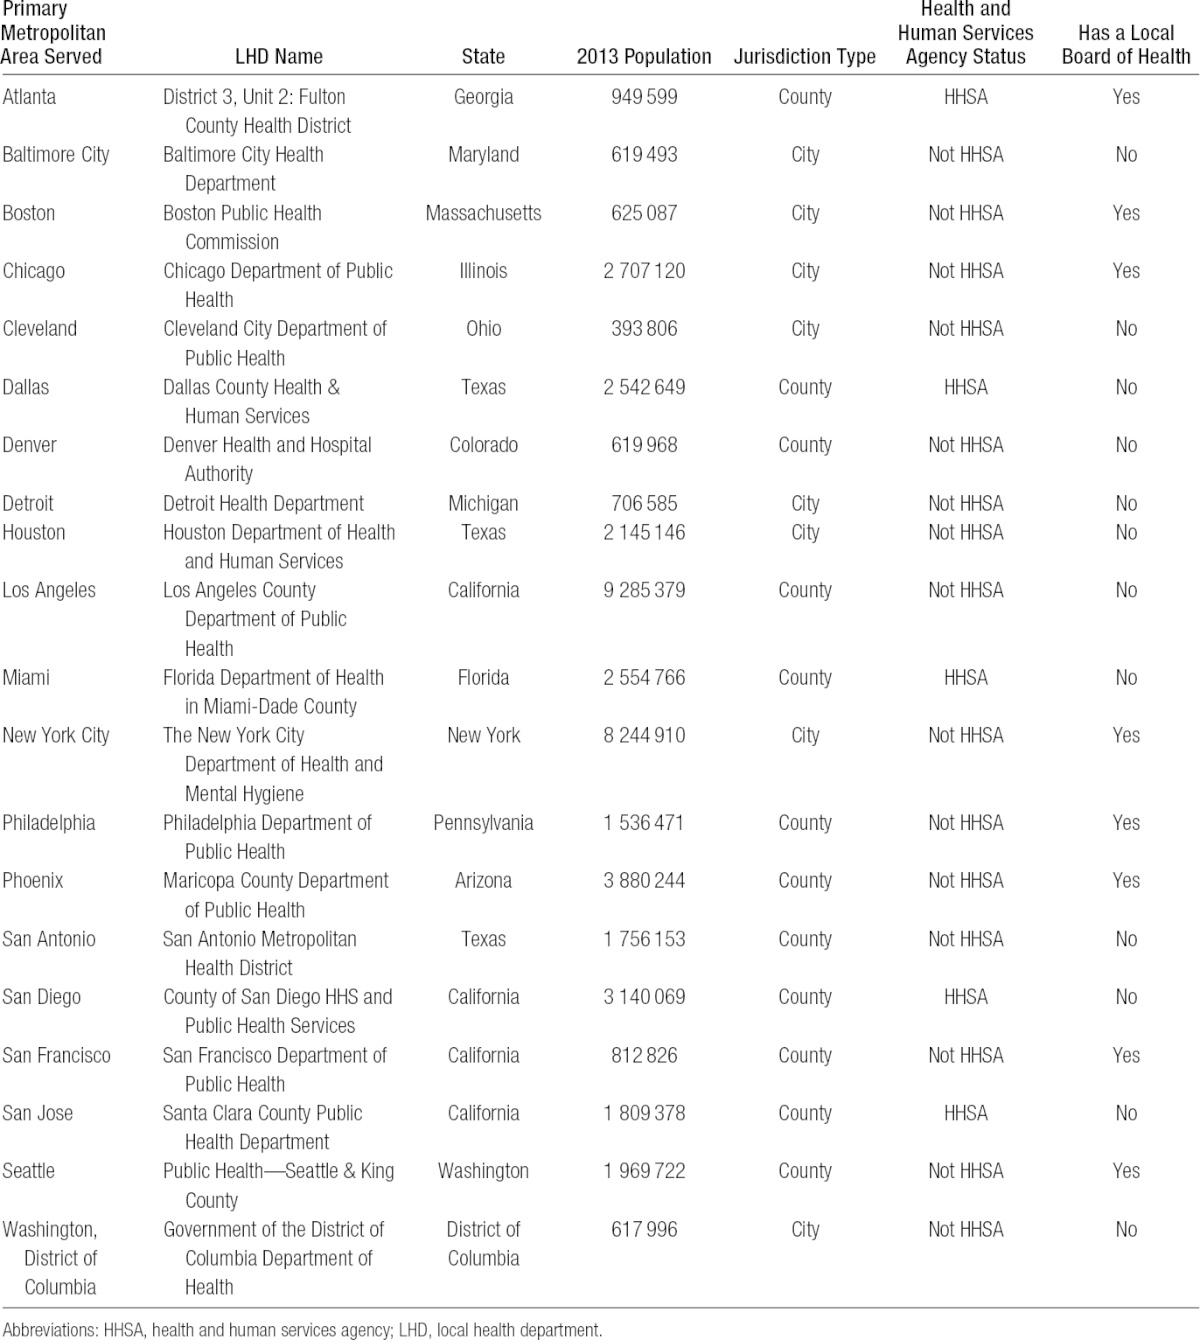
The BCHC was formed in 2002 as a membership group to allow leaders from large, urban health departments to connect around issues prominent in the big cities. The 20 member health departments are Atlanta, Baltimore, Boston, Chicago, Cleveland, Dallas, Denver, Detroit, Houston, Los Angeles, Miami, New York, Philadelphia, Phoenix, San Antonio, San Diego, San Francisco, San Jose, Seattle, and Washington, DC (Table 1). This brief will highlight characteristics of BCHC LHDs, as well as differences between BCHC LHDs and other large, urban health departments.
TABLE 1 •. Members of the Big Cities Health Coalition in 2014.
Methods
We used data from the 2013 NACCHO Profile.6 Through a Web-based survey, the Profile collects data from the nation's 2800 health departments (condensed into N = 2532 reporting units) on organizational characteristics. The response rate for the 2013 NACCHO Profile was 78%. There were 137 LHDs that served 500 000 or more people (including BCHC members). Ninety-two percent completed the survey. All but 1 BCHC member LHD completed the 2013 profile; financial and staffing data were manually entered on the basis of county documentation for this jurisdiction.7 Descriptive statistics are reported, as are inferential comparisons using the Tukey test for multiple comparisons of means and the Fisher exact test for bivariate comparisons of categorical data. Data were managed and analyzed in Stata 13 (StataCorp, College Station, Texas).
Results
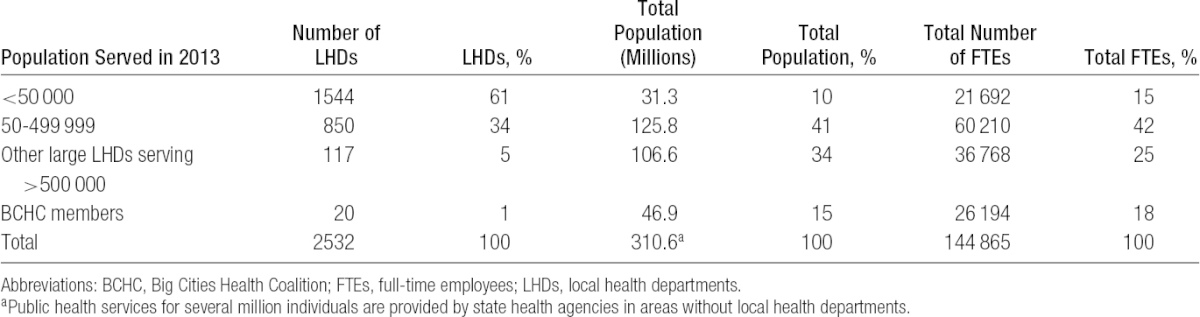
Approximately 5% of all LHDs nationally serve populations of 500 000 or more and serve about half the population of the United States (Table 1). Twenty of these 137 LHDs are BCHC members, representing fewer than 1% of all LHDs but serving 1 in 7 Americans (15% of the US population). The 46 million residents who are served BCHC LHDs live across 27 270 square miles. In contrast, the 1544 smallest LHDs serving fewer than 50 000 people serve 31 million residents across an estimated 1.4 million square miles. Despite similarities in size, BCHC LHDs are organized in a variety of ways. Twelve are housed within county government and 8 within city government; 4 are located within a Health and Human Services agency; and 12 do not have local boards of health but are administered in a different fashion (eg, by the mayor's office, or a county executive).
Staffing
The BCHC members have more full-time employees (FTEs) than the smallest 1554 health departments combined (Table 2): 1486 employees on average (median 772), compared with 340 employees on average (median 305) for other LHDs serving large jurisdictions of more than 500 000 people. On average, BCHC members employed 1309 FTEs (median 772, minimum 143, maximum 5826). Other large LHDs employed 311 FTEs on average (median 260, minimum 10, maximum 1040). Per capita staffing among LHDs varies considerably. The BCHC LHDs have 0.99 FTEs per 1000 residents on average (median 0.509, minimum 0.155, maximum 7.3), more than double other large LHDs. Other large (non-BCHC) LHDs have 0.40 FTEs per 1000 residents on average (median 0.34). Local health departments serving midsized jurisdictions had 0.57 FTEs per 1000 residents (median 0.46) and LHDs serving small jurisdictions had 1.06 FTEs per 1000 residents (median 0.71). The median FTEs per capita for rural jurisdictions were the highest among all groups. There was a stepwise decrease in the mean FTEs per capita from the BCHC LHDs to the other large LHDs to the medium-sized jurisdictions, but then an increase in the smallest jurisdictions approaches that of the BCHC LHDs' average. The employment of epidemiologists is another way BCHC LHDs look different from all other jurisdictions, including other large health departments (Table 2). In absolute terms, BCHC LHDs had more than 10 times more epidemiologist FTEs, on average, than other large LHDs. This relationship held after accounting for LHD size. Once population size is taken into account, BCHC LHDs had 4 times as many epidemiologist FTEs as other large LHDs, per capita (P < .01).
TABLE 2 •. Local Health Department Characteristics by Population Served in 2013 (Weighted)a.
LHD services and policymaking activities
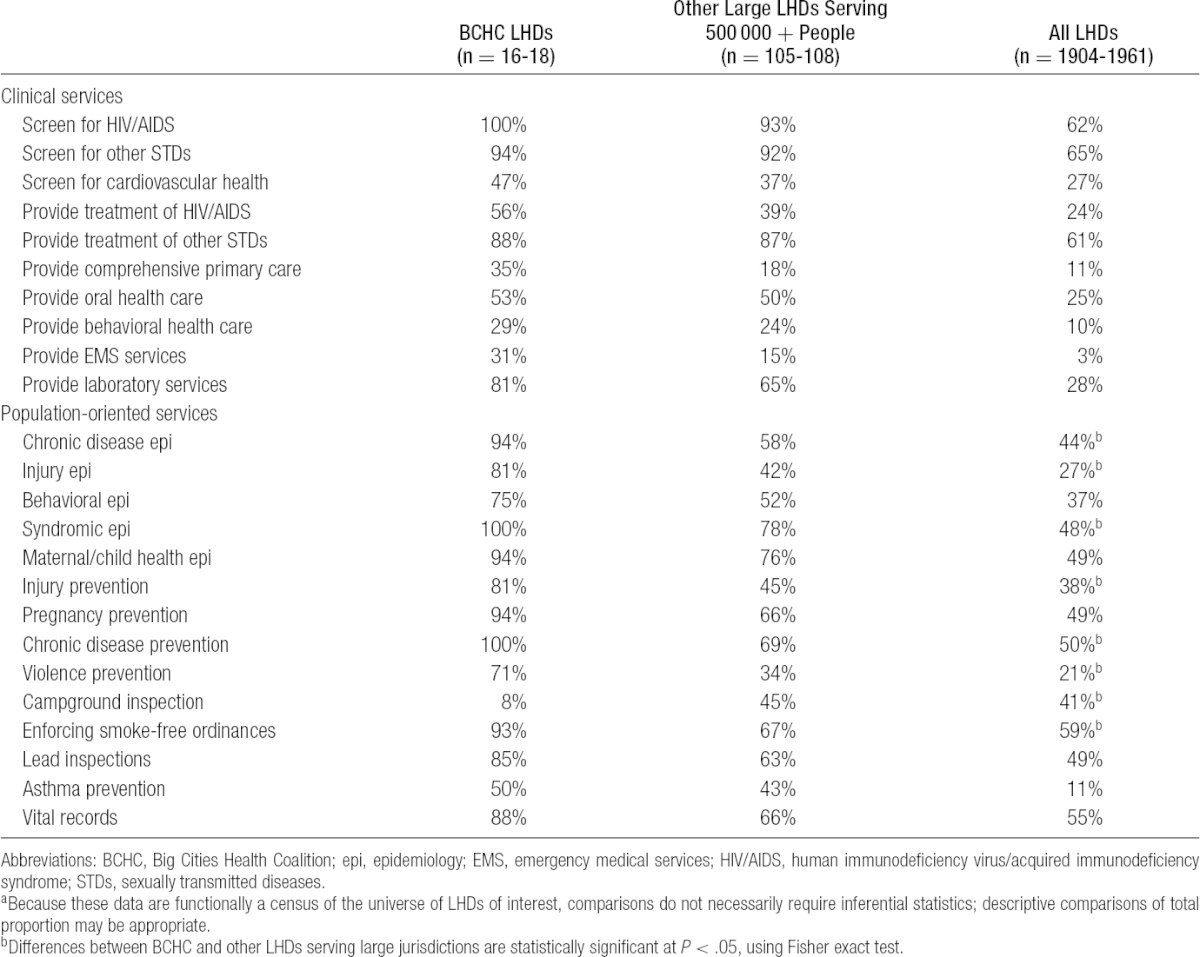
The BCHC jurisdictions provided a number of activities more frequently than did other large LHDs (Table 3), including several clinical infectious disease screening and treatment activities for HIV/AIDs and other sexually transmitted diseases as well as population-based services aimed at preventing chronic disease, enforcing smoke-free ordinances, and promoting injury prevention. Epidemiology activities are another area of difference between BCHC and other large LHDs. BCHC LHDs more commonly reported providing injury, behavioral, chronic disease, syndromic, and maternal/child health epidemiology than did other large LHDs.
TABLE 3 •. Comparison of Selected Activities Conducted by LHDs, by BCHC Member Statusa.
NACCHO tracks 5 significant areas of LHDs policy activities (Figure). Overall, NACCHO Profile data suggest that BCHC LHDs and other large LHDs are more active in policymaking than their smaller counterparts, especially at state and federal levels. Fewer than half of small LHDs said that they prepared issue briefs at the local, state, or federal level. Forty-two percent of BCHC members created issue briefs for federal audiences, compared with 17% of other large LHDs, 4% of medium-sized LHDs, and 2% of small LHDs. Ninety-five percent of BCHC members reported giving public testimony locally, compared with one-third of small LHDs. More than two-thirds of BCHC members said that they had given public testimony at the state level in 2012-2013. Overall, 100% of BCHC members said that they had worked on at least 1 of the 5 policy areas at the local level tracked by NACCHO in the past 2 years, 89% reported working on at least 1 at the state level, and 74% at the federal level. Among other large LHDs, 87% reported working on at least 1 policy area at the local level, 77% at the state level, and 36% at the local level. Overall, 81% of all LHDs reported being active in 1 of the 5 policy areas at the local level, 57% at the state level, and 15% at the federal level.
FIGURE •.
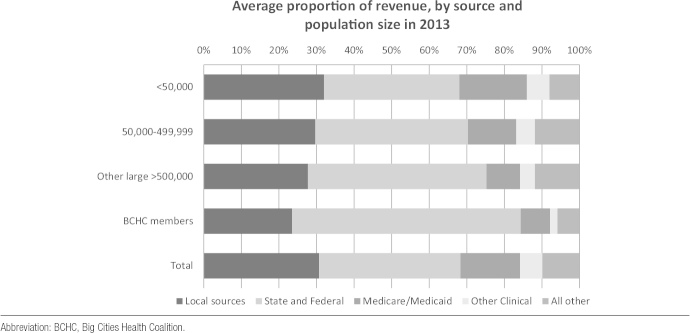
Average Proportion of LHD Revenue by Source.
Finances
Total expenditures in LHDs were strongly correlated with total FTEs (r = 0.95). The BCHC LHDs spent $311 million on average (median $100 million). Other large LHDs spent $42 million on average (median $30 million). The differences narrow considerably when adjusted for population size with a per capita calculation. In fiscal year 2013, spending in the BCHC LHDs averaged $79 per capita (median $48) compared with $43 per capita ($33 median) at other large LHDs. Seven BCHC members reported spending less than $50 per capita in their jurisdictions, and 1 jurisdiction spent $14 per capita. A difference in provision of certain high-cost services including comprehensive primary care, behavioral health care, and emergency medical services may explain some of these variations.
Discussion
The BCHC member cities are often grouped with other large health departments with jurisdictional sizes of 500 000 people or more. However, this analysis identifies significant heterogeneity among this group of LHDs. The BCHC LHDs perform more population-based services than other large LHDs and have extensive surveillance capacity. Epidemiology is a major point of difference between BCHC LHDs and other large LHDs; more staff are employed in both absolute and relative terms. After accounting for population size, BCHC LHDs have 4 times as many epidemiology FTEs, on average, compared with other large LHDs. The BCHC LHDs also perform more types of epidemiology and surveillance, on average, than do other large LHDs. This is critically important, as more and better data are critical to policy involvement and movement.8 However, these services and capacities are not uniformly robust across all BCHC LHDs, and further informatics capacity and development are needed.9
While there are differences in funding between BCHC LHDs and other large LHDs, these data also identify funding discrepancies among BCHC LHDs. Some BCHC LHDs are well resourced in absolute terms and on a per capita basis. Significant variation in local and state revenue has meant that per capita spending varies by an order of magnitude between the highest and lowest spending LHDs in the BCHC. This is due in part to the portfolio of services that a LHD provides, and that some BCHC jurisdictions do not provide extensive direct clinical services, focusing more on population-oriented services.10 However, much of the variation may also be due to inconsistent state allocation of federal pass-through funds. In fiscal year 2013, $430 million of $5.4 billion* in CDC grants to governmental public health agencies went directly to county or city governmental health departments.11 If LHDs do not receive funds directly from the federal government, they are dependent on state agencies for pass-through federal monies, which are not necessarily distributed in line with population size or need.5 This has profound implications for the health of the 46 million residents served by BCHC LHDs. Greater examination of policies related to direct funding of large, urban LHDs is needed to ensure that LHDs are resourced appropriately to face mounting challenges of chronic disease, made worse by disparities endemic to cities.12
Limitations
The NACCHO Profile is arguably the best nationwide source of data on the organizational capacities and characteristics of LHDs.13 However, the NACCHO Profile is not without its limitations. Despite a relatively robust response rate of 78%, nonresponse biases may be an issue. The profile is self-reported.
Conclusions
The nation's large health departments serve more than 50% of American citizenry, and the largest 1% of LHDs—those forming the BCHC—serve 15% of the population, approximately 46 million people. The 20 BCHC LHDs stand out from other large health departments in terms of the size of their workforce, total expenditures, policy involvement, and surveillance capacity. The characteristics of these large health departments give their leaders the potential of having notable influence in developing policies that advance the public health agenda in large urban areas and nationally.
This figure does not include grants to nongovernmental entities, hospitals, or educational institutions.
The authors declare no conflicts of interest.
REFERENCES
- 1.Mays G. Overview of the national longitudinal survey of public health systems. Lexington, KY: University of Kentucky, 2012. Available at: http://works.bepress.com/glen_mays/33. Accessed November 15, 2013. [Google Scholar]
- 2.Mays GP, Smith SA. Evidence links increases in public health spending to declines in preventable deaths. Health Aff. 2011;30(8):1585–1593. [DOI] [PMC free article] [PubMed] [Google Scholar]
- 3.Mays GP, Smith SA. Geographic variation in public health spending: correlates and consequences. Health Serv Res. 2009;44(5, pt 2):1796–1817. 10.1111/j.1475-6773.2009.01014.x. [DOI] [PMC free article] [PubMed] [Google Scholar]
- 4.Mays GP, Halverson PK, Baker EL, Stevens R, Vann JJ. Availability and perceived effectiveness of public health activities in the nation's most populous communities. Am J Public Health. 2004;94(6):1019–1026. 94/6/1019 [pii]. [DOI] [PMC free article] [PubMed] [Google Scholar]
- 5.Plough A. Understanding the financing and functions of metropolitan health departments: a key to improved public health response. J Public Health Manag Pract. 2004;10(5):421–427. [DOI] [PubMed] [Google Scholar]
- 6.National Association of County & City Health Officials. National Profile of Local Health Departments. Washington, DC: National Association of County & City Health Officials; 2014. [Google Scholar]
- 7.Dallas County Office of Budget and Evaluation. Dallas County FY2014 Baseline Budget (With 2013 Actuals). Dallas, TX: Dallas County Office of Budget and Evaluation; 2014:40. [Google Scholar]
- 8.Committee on Public Health Strategies to Improve Health, Institute of Medicine. For the Public's Health: The Role of Measurement in Action and Accountability. Washington, DC: The National Academies Press; 2010. [Google Scholar]
- 9.Castrucci B, Rhoades E, Leider JP, Hearne S. What gets measured gets done: an assessment of local data uses and needs in large urban health departments. J Public Health Manag Pract. 2015;21(1):S38–S48. [DOI] [PMC free article] [PubMed] [Google Scholar]
- 10.Committee on Public Health Strategies to Improve Health, Institute of Medicine. For the Public's Health: Investing in a Healthier Future. Washington, DC: The National Academies Press; 2012. [PubMed] [Google Scholar]
- 11.Centers for Disease Control and Prevention. State funding profiles. http://wwwn.cdc.gov/fundingprofiles/. Accessed June 11, 2014.
- 12.Rural Health Reform Policy Research Center. Bethesda, MD: The 2014 update of the rural-urban chartbook; Grand Forks, North Dakota, 2014. [Google Scholar]
- 13.Leep CJ, Shah GH. NACCHO's national profile of local health departments study: the premier source of data on local health departments for surveillance, research, and policymaking. J Public Health Manag Pract. 2012;18(2):186–189. 10.1097/PHH.0b013e31824445ae; 10.1097/PHH.0b013e31824445ae. [DOI] [PubMed] [Google Scholar]