

Abstract
To identify novel genetic risk factors for rheumatoid arthritis (RA), we conducted a genome-wide association study (GWAS) meta-analysis of 5,539 autoantibody positive RA cases and 20,169 controls of European descent, followed by replication in an independent set of 6,768 RA cases and 8,806 controls. Of 34 SNPs selected for replication, 7 novel RA risk alleles were identified at genome-wide significance (P<5×10⁻⁸) in analysis of all 41,282 samples. The associated SNPs are near genes of known immune function, including IL6ST, SPRED2, RBPJ, CCR6, IRF5, and PXK. We also refined the risk alleles at two established RA risk loci (IL2RA and CCL21) and confirmed the association at AFF3. These new associations bring the total number of confirmed RA risk loci to 31 among individuals of European ancestry. An additional 11 SNPs replicated at P<0.05, many of which are validated autoimmune risk alleles, suggesting that most represent bona fide RA risk alleles.
RA is a common autoimmune disease that affects up to 1% of the general adult population worldwide1. Approximately two-thirds of patients are seropositive for rheumatoid factor (RF) or anti-cyclic citrullinated peptide (anti-CCP) autoantibodies2. Genetic studies in autoantibody positive RA among subjects of European ancestry have identified multiple major histocompatibility complex (MHC) region alleles and 25 confirmed RA risk alleles in 23 non-MHC loci3–15. These alleles explain about 23% of the genetic burden of RA11, indicating that additional alleles remain to be discovered.
To identify novel RA risk alleles, we conducted a GWAS meta-analysis of 5,539 autoantibody positive RA cases and 20,169 controls of European ancestry (Table 1). This study expands upon our previous GWAS meta-analysis of 3,393 cases and 12,462 controls11 by (a) adding a new GWAS dataset of 483 RA cases recruited from the Boston area (Brigham Rheumatoid Arthritis Sequential Study, BRASS) and 1,449 shared controls, (b) adding 513 cases and 431 controls recruited from Sweden (Epidemiological Investigation of Rheumatoid Arthritis, EIRA), (c) incorporating a recently published GWAS of 2,418 cases and 4,504 controls recruited from North America (Canada and North American Rheumatoid Arthritis Consortium-III, NARAC-III)13, and (d) adding additional shared controls to the NARAC-III dataset. For each of six GWAS case-control collections, we removed SNPs and individuals that failed quality control, matched case-control samples using principal components analysis (PCA) to minimize bias due to stratification, and imputed16 genome-wide to infer genotypes at additional central European (CEU) HapMap SNPs. We used logistic regression to conduct a GWAS for 2.56 million SNPs in each collection, corrected for residual inflation using genomic control17, and combined results across collections by inverse variance-weighted meta-analysis (PGWAS)18. We found little evidence of systematic bias, as indicated by the genomic control inflation factor λGC (1.04)17, quantile-quantile (Q–Q) plots, results for markers highly differentiated across Europe19, and comparisons with an alternative analysis using PCA eigenvectors as covariates (Supplementary Figures 1–4; Supplementary Table 1). See Methods and Supplementary Note for full details of the analysis.
Table 1.
Patient collections.
| Case Collection | Control Collection | Geographical Origin | Case Antibody Status | Cases | Controls | Genotyping Platform | Case-Control Stratification Correction | |
|---|---|---|---|---|---|---|---|---|
| Brigham Rheumatoid Arthritis Sequential Study (BRASS) | Shared controls | Boston, USA | 100% CCP+ | 483 | 1449 | Affymetrix 6.0 | GWAS data PC matching | |
|
|
||||||||
| Meta-analysis | CANADA | CANADA and Shared controls | Toronto, Canada | 100% CCP+ | 589 | 1472 | Illumina 370K | GWAS data PC matching |
|
|
||||||||
| Epidemiological Investigation of Rheumatoid Arthritis (EIRA) | EIRA | Sweden | 100% CCP+ | 1173 | 1089 | Illumina 317K | Epidemiologically matched & GWAS data PC matching | |
|
|
||||||||
| 5,539 Cases; 20,169 Controls | North American Rheumatoid Arthritis Consortium (NARAC) I | Shared controls | North America | 100% CCP+ | 867 | 1041 | Illumina 550K | GWAS data PC matching |
|
|
||||||||
| NARAC III | Shared controls | North America | 100% CCP+ | 902 | 4510 | Illumina 317K | GWAS data PC matching | |
|
|
||||||||
| Wellcome Trust Case Control Consortium (WTCCC) | Shared controls from WTCCC | United Kingdom | 100% RF+ or CCP+ | 1525 | 10608 | Affymetrix 500K | Geographically matched | |
|
| ||||||||
| CANADA II | CANADA II | Toronto & Halifax, Canada | 100% CCP+ | 1076 | 1269 | Sequenom iPlex | Geographically matched | |
|
|
||||||||
| Replication | Dutch | Dutch | The Netherlands | 100% RF+ | 718 | 697 | Sequenom iPlex | Geographically matched |
|
|
||||||||
| Genetics Network Rheumatology Amsterdam (GENRA) | GENRA | Amsterdam, The Netherlands | 100% CCP+ | 519 | 1155 | Sequenom iPlex | Geographically matched | |
|
|
||||||||
| 6,768 Cases; 8,806 Controls | Genomics Collaborative Initiative (GCI) | GCI | North America | 100% RF+ | 461 | 460 | Kinetic PCR | Epidemiologically matched |
|
|
||||||||
| Leiden University Medical Center (LUMC) | LUMC | Leiden, The Netherlands | 100% RF+ or CCP+ | 310 | 544 | Kinetic PCR | Geographically matched | |
|
|
||||||||
| NARAC II | Shared controls | North America | 100% CCP+ | 462 | 693 | Sequenom iPlex | Ancestry informative marker data matching | |
|
|
||||||||
| United Kingdom Rheumatoid Arthritis Genetics (UKRAG) | UKRAG | United Kingdom | 100% RF+ or CCP+ | 2906 | 3494 | Sequenom iPlex | Geographically matched | |
|
|
||||||||
| Nurses Health Study (NHS) | NHS | North America | 100% RF+ or CCP+ | 316 | 494 | Biotrove OpenArray | Epidemiologically matched | |
Meta-analysis of GWAS results for six collections (top panel) was used to identify SNPs for replication in eight collections (bottom panel). For each collection, we list the source of controls, geographic origin, autoantibody status of cases, numbers of cases and controls, genotyping platform (GWAS collection microarray platform, and replication and validation/prediction collection direct-genotyping technology), and the strategy used to correct for casecontrol population stratification. See Methods and Supplementary Note for details.
Our GWAS meta-analysis found support for RA risk loci previously confirmed among individuals of European ancestry, consistent with power for our study design (Table 2, Supplementary Figure 5). Four of the 25 confirmed non-MHC risk alleles obtained PGWAS<5×10⁻⁸ (PTPN22, CTLA4, TNFAIP3, and CD40 loci); the remaining 21 confirmed alleles obtained PGWAS≤0.002. We found modest evidence for association at PADI4 (rs2240340, PGWAS=0.01, odds ratio (OR)=1.06) and FCRL3 (rs3761959, PGWAS=0.001, OR=1.08), but not CD244 (rs3753389, PGWAS=0.26, OR=1.03), loci implicated in RA patients of Asian ancestry3,20,21 (Supplementary Table 1 online).
Table 2.
Previously known RA risk associated SNPs in Europeans.
| SNP | GWAS Meta-Analysis | Power | ||||||
|---|---|---|---|---|---|---|---|---|
| Locus | ID | Gene(s) | Minor allele | MAF | OR (95% CI) | PGWAS | α = 10−6 | α = 5×10⁻⁸ |
| 1p36 | rs3890745* | TNFRSF14 | C | 0.32 | 0.89 (0.85,0.94) | 3.6×10⁻⁶ | 0.45 | 0.24 |
|
| ||||||||
| 1p13 | rs2476601 | PTPN22 | A | 0.10 | 1.94 (1.81,2.08) | 9.1×10−74 | 1 | 1 |
|
| ||||||||
| 1p13 | rs11586238 | CD2,CD58 | G | 0.24 | 1.13 (1.07,1.19) | 1.0×10⁻⁵ | 0.46 | 0.26 |
|
| ||||||||
| 1q23 | rs12746613* | FCGR2A | T | 0.12 | 1.13 (1.06,1.21) | 0.0004 | 0.11 | 0.04 |
|
| ||||||||
| 1q31 | rs10919563* | PTPRC | A | 0.13 | 0.88 (0.82,0.94) | 0.0002 | 0.10 | 0.03 |
|
| ||||||||
| 2p16 | rs13031237 | REL | T | 0.37 | 1.13 (1.07,1.18) | 7.9×10⁻⁷ | 0.67 | 0.45 |
|
| ||||||||
| 2q11 | rs10865035* | AFF3 | A | 0.47 | 1.12 (1.07,1.17) | 2.0×10⁻⁶ | 0.55 | 0.33 |
|
| ||||||||
| 2q32 | rs7574865 | STAT4 | T | 0.22 | 1.16 (1.10,1.23) | 2.9×10⁻⁷ | 0.77 | 0.58 |
|
| ||||||||
| 2q33 | rs1980422 | CD28 | C | 0.24 | 1.12 (1.06,1.18) | 5.2×10⁻⁵ | 0.32 | 0.15 |
|
| ||||||||
| 2q33 | rs3087243 | CTLA4 | A | 0.44 | 0.87 (0.83,0.91) | 1.2×10⁻⁸ | 0.89 | 0.74 |
|
| ||||||||
| 4q27 | rs6822844 | IL2,IL21 | T | 0.18 | 0.90 (0.84,0.95) | 0.0007 | 0.08 | 0.02 |
|
| ||||||||
| 6p21 | rs6910071 | HLA-DRB1 (*0401 tag) | G | 0.22 | 2.88 (2.73,3.03) | <10−299 | 1 | 1 |
|
| ||||||||
| 6q21 | rs548234 | PRDM1 | C | 0.33 | 1.10 (1.05,1.16) | 9.7×10⁻⁵ | 0.21 | 0.08 |
|
| ||||||||
| 6q23 | rs10499194 | TNFAIP3 | T | 0.27 | 0.91 (0.87,0.96) | 0.0007 | 0.11 | 0.03 |
|
| ||||||||
| 6q23 | rs6920220 | TNFAIP3 | A | 0.22 | 1.22 (1.16,1.29) | 8.9×10⁻¹³ | 1 | 0.99 |
|
| ||||||||
| 6q23 | rs5029937 | TNFAIP3 | T | 0.04 | 1.40 (1.24,1.58) | 7.5×10⁻⁸ | 0.95 | 0.86 |
|
| ||||||||
| 6q25 | rs394581* | TAGAP | C | 0.30 | 0.91 (0.87,0.96) | 0.0006 | 0.13 | 0.05 |
|
| ||||||||
| 8p23 | rs2736340 | BLK | T | 0.25 | 1.12 (1.07,1.18) | 1.5×10⁻⁵ | 0.34 | 0.17 |
|
| ||||||||
| 9p13 | rs2812378* | CCL21 | G | 0.34 | 1.10 (1.05,1.16) | 0.0001 | 0.21 | 0.09 |
|
| ||||||||
| 9q33 | rs3761847 | TRAF1,C5 | G | 0.43 | 1.13 (1.08,1.18) | 2.1×10⁻⁷ | 0.70 | 0.49 |
|
| ||||||||
| 10p15 | rs2104286 | IL2RA | C | 0.27 | 0.92 (0.87,0.97) | 0.002 | 0.05 | 0.02 |
|
| ||||||||
| 10p15 | rs4750316 | PRKCQ | C | 0.19 | 0.87 (0.82,0.92) | 2.0×10⁻⁶ | 0.41 | 0.21 |
|
| ||||||||
| 11p12 | rs540386* | TRAF6 | T | 0.14 | 0.88 (0.83,0.94) | 0.0003 | 0.13 | 0.05 |
|
| ||||||||
| 12q13 | rs1678542* | KIF5A,PIP4K2C | G | 0.38 | 0.91 (0.87,0.96) | 0.0002 | 0.20 | 0.08 |
|
| ||||||||
| 20q13 | rs4810485 | CD40 | T | 0.25 | 0.85 (0.80,0.90) | 2.8×10⁻⁹ | 0.88 | 0.73 |
|
| ||||||||
| 22q12 | rs3218253* | IL2RB | A | 0.26 | 1.09 (1.03,1.15) | 0.002 | 0.07 | 0.02 |
GWAS meta-analysis results for previously known SNPs associated with RA risk among European populations. Listed are the chromosome, SNP ID, and candidate gene(s) in the region. The minor allele and frequency (positive strand in HapMap release 22, frequency in controls subjects), odds ratio (95% confidence interval), and association P-value are derived from our GWAS meta-analysis. Most SNPs have achieved P<5×10⁻⁸ in combined analysis from previous studies; those with an asterisk (*) have been validated by replication in independent samples, but may not have attained P<5×10⁻⁸ in any single study. SNPs with strong evidence of association in Asians (including PADI4, rs2240340, PGWAS = 0.01; FCRL3, rs3761959, PGWAS = 0.001; and CD244, rs3753389, PGWAS = 0.26) or suggestive evidence of association in Europeans are shown in Supplementary Table 1 online. Power was calculated based on the odds ratios from our meta-analysis at α = 10−6 (a threshold for selecting SNPs for replication in the current study) and 5×10⁻⁸ (genome-wide signicance). Details of the power calculations can be found in the Supplementary Materials online.
We used three criteria to select 34 independent SNPs for replication after removing confirmed RA risk alleles. First, we selected all 11 SNPs with PGWAS<10−6. Second, we selected 9 SNPs (of 116 tested) with PGWAS<0.0001 and identified as functionally related to known RA risk loci by GRAIL22, a bioinformatic analysis that identifies connections among genes in published abstracts (Supplementary Figure 6 online). Third, we selected 14 SNPs (of 104 tested) with PGWAS<0.01 and previously known to be associated with other autoimmune diseases23–31, as we found evidence for enrichment of autoimmune SNPs in our RA GWAS (Supplementary Figure 7 online). See Supplementary Note online for additional details about our selection of SNPs for replication.
These 34 SNPs were genotyped in an independent set of 6,768 autoantibody positive RA cases and 8,806 matched controls of European ancestry (Table 1). As in our GWAS, all cases were seropositive for disease-specific autoantibodies (anti-CCP or RF). For each SNP, we tested for replication of the GWAS meta-analysis association by calculating a one-tailed P-value (Preplication) for the same allele conferring risk in both analyses. Additionally, we conducted overall association tests across all 41,282 samples (GWAS meta-analysis plus replication, Poverall), and considered Poverall<5×10⁻⁸ to be a reproducible level of significance for RA risk association.
Of the 34 SNPs tested, 12 obtained a Bonferroni-corrected Preplication<0.0015 (=0.05/34), and an additional 9 obtained Preplication<0.05. Ten of these achieved genome-wide significance in the combined analysis, Poverall<5×10⁻⁸, indicating that these are validated RA risk alleles (Table 3). The other 11 SNPs had Preplication<0.05, but Poverall>5×10⁻⁸, indicating highly suggestive but not genome-wide significant association (Table 4). Results for all 34 SNPs in replication and combined analyses are shown in Supplementary Table 2 online.
Table 3.
Newly validated RA risk alleles.
| SNP | GWAS Meta-Analysis | Replication | Combined | ||||||||||||
|---|---|---|---|---|---|---|---|---|---|---|---|---|---|---|---|
| ID | Chr | Position | Gene(s) | Allele | PGWAS | OR | MAF | Preplication | OR (95% CI) | MAF | Poverall | Cochran Q | |||
| Major | Minor | Case | Control | Case | Control | P | |||||||||
| Novel RA and novel autoimmune risk loci | |||||||||||||||
|
| |||||||||||||||
| rs934734 | 2p14 | 65,507,237 | SPRED2 | A | G | 3.2E-07 | 1.13 | 0.52 | 0.49 | 0.0002 | 1.13 (1.06,1.21) | 0.53 | 0.51 | 5.3E-10 | 0.95 |
|
| |||||||||||||||
| rs6859219 | 5q11 | 55,474,337 | ANKRD55, IL6ST | C | A | 2.5E-09 | 0.78 | 0.18 | 0.21 | 0.0002 | 0.85 (0.78,0.93) | 0.19 | 0.22 | 9.6E-12 | 0.19 |
|
| |||||||||||||||
| rs26232 | 5q21 | 102,624,619 | C5orf13 | C | T | 4.3E-07 | 0.88 | 0.29 | 0.32 | 0.004 | 0.93 (0.88,0.98) | 0.30 | 0.32 | 4.1E-08 | 0.82 |
|
| |||||||||||||||
| Novel RA, previously implicated autoimmune risk loci† | |||||||||||||||
|
| |||||||||||||||
| rs13315591 | 3p14 | 58,531,881 | PXK | T | C | 3.7E-07 | 1.29 | 0.10 | 0.09 | 0.002 | 1.13 (1.04,1.23) | 0.09 | 0.08 | 4.6E-08 | 0.12 |
|
| |||||||||||||||
| rs874040 | 4p15 | 25,784,466 | RBPJ | G | C | 1.9E-07 | 1.14 | 0.33 | 0.30 | 3.0E-11 | 1.18 (1.12,1.24) | 0.34 | 0.30 | 1.0E-16 | 0.57 |
|
| |||||||||||||||
| rs3093023 | 6q27 | 167,504,701 | CCR6 | G | A | 3.3E-07 | 1.13 | 0.47 | 0.43 | 4.5E-06 | 1.11 (1.06,1.16) | 0.46 | 0.43 | 1.5E-11 | 0.42 |
|
| |||||||||||||||
| rs10488631 | 7q32 | 128,188,134 | IRF5 | T | C | 2.8E-06 | 1.19 | 0.13 | 0.11 | 1.2E-06 | 1.25 (1.14,1.37) | 0.13 | 0.10 | 4.2E-11 | 0.60 |
|
| |||||||||||||||
| Associations at known RA risk loci‡ | |||||||||||||||
|
| |||||||||||||||
| rs11676922 | 2q11 | 100,265,458 | AFF3 | A | T | 6.9E-07 | 1.12 | 0.49 | 0.46 | 1.1E-09 | 1.15 (1.10,1.20) | 0.48 | 0.45 | 1.0E-14 | 0.50 |
|
| |||||||||||||||
| rs951005 | 9p13 | 34,733,681 | CCL21 | A | G | 5.4E-07 | 0.84 | 0.14 | 0.16 | 6.7E-05 | 0.87 (0.81,0.93) | 0.13 | 0.15 | 3.9E-10 | 0.61 |
|
| |||||||||||||||
| rs706778 | 10p15 | 6,138,955 | IL2RA | C | T | 7.9E-08 | 1.14 | 0.44 | 0.40 | 1.5E-05 | 1.11 (1.06,1.17) | 0.43 | 0.40 | 1.4E-11 | 0.36 |
GWAS, replication and combined meta-analysis results for SNPs that achieve genome-wide significance for association with RA risk. Listed are the rs ID for each SNP, the chromosomal/cytological band, position in human genome build 36, candidate genes in the region (selected by GRAIL analysis, or manually based on immunological function; see text and Supplementary Note), and major and minor alleles (positive strand in HapMap release 22, major/minor based on frequency in GWAS controls). The association P-value, odds ratio (OR) with respect to minor allele (95% confidence interval for replication analysis) and minor allele frequencies (MAF) in cases and controls are listed for our GWAS and replication analyses. For the combined analysis, the overall association P-value and the P-value for Cochran’s Q test for heterogeneity are listed.
: Implicated in other autoimmune diseases: PXK is associated with SLE (rs6445975, r2 = 0.15 with rs13315591); RBPJ is associated with T1D (rs10517086, r2 = 1 with rs874040); CCR6 is associated with Crohn’s (rs2301436, r2 = 0.48 with rs3093023); and IRF5 SNP rs10488631 is associated with SLE.
: Previously implicated in rheumatoid arthritis: AFF3 SNP rs11676922 has recently been reported (Barton et al 2009); CCL21 SNP rs2812378 (r2 = 0.06 with rs951005); and IL2RA SNP rs2104286 (r2 = 0.25 with rs706778).
Table 4.
Suggestive RA risk alleles.
| SNP | GWAS Meta-Analysis | Replication | Combined | ||||||||||||
|---|---|---|---|---|---|---|---|---|---|---|---|---|---|---|---|
| ID | Chr | Pos (HG18) | Gene(s)a | Allele | PGWAS | OR | MAF | Prep. | OR (95% CI) | MAF | Poverall | Cochran Q | |||
| Major | Minor | Case | Control | Case | Control | P | |||||||||
| rs7543174a | 1q21 | 151,340,745 | IL6R | T | C | 7.9E-05 | 1.13 | 0.18 | 0.16 | 0.01 | 1.07 (1.01,1.13) | 0.19 | 0.18 | 1.2E-05 | 0.06 |
|
| |||||||||||||||
| rs840016a | 1q24 | 164,140,328 | CD247 | C | T | 3.6E-05 | 0.90 | 0.39 | 0.42 | 0.006 | 0.92 (0.86,0.98) | 0.38 | 0.40 | 1.6E-06 | 0.62 |
|
| |||||||||||||||
| rs13119723b | 4q27 | 123,575,918 | IL2, IL21† | A | G | 0.001 | 0.89 | 0.13 | 0.15 | 6.7E-05 | 0.87 (0.81,0.93) | 0.15 | 0.17 | 6.8E-07 | 0.46 |
|
| |||||||||||||||
| rs11594656b | 10p15 | 6,162,015 | IL2RA† | T | A | 0.0002 | 0.90 | 0.23 | 0.25 | 0.04 | 0.95 (0.90,1.00) | 0.24 | 0.25 | 0.0001 | 0.86 |
|
| |||||||||||||||
| rs2793108b | 10p11 | 31,419,111 | ZEB1 | T | C | 0.002 | 0.93 | 0.40 | 0.43 | 0.001 | 0.93 (0.89,0.98) | 0.41 | 0.43 | 1.4E-05 | 0.73 |
|
| |||||||||||||||
| rs3184504b | 12q24 | 110,347,328 | SH2B3 | T | C | 0.004 | 0.93 | 0.49 | 0.49 | 0.0002 | 0.92 (0.88,0.96) | 0.48 | 0.49 | 6.0E-06 | 0.08 |
|
| |||||||||||||||
| rs7155603a | 14q24 | 75,030,289 | BATF† | A | G | 1.0E-05 | 1.16 | 0.21 | 0.19 | 0.001 | 1.12 (1.04,1.20) | 0.23 | 0.21 | 1.1E-07 | 0.74 |
|
| |||||||||||||||
| rs8045689a | 16p11 | 28,895,770 | CD19, NFATC2IP† | T | C | 5.3E-05 | 1.14 | 0.32 | 0.30 | 0.01 | 1.06 (1.01,1.12) | 0.32 | 0.30 | 2.4E-05 | 0.35 |
|
| |||||||||||||||
| rs2872507b | 17q12 | 35,294,289 | IKZF3† | G | A | 4.7E-05 | 1.10 | 0.49 | 0.47 | 0.002 | 1.08 (1.02,1.14) | 0.48 | 0.46 | 9.4E-07 | 0.69 |
|
| |||||||||||||||
| rs11203203b | 21q22 | 42,709,255 | UBASH3A† | G | A | 2.5E-05 | 1.11 | 0.39 | 0.37 | 0.02 | 1.07 (1.00,1.14) | 0.38 | 0.37 | 3.8E-06 | 0.49 |
|
| |||||||||||||||
| rs5754217b | 22q11 | 20,264,229 | UBE2L3 | G | T | 0.0007 | 1.10 | 0.22 | 0.19 | 0.01 | 1.07 (1.01,1.13) | 0.22 | 0.21 | 4.8E-05 | 0.79 |
GWAS, replication and combined meta-analysis results for SNPs with highly suggestive associations with RA risk (defined as P<0.05 in our replication samples). As in Table 2, listed for each SNP are the rs ID, chromosomal location and position, candidate gene(s), and major and minor alleles, GWAS and replication analysis P-value, odds ratio and case/control minor allele frequencies, and the combined analysis P-values for association and for Cochran’s Q test for heterogeneity.
: Selected for replication based on GRAIL Ptext score
: Selected for replication based on PGWAS < 0.01 and validated autoimmune disease association: rs13119723, IL2/IL21, RA and Celiac; rs11594656, IL2RA, T1D and MS; rs2793108, ZEB1, T1D; rs3184504, SH2B3, Celiac and T1D; rs2872507, IKZF3, Crohn’s; rs11203203, UBASH3A, T1D; rs5754217, UBE2L3, SLE; the ZEB1 SNP was from the May 2009 release of the online T1D database (www.T1Dbase.org).
Autoimmune disease associations for SNPs other than those tested for replication in the present study (see text, Fig. 2 and Supplementary Note): CD247, Crohn’s; IL2/IL21, Celiac, RA and T1D; IL2RA, MS, RA and T1D; BATF, T1D; CD19/NFATC2IP, T1D; IKZF3, T1D; UBASH3A, Crohn’s and T1.
Three of the 10 newly validated RA risk loci have not been implicated in any genetic studies of RA or other autoimmune disease. The SNPs are located at chromosome 2p14 (rs934734, Poverall=5.3×10⁻¹⁰), 5q11 (rs6859219, Poverall=9.6×10⁻¹²) and 5q21 (rs26232, Poverall=4.1×10⁻⁸). Replication sample odds ratios (for minor alleles) were 1.13, 0.85 and 0.93, respectively (Table 3).
Although no single gene can be declared causal, we labeled RA risk loci with the names of the most compelling candidate gene(s) from each region of linkage disequilibrium (LD) based upon GRAIL analysis and/or knowledge of RA pathogenesis2,22. At 2p14, the most significant SNP (rs934734) is located within intron 1 of the sprouty-related, EVH1 domain containing 2 (SPRED2) gene (Figure 1A), which has been shown to regulate CD45+ hematopoietic cells via the Ras/MAP kinase pathway32. At 5q11, the most significant SNP (rs6859219) is located in ANKRD55, an ankyrin repeat domain-containing gene of unknown function (Figure 1B). A more compelling immunological candidate, interleukin 6 signal transducer (IL6ST), lies ~150 kilobases (kb) proximal but outside the region of LD with associated SNPs. The IL6ST protein product, gp130, functions as a part of the receptor complex for the inflammatory cytokine IL633. At 5q21, there is no obvious biological candidate gene; SNP rs26232 lies within the intron of predicted gene C5orf30 (Figure 1C).
Figure 1. Association with RA risk across 4 loci.
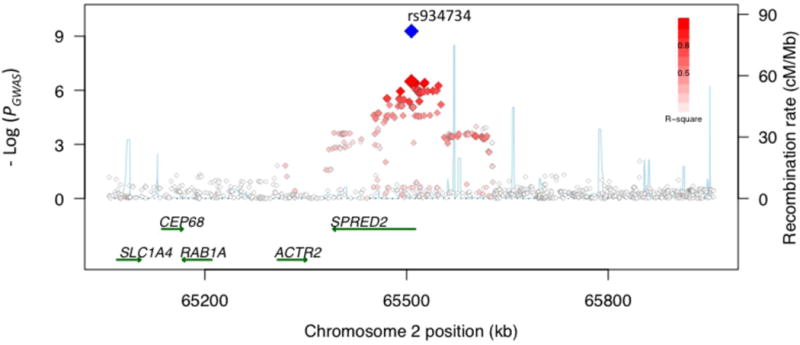


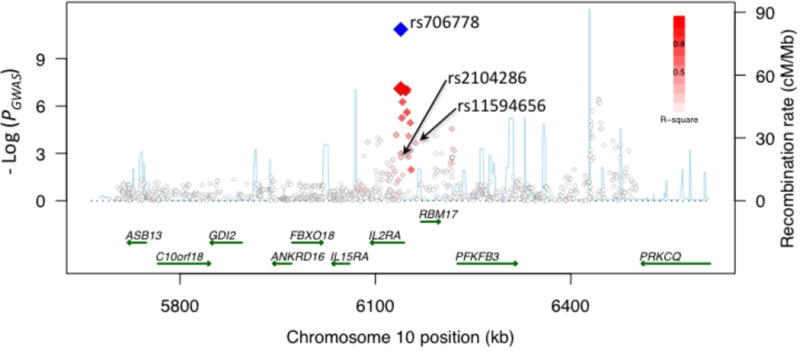
Regional association plots show strength of association (-Log(P-value)) versus chromosomal position (kilobases, kb) for all SNPs across 1 Megabase (Mb) regions centered on the newly validated SNPs (labeled). PGWAS values are plotted with red/white diamonds for all SNPs, shaded by the degree of LD (r2, see legend) with the validated SNP (larger red diamond). Poverall in combined analysis of GWAS and replication collections is plotted with the blue diamond. Local recombination rates estimated from HapMap CEU (centi-Morgans per Mb, blue line) are plotted against the secondary y-axis, showing recombination hotspots across the region. Labeled green arrows below the plots indicate genes and their orientations. (a) 2p14, SPRED2 locus. (b) 5q11, IL6ST-ANKRD55 locus. (c) 5q21, C5orf13 locus. (d) 10p15, IL2RA locus.
Our study provides the first convincing evidence that 4 loci implicated in other autoimmune diseases are also associated with risk of RA. Of these, three of the 4 SNPs were selected for replication based on obtaining PGWAS<10−6, regardless of their previously reported associations with autoimmune disease. These 3 SNPs are located at chromosome 3p14 (rs13315591, near PXK, Poverall=4.6×10⁻⁸), 4p15 (rs874040, near RBPJ, Poverall=1.0×10⁻¹⁶) and 6q27 (rs3093023, in CCR6, Poverall=1.5×10⁻¹¹). The 3p14 SNP lies 187 kb proximal to a SNP associated with systemic lupus erythematosus (SLE)25; the SLE SNP, intronic in the PXK gene, is only weakly associated with RA risk in our study (rs6445975, PGWAS = 0.03, r2 = 0.15 and D’ = 0.75 with rs13315591). The 4p15/RBPJ SNP is in complete LD (r2 = 1) with a SNP associated with risk of type 1 diabetes (T1D, rs10517086)23, and the same allele confers risk in both diseases. The 6q27/CCR6 SNP rs3093023 is in LD with a SNP associated with Crohn’s disease24, which is only weakly associated with RA risk in our study (Crohn’s SNP rs2301436, PGWAS = 0.045, r2 = 0.48 and D’ = 0.80).
The IRF5 SNP rs10488631 (PGWAS =2.8×10⁻⁶), chosen because of its association in SLE34,35, was convincingly associated with autoantibody positive RA in our study (Preplication=1.2×10⁻⁶, Poverall=4.2×10⁻¹¹). Graham et al.36 proposed that the complex SLE risk associations in IRF5 are explained by three independent groups of SNPs, each consisting of SNPs in tight LD with each other. In our dataset, these groups are represented by rs10488631 (group 1), rs729302 (group 2) and rs4728142 (group 3). In addition to the group 1 SNP, rs10488631, we found evidence for association with group 3 SNP rs4728142 (PGWAS=7.2×10⁻⁶), which is in LD with a variant that alters IRF5 polyadenylation and expression36. However, we found no evidence for association for group 2 (rs729302, PGWAS=0.15). Conditional analyses indicated that the group 1 and group 3 effects are independent (Supplementary Table 3 online). We note that group 3 SNP rs3807306 has been suggested to be associated with autoantibody negative RA37, and our results suggest that this SNP is associated with autoantibody positive RA (PGWAS=4.5×10⁻⁶).
Our GWAS meta-analysis identified new alleles exhibiting independent effects from previously implicated RA risk alleles at two other loci, CCL2111 (rs951005, Poverall=3.9×10⁻¹⁰) and IL2RA15 (rs706778, Poverall=3.3×10⁻¹¹). Our new CCL21 SNP has little LD with the previous RA risk-associated SNP rs281237811 (PGWAS=1.6×10⁻⁷; r2=0.06 and D’=0.83). Conditional analyses indicated that the associations are partly independent (Supplementary Table 3 online); the new SNP rs951005 remains significant (P = 1.7×10⁻⁵) conditional on the previously known SNP rs2812378; conditional on rs951005, rs2812378 remains nominally significant (P = 0.01).
SNPs at IL2RA are known to be associated with multiple autoimmune diseases including RA15, T1D23 and multiple sclerosis (MS)38,39. The IL2RA SNP identified in our GWAS (rs706778, Poverall=3.3×10⁻¹¹) is in partial LD with a SNP previously implicated in RA, T1D and MS (rs2104286, r2=0.25 and D’=1)15 and another SNP implicated in T1D and MS (rs11594656; r2=0.24 and D’=1)23. In fact, T1D risk is conferred by a haplotype tagged by rs2104286(T)-rs11594656(T)38. In our GWAS dataset, rs706778 correlated strongly with the T1D risk haplotype (r2=0.83), and conditional and haplotype analyses demonstrated that risk of RA is better explained by this haplotype [rs2104286(T)-rs11594656(T)] than by rs706778 (Supplementary Tables 3 and 4 online).
A SNP at the AFF3 locus has been previously implicated in RA14, with equivocal evidence for association with T1D23,40. Our study provides definitive evidence that this locus is associated with risk of autoantibody positive RA (rs11676922, Poverall=1.0×10⁻¹⁴, OR=1.14).
Eighteen of the 34 SNPs that we tested in replication (based on the criteria above) are in LD with validated autoimmune risk alleles (Figure 2). Of these, 5 demonstrated genome-wide (Poverall<5×10⁻⁸) and 7 showed suggestive (Preplication<0.05) evidence of association in our study; only 6 showed no evidence of association in replication. While not meant as a complete comparison of all known RA and other autoimmune disease risk alleles, these results underscore the emerging overlap in genetic bases of RA and other autoimmune diseases41,42. Although additional replication in large sample collections is required to confirm the suggestive associations, many likely represent true RA risk alleles.
Figure 2. Previously validated autoimmune SNPs tested in our replication study.
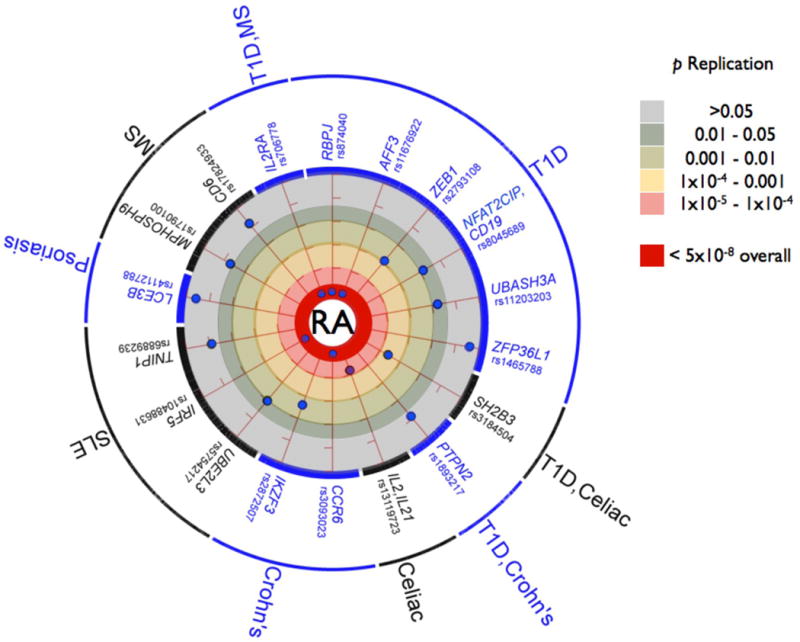
Eighteen SNPs tested in our replication samples were in LD (defined as r2 > 0.3) with a validated autoimmune risk allele. Of these, 5 were validated as RA risk alleles in our study (Poverall < 5×10⁻⁸, inner most circle), 6 were suggestive associations (Preplication <0.05 but Poverall > 5×10⁻⁸), and 6 demonstrated no evidence of association in our replication samples (Preplication ≥0.05). For the 12 SNPs with suggestive or no evidence of association, each SNP is plotted by the strength of association with RA risk in the replication samples; those closer to the inner circle have more significant Preplication. All of the RA risk alleles confer risk in the same direction as the validated autoimmune risk alleles (when the same allele or a near perfect proxy was tested). We include the following as “autoimmune” diseases in our study, listed on the outside of the circle, although these reflect diseases along the autoimmuneinflammatory spectrum: systemic lupus erythematosus (SLE), celiac disease, Crohn’s disease, multiple sclerosis (MS), psoriasis, and type 1 diabetes (T1D); other autoimmune diseases are not included (e.g., autoimmune thyroiditis). The haplotype tagged by the IL2RA SNP, rs706778, is associated with T1D and MS38,39; the SH2B3 SNP is associated with both T1D and Celiac disease23,30. The CCR6 SNP rs3093023 is in partial LD with a SNP associated with Crohn’s disease (rs2301436, r2 = 0.48)24. The AFF3 SNP has an equivocal association with T1D (where the associated SNP is rs965344240). The IL2-IL21 SNP tested in our study, rs13119723, is in LD (r2=0.67) with a SNP previously implicated in both Celiac disease and RA (rs6822844)10,29, but only in partial LD (r2=0.09) with a T1D SNP (rs4505848)23. The CD19-NFATC2IP SNP tested in our study, rs8045689, was selected because of GRAIL; it is in partial LD (r2=0.38) with a SNP associated with T1D (rs4788084)23. The TNIP1 SNP in our study, rs6889239, is in strong LD with an SLE SNP (rs7708392, r2=0.91)49, but not in LD with another TNIP1 SNP associated with psoriasis (rs17728338, r2<0.01)26. The ZEB1 SNP (rs2793108) was from the May 2009 release of T1D base, although this SNP did not appear in a subsequent publication23. The PXK SLE SNP was tested in this study but not shown, as it is in weak LD with the RA risk SNP (r2 = 0.15 between rs6445975 and rs13315591); the RA SNP was selected because of PGWAS<10−6, not because of its association with another autoimmune disease. Note that there are SNPs associated with RA and other autoimmune diseases not shown; we only include those SNPs tested as part of the current study.
Several of the SNP associations further implicate T-cells in RA pathogenesis. RBPJ (recombination site binding protein J; also known as CSL) is a transcription factor within the Notch signaling pathway. RBPJ-deficient mice have no T-cell development, while early B-cell development is maintained43. CCR6 is a cell surface protein that distinguishes Th17 cells from other CD4+ helper T-cells44. Synoviocytes from arthritic joints of mice and RA patients produce CCL20, a CCR6 ligand. Intriguingly, anti-CCR6 monoclonal antibodies substantially inhibit mouse arthritis, suggesting that CCR6 could be a therapeutic target in RA44. CD247 (Preplication=0.006, Poverall=1.6×10⁻⁶; Table 3) encodes the T-cell receptor zeta chain, a subunit of the T-cell receptor-CD3 complex that when mutated causes an inflammatory arthritis in mouse45,46. The zeta chain plays an important role in coupling antigen recognition to several intracellular signal-transduction pathways. These results build upon knowledge of T-cell activation-differentiation in RA pathogenesis evidenced by genetic associations at HLA-DRB1 (presents antigens to T-cells), PTPN22 (alters T-cell thresholds), CTLA4 (co-stimulator for T-cell activation), IL2RA/CD25 (mediates IL2-dependent T-cell responses), and STAT4 (transcription factor in Th1 cell differentiation), among others.
In conclusion, we find convincing evidence for association with risk of autoantibody positive RA at 10 loci, seven of which represent novel risk loci for RA. We estimate that the now >30 validated non-MHC RA risk alleles explain 3.9% of the total disease variance, with 0.67% due to the new RA risk alleles reported here. It is clear that additional risk alleles remain to be identified, as genetic discoveries explain only 16% of disease variance (including an estimated 12% for the MHC47), whereas more than half the risk of autoantibody positive RA is thought to be genetic47,48. The number of SNPs with suggestive evidence of association in our study (Table 4) further indicates that many more common risk alleles with modest effect sizes remain to be discovered. In addition to common variants, the roles of rare variants, copy number variants and epigenetic modifications will need to be explored with newer genomic technologies.
METHODS
Sample collections
Case-control collections are listed in Table 1 and described in detail in our previous studies6,7,11,13,19. Collections were composed entirely of individuals of selfdescribed European ancestry, and all cases either met the 1987 American College of Rheumatology (ACR) criteria for diagnosis of RA50 or were diagnosed by board-certified rheumatologists. All RA cases were further limited to anti-CCP+ patients, or RF+ patients if anti-CCP status data were missing. The BRASS RA samples have been used in our previous 100K GWAS6, but here are presented for the first time genotyped with the Affymetrix 6.0 array. In the current study, controls were matched to BRASS RA cases using principal components analysis from GWAS data from three separate studies: controls from a multiple sclerosis GWAS31, controls from an age-related macular degeneration GWAS51, and controls from a myocardial infarction GWAS52. WTCCC collection controls included the 1958 birth and National Blood Service cohorts as well as non-autoimmune disease cases (bipolar disorder, cardiovascular disease, hypertension and type 2 diabetes)15. All GWAS collections except WTCCC were restricted to control subjects matching cases using principal components analysis of GWAS data. All replication sample collections were composed of epidemiologically and/or geographically matched cases and controls, except NARAC II collection, which was case-control matched based on genotypes at a set of ancestry-informative markers as previously described11. The eight replication samples included: (1) CCP positive cases and controls from Halifax and Toronto (CANADA-II)13; (2) RF positive Dutch cases from Groningen and Nijmegen, together with geographically matched controls53; (3) CCP positive Dutch cases and controls collected from the greater Amsterdam region (GENRA)54; (4) North American RF positive cases and controls matched on gender, age, and grandparental country of origin from the Genomics Collaborative Initiative (GCI)4; (5) CCP or RF positive Dutch cases and controls from Leiden University Medical Center (LUMC)5; (6) CCP positive cases drawn from North American clinics and controls from the New York Cancer Project (together this collection is called NARAC-II)7; (7) CCP or RF positive cases recruited at multiple sites in the United Kingdom by the United Kingdom Rheumatoid Arthritis Genetics (UKRAG) collaboration9; and (8) CCP or RF positive cases identified by chart review from the Nurses Health Study (NHS) and matched controls based on age, gender, menopausal status, and hormone use55. We used available SNP data from this and previous studies to identify genetically identical samples from the same country13; we assumed these represented duplicated individuals and removed them. Institutional review boards at each collection site approved the study, and all individuals gave their informed consent.
Genotyping
The BRASS GWAS collection was genotyped on the Affymetrix Genechip 6.0 platform at the Broad Institute (Boston, USA). All other GWAS collections were genotyped as previously described7,13,19. Genotype data for GWAS samples from RA and other disease studies were obtained with permission from the investigators and/or disease consortia. Additional shared control GWAS genotype data were obtained from the NIMH (USA) through a formal application and approval process (part of the BRASS collection), and from the Illumina iControls database (NARAC III). For each GWAS collection, quality control (QC) was implemented in cases and in each control cohort separately, and then again in the merged collection data. QC steps included filtering SNPs and individuals with >5% missing data, followed by filtering SNPs with minor allele frequency (MAF) <1% and a Chi-squared test of Hardy Weinberg equilibrium PHWE<10−6. For the WTCCC collection, genotyped on the older Affymetrix 500K platform, we implemented more stringent QC (>1% missing data, MAF<1%, PHWE<10−5). We then used individual-pairwise identity-by-state estimates to remove occasional related and potentially contaminated samples. Data processing and QC were performed in PLINK56. Additional details are described in the Supplementary Note online.
The 34 SNPs chosen for replication, as well as proxy SNPs, were directly genotyped in each of eight collections (Table 1 and Supplementary Note online). Canada samples were genotyped on the Sequenom iPlex platform at University of Toronto, Mount Sinai Hospital and University Health Network (Toronto, Canada); Dutch and GENRA samples were genotyped on the Sequenom iPlex platform at the Broad Institute; UKRAG samples were genotyped on the Sequenom iPlex platform at The University of Manchester, UK; GCI and LUMC samples were genotyped by kinetic PCR at Celera (Alameda California, USA); NARAC II samples were genotyped on the Sequenom iPlex platform at the NIH (USA); and NHS samples were genotyped on the Biotrove OpenArray platform at the Channing Laboratory, Harvard Medical School (Boston, USA). QC filter criteria for SNPs in each replication or validation collection were 10% missing data, 1% MAF and PHWE<10−3. If a given SNP failed in genotyping or QC in a collection, a proxy SNP (r2>0.8) with the least missing data (if available) was used. See Supplementary Note online for details.
Genome-wide association analyses
To address population stratification and remove outliers in our GWAS for BRASS, Canada, EIRA, NARAC I, and NARAC III, we performed principal component (PC) analysis using EIGENSTRAT57. For BRASS, Canada, NARAC I, and NARAC III we further removed poorly matched controls based on case-control Euclidean distances calculated from five PCs11. Once matched, imputation was conducted on GWAS genotype data for each GWAS collection separately, using the IMPUTE software16 and haplotype-phased HapMap Phase 2 European CEU founders as a reference panel. Imputation yielded posterior genotype probabilities as well as imputation quality scores at SNPs not genotyped with a minor allele frequency >=1% in HapMap CEU.
We conducted logistic regression analysis for each SNP in each GWAS collection, to estimate regression coefficients β and z-scores for allele counts (additive model), which were then genomic-control corrected17. λGC values for genotyped SNPs only versus all SNPs (Supplementary Table 5 online) verified that logistic regression controlled for any deflation in the distribution of association test results18. We then conducted a meta-analysis to combine results across datasets for 2,554,714 SNPs with high quality genotype data in one or more collections (see Supplementary Note online) by summing inverse variance-weighted β and z-scores18, and again genomic-control corrected our results. We also conducted Cochran’s Q test for heterogeneity across collections, using the β coefficients for each collection for which results were available for a given SNP. Detailed description of all analyses and results is provided in Supplementary Note online.
Replication analysis
Replication and combined analyses followed the GWAS meta-analysis: after matching in the NARAC II collection (Table 1)11, and removing spurious duplicate samples12, logistic regression was used to test for association and inverse variance-weighted z-scores were summed across collections. Replication association tests were one-tailed, for the same allele being risk or protective as in the GWAS meta-analysis.
Supplementary Material
Acknowledgments
RMP is supported by grants from the NIH (R01-AR057108, R01-AR056768, and U54 RR020278), a private donation from the Fox Trot Fund, the William Randolph Hearst Fund of Harvard University, the American College of Rheumatology ‘Within Our Reach’ campaign, and a Career Award for Medical Scientists from the Burroughs Wellcome Fund. SR is supported by an NIH Career Development Award (1K08AR055688–01A1) and an American College of Rheumatology Bridge Grant. The Broad Institute Center for Genotyping and Analysis is supported by grant U54 RR020278 from the National Center for Research Resources. The BRASS Registry is supported by a grant from Crescendo and Biogen-Idec. NARAC is supported by the NIH (NO1-AR-2–2263 and RO1 AR44422). LAC is supported by the NIH (R01 AI065841 and 5-M01-RR-00079). The Nurses Health Study is supported by NIH grants P01 CA87969, CA49449, CA67262, CA50385, AR049880–06 and AR47782. This research was also supported in part by the Intramural Research Program of the National Institute of Arthritis, Musculoskeletal and Skin Diseases of the National Institutes of Health. This research was also supported in part by grants to KAS from the Canadian Institutes for Health Research (MOP79321 and IIN - 84042) and the Ontario Research Fund (RE01061) and by a Canada Research Chair. Genotyping of UKRAG samples was supported by the Arthritis Research campaign arc grant reference number 17552 and by the Manchester Biomedical Research Centre and Manchester Academy of Health Sciences. CW was funded by the Netherlands Organization for Scientific Research (VICI grant 918.66.620). We acknowledge the help of Ben A.C. Dijkmans, Dirkjan van Schaardenburg, A. Salvador Peña, Paul L. Klarenbeek, Zhuoli Zhang, Mike T Nurmohammed, Willem F Lems, Rob R.J. van de Stadt, Wouter H. Bos, Jenny Ursum, Margret G.M. Bartelds, Daniëlle M. Gerlag, Marleen G.H. van der Sande, Carla A. Wijbrandts, and Marieke M.J. Herenius in gathering GENRA patient samples and data. We thank the Myocardial Infarction Genetics Consortium (MIGen) study for the use of genotype data from their healthy controls in our study. The MIGen study was funded by the U.S. National Institutes of Health and National Heart, Lung, and Blood Institute’s STAMPEED genomics research program R01HL087676 and a grant from the National Center for Research Resources. We thank Johanna Seddon Progression of AMD Study, AMD Registry Study, Family Study of AMD, The US Twin Study of AMD, and the Age-Related Eye Disease Study (AREDS) for use of genotype data from their healthy controls in our study. We thank David Hafler and the Multiple Sclerosis collaborative for use of genotype data from their healthy controls recruited at Brigham and Women’s Hospital.
Footnotes
Links
EIGENSTRAT software: http://genepath.med.harvard.edu/~reich/EIGENSTRAT.htm
IMPUTE and SNPTEST software: https://mathgen.stats.ox.ac.uk/impute/impute.html
GRAIL software: http://www.broadinstitute.org/mpg/grail/
GWAS meta-analysis results: http://www.broadinstitute.org/ftp/pub/rheumatoid_arthritis/Stahl_etal_2010NG
Author contributions
Study design: RMP, SR and EAS. Analysis: EAS (lead), SR, FASK, RC. Sample procurement and data generation: JW, KAS, PKG, LK, NAS, MEW, CW, MJHC, NdV, PPT, EWK, REMT, TWJH, ABB (leads); EFR, GX, SE, BPT, YL, AZ, AH, CG, LA, CIA, KGA, AB, JB, EB, NPB, JJC, J Coblyn, KHC, LAC, JBAC, J Cui, PIWdB, PLDJ, BD, PE, EF, PH, LJH, DLK, XK, ATL, XL, PM, AWM, LP, MDP, TRDJR, DMR, MS, MFS, SS, WT, AHMvdH-vM, IEvdH-B, CEvdS, PLCMvR, AGW, GJW, PW, BIRAC and YEAR consortia. Writing: RMP, EAS (leads); SR, FASK (primary contributors); JW, KAS, PKG, LK, NAS, MEW, CW, MJHC, NdV, PPT, EWK, REMT, TWJH, ABB, EFR, GX, SE, BPT, YL, AZ, AH, CG, LA, CIA, KGA, AB, JB, EB, NPB, JJC, J Coblyn, KHC, LAC, JBAC, J Cui, PIWdB, PLDJ, BD, PE, EF, PH, LJH, DLK, XK, ATL, XL, PM, AWM, LP, MDP, TRDJR, DMR, MS, MFS, SS, WT, AHMvdH-vM, IEvdH-B, CEvdS, PLCMvR, AGW, GJW, PW.
The authors declare that we have no competing financial interest.
References
- 1.Silman AJ, Pearson JE. Epidemiology and genetics of rheumatoid arthritis. Arthritis Res. 2002;4(Suppl 3):S265–72. doi: 10.1186/ar578. [DOI] [PMC free article] [PubMed] [Google Scholar]
- 2.Klareskog L, Catrina AI, Paget S. Rheumatoid arthritis. Lancet. 2009;373:659–72. doi: 10.1016/S0140-6736(09)60008-8. [DOI] [PubMed] [Google Scholar]
- 3.Suzuki A, et al. Functional haplotypes of PADI4, encoding citrullinating enzyme peptidylarginine deiminase 4, are associated with rheumatoid arthritis. Nat Genet. 2003;34:395–402. doi: 10.1038/ng1206. [DOI] [PubMed] [Google Scholar]
- 4.Begovich AB, et al. A missense single-nucleotide polymorphism in a gene encoding a protein tyrosine phosphatase (PTPN22) is associated with rheumatoid arthritis. Am J Hum Genet. 2004;75:330–7. doi: 10.1086/422827. [DOI] [PMC free article] [PubMed] [Google Scholar]
- 5.Kurreeman FA, et al. A candidate gene approach identifies the TRAF1/C5 region as a risk factor for rheumatoid arthritis. PLoS Med. 2007;4:e278. doi: 10.1371/journal.pmed.0040278. [DOI] [PMC free article] [PubMed] [Google Scholar]
- 6.Plenge RM, et al. Two independent alleles at 6q23 associated with risk of rheumatoid arthritis. Nat Genet. 2007;39:1477–1482. doi: 10.1038/ng.2007.27. [DOI] [PMC free article] [PubMed] [Google Scholar]
- 7.Plenge RM, et al. TRAF1-C5 as a Risk Locus for Rheumatoid Arthritis – A Genomewide Study. N Engl J Med. 2007;357:1199–209. doi: 10.1056/NEJMoa073491. [DOI] [PMC free article] [PubMed] [Google Scholar]
- 8.Remmers EF, et al. STAT4 and the risk of rheumatoid arthritis and systemic lupus erythematosus. N Engl J Med. 2007;357:977–86. doi: 10.1056/NEJMoa073003. [DOI] [PMC free article] [PubMed] [Google Scholar]
- 9.Thomson W, et al. Rheumatoid arthritis association at 6q23. Nat Genet. 2007;39:1431–1433. doi: 10.1038/ng.2007.32. [DOI] [PMC free article] [PubMed] [Google Scholar]
- 10.Zhernakova A, et al. Novel association in chromosome 4q27 region with rheumatoid arthritis and confirmation of type 1 diabetes point to a general risk locus for autoimmune diseases. Am J Hum Genet. 2007;81:1284–8. doi: 10.1086/522037. [DOI] [PMC free article] [PubMed] [Google Scholar]
- 11.Raychaudhuri S, et al. Common variants at CD40 and other loci confer risk of rheumatoid arthritis. Nat Genet. 2008;40:1216–23. doi: 10.1038/ng.233. [DOI] [PMC free article] [PubMed] [Google Scholar]
- 12.Raychaudhuri S, et al. Genetic variants at CD28, PRDM1 and CD2/CD58 are associated with rheumatoid arthritis risk. Nat Genet. 2009;41:1313–8. doi: 10.1038/ng.479. [DOI] [PMC free article] [PubMed] [Google Scholar]
- 13.Gregersen PK, et al. REL, encoding a member of the NF-kappaB family of transcription factors, is a newly defined risk locus for rheumatoid arthritis. Nat Genet. 2009;41:820–3. doi: 10.1038/ng.395. [DOI] [PMC free article] [PubMed] [Google Scholar]
- 14.Barton A, et al. Identification of AF4/FMR2 family, member 3 (AFF3) as a novel rheumatoid arthritis susceptibility locus and confirmation of two further panautoimmune susceptibility genes. Hum Mol Genet. 2009;18:2518–22. doi: 10.1093/hmg/ddp177. [DOI] [PMC free article] [PubMed] [Google Scholar]
- 15.Barton A, et al. Rheumatoid arthritis susceptibility loci at chromosomes 10p15, 12q13 and 22q13. Nat Genet. 2008;40:1156–9. doi: 10.1038/ng.218. [DOI] [PMC free article] [PubMed] [Google Scholar]
- 16.Marchini J, Howie B, Myers S, McVean G, Donnelly P. A new multipoint method for genome-wide association studies by imputation of genotypes. Nat Genet. 2007;39:906–13. doi: 10.1038/ng2088. [DOI] [PubMed] [Google Scholar]
- 17.Devlin B, Roeder K. Genomic control for association studies. Biometrics. 1999;55:997–1004. doi: 10.1111/j.0006-341x.1999.00997.x. [DOI] [PubMed] [Google Scholar]
- 18.de Bakker PI, et al. Practical aspects of imputation-driven meta-analysis of genomewide association studies. Hum Mol Genet. 2008;17:R122–8. doi: 10.1093/hmg/ddn288. [DOI] [PMC free article] [PubMed] [Google Scholar]
- 19.Consortium WTCC. Genome-wide association study of 14,000 cases of seven common diseases and 3,000 shared controls. Nature. 2007;447:661–78. doi: 10.1038/nature05911. [DOI] [PMC free article] [PubMed] [Google Scholar]
- 20.Suzuki A, et al. Functional SNPs in CD244 increase the risk of rheumatoid arthritis in a Japanese population. Nat Genet. 2008;40:1224–9. doi: 10.1038/ng.205. [DOI] [PubMed] [Google Scholar]
- 21.Kochi Y, et al. A functional variant in FCRL3, encoding Fc receptor-like 3, is associated with rheumatoid arthritis and several autoimmunities. Nat Genet. 2005;37:478–85. doi: 10.1038/ng1540. [DOI] [PMC free article] [PubMed] [Google Scholar]
- 22.Raychaudhuri S, et al. Identifying relationships among genomic disease regions: predicting genes at pathogenic SNP associations and rare deletions. PLoS Genet. 2009;5:e1000534. doi: 10.1371/journal.pgen.1000534. [DOI] [PMC free article] [PubMed] [Google Scholar]
- 23.Barrett JC, et al. Genome-wide association study and meta-analysis find that over 40 loci affect risk of type 1 diabetes. Nat Genet. 2009 doi: 10.1038/ng.381. [DOI] [PMC free article] [PubMed] [Google Scholar]
- 24.Barrett JC, et al. Genome-wide association defines more than 30 distinct susceptibility loci for Crohn’s disease. Nat Genet. 2008;40:955–62. doi: 10.1038/NG.175. [DOI] [PMC free article] [PubMed] [Google Scholar]
- 25.Harley JB, et al. Genome-wide association scan in women with systemic lupus erythematosus identifies susceptibility variants in ITGAM, PXK, KIAA1542 and other loci. Nat Genet. 2008;40:204–10. doi: 10.1038/ng.81. [DOI] [PMC free article] [PubMed] [Google Scholar]
- 26.Nair RP, et al. Genome-wide scan reveals association of psoriasis with IL-23 and NF-kappaB pathways. Nat Genet. 2009;41:199–204. doi: 10.1038/ng.311. [DOI] [PMC free article] [PubMed] [Google Scholar]
- 27.de Cid R, et al. Deletion of the late cornified envelope LCE3B and LCE3C genes as a susceptibility factor for psoriasis. Nat Genet. 2009;41:211–5. doi: 10.1038/ng.313. [DOI] [PMC free article] [PubMed] [Google Scholar]
- 28.Hom G, et al. Association of systemic lupus erythematosus with C8orf13-BLK and ITGAM-ITGAX. N Engl J Med. 2008;358:900–9. doi: 10.1056/NEJMoa0707865. [DOI] [PubMed] [Google Scholar]
- 29.van Heel DA, et al. A genome-wide association study for celiac disease identifies risk variants in the region harboring IL2 and IL21. Nat Genet. 2007;39:827–9. doi: 10.1038/ng2058. [DOI] [PMC free article] [PubMed] [Google Scholar]
- 30.Hunt KA, et al. Newly identified genetic risk variants for celiac disease related to the immune response. Nat Genet. 2008;40:395–402. doi: 10.1038/ng.102. [DOI] [PMC free article] [PubMed] [Google Scholar]
- 31.De Jager PL, et al. Meta-analysis of genome scans and replication identify CD6, IRF8 and TNFRSF1A as new multiple sclerosis susceptibility loci. Nat Genet. 2009;41:776–82. doi: 10.1038/ng.401. [DOI] [PMC free article] [PubMed] [Google Scholar]
- 32.Nobuhisa I, et al. Spred-2 suppresses aorta-gonad-mesonephros hematopoiesis by inhibiting MAP kinase activation. J Exp Med. 2004;199:737–42. doi: 10.1084/jem.20030830. [DOI] [PMC free article] [PubMed] [Google Scholar]
- 33.Ernst M, Jenkins BJ. Acquiring signalling specificity from the cytokine receptor gp130. Trends Genet. 2004;20:23–32. doi: 10.1016/j.tig.2003.11.003. [DOI] [PubMed] [Google Scholar]
- 34.Graham RR, et al. A common haplotype of interferon regulatory factor 5 (IRF5) regulates splicing and expression and is associated with increased risk of systemic lupus erythematosus. Nat Genet. 2006;38:550–555. doi: 10.1038/ng1782. [DOI] [PubMed] [Google Scholar]
- 35.Sigurdsson S, et al. Polymorphisms in the tyrosine kinase 2 and interferon regulatory factor 5 genes are associated with systemic lupus erythematosus. Am J Hum Genet. 2005;76:528–37. doi: 10.1086/428480. [DOI] [PMC free article] [PubMed] [Google Scholar]
- 36.Graham RR, et al. Three functional variants of IFN regulatory factor 5 (IRF5) define risk and protective haplotypes for human lupus. Proc Natl Acad Sci U S A. 2007;104:6758–63. doi: 10.1073/pnas.0701266104. [DOI] [PMC free article] [PubMed] [Google Scholar]
- 37.Sigurdsson S, et al. Association of a haplotype in the promoter region of the interferon regulatory factor 5 gene with rheumatoid arthritis. Arthritis Rheum. 2007;56:2202–2210. doi: 10.1002/art.22704. [DOI] [PubMed] [Google Scholar]
- 38.Dendrou CA, et al. Cell-specific protein phenotypes for the autoimmune locus IL2RA using a genotype-selectable human bioresource. Nat Genet. 2009;41:1011–5. doi: 10.1038/ng.434. [DOI] [PMC free article] [PubMed] [Google Scholar]
- 39.Maier LM, et al. IL2RA genetic heterogeneity in multiple sclerosis and type 1 diabetes susceptibility and soluble interleukin-2 receptor production. PLoS Genet. 2009;5:e1000322. doi: 10.1371/journal.pgen.1000322. [DOI] [PMC free article] [PubMed] [Google Scholar]
- 40.Todd JA, et al. Robust associations of four new chromosome regions from genomewide analyses of type 1 diabetes. Nat Genet. 2007;39:857–64. doi: 10.1038/ng2068. [DOI] [PMC free article] [PubMed] [Google Scholar]
- 41.Zhernakova A, van Diemen CC, Wijmenga C. Detecting shared pathogenesis from the shared genetics of immune-related diseases. Nat Rev Genet. 2009;10:43–55. doi: 10.1038/nrg2489. [DOI] [PubMed] [Google Scholar]
- 42.Plenge RM. Recent progress in rheumatoid arthritis genetics: one step towards improved patient care. Curr Opin Rheumatol. 2009;21:262–71. doi: 10.1097/BOR.0b013e32832a2e2d. [DOI] [PubMed] [Google Scholar]
- 43.Rothenberg EV, Moore JE, Yui MA. Launching the T-cell-lineage developmental programme. Nat Rev Immunol. 2008;8:9–21. doi: 10.1038/nri2232. [DOI] [PMC free article] [PubMed] [Google Scholar]
- 44.Hirota K, et al. Preferential recruitment of CCR6-expressing Th17 cells to inflamed joints via CCL20 in rheumatoid arthritis and its animal model. J Exp Med. 2007;204:2803–12. doi: 10.1084/jem.20071397. [DOI] [PMC free article] [PubMed] [Google Scholar]
- 45.Wucherpfennig KW, Call MJ, Deng L, Mariuzza R. Structural alterations in peptide-MHC recognition by self-reactive T cell receptors. Curr Opin Immunol. 2009 doi: 10.1016/j.coi.2009.07.008. [DOI] [PMC free article] [PubMed] [Google Scholar]
- 46.Sakaguchi N, et al. Altered thymic T-cell selection due to a mutation of the ZAP-70 gene causes autoimmune arthritis in mice. Nature. 2003;426:454–60. doi: 10.1038/nature02119. [DOI] [PubMed] [Google Scholar]
- 47.MacGregor AJ, et al. Characterizing the quantitative genetic contribution to rheumatoid arthritis using data from twins. Arthritis Rheum. 2000;43:30–7. doi: 10.1002/1529-0131(200001)43:1<30::AID-ANR5>3.0.CO;2-B. [DOI] [PubMed] [Google Scholar]
- 48.van der Woude D, et al. Quantitative heritability of anti-citrullinated protein antibody-positive and anti-citrullinated protein antibody-negative rheumatoid arthritis. Arthritis Rheum. 2009;60:916–23. doi: 10.1002/art.24385. [DOI] [PubMed] [Google Scholar]
- 49.Gateva V, et al. A large-scale replication study identifies TNIP1, PRDM1, JAZF1, UHRF1BP1 and IL10 as risk loci for systemic lupus erythematosus. Nat Genet. 2009;41:1228–33. doi: 10.1038/ng.468. [DOI] [PMC free article] [PubMed] [Google Scholar]
- 50.Arnett FC, et al. The American Rheumatism Association 1987 revised criteria for the classification of rheumatoid arthritis. Arthritis Rheum. 1988;31:315–24. doi: 10.1002/art.1780310302. [DOI] [PubMed] [Google Scholar]
- 51.Neale BM, et al. A Genome-Wide Scan of Advanced Age-Related Macular Degeneration Suggests a Novel Role of Lipase-C. 2009 in review. [Google Scholar]
- 52.Kathiresan S, et al. Genome-wide association of early-onset myocardial infarction with single nucleotide polymorphisms and copy number variants. Nat Genet. 2009;41:334–41. doi: 10.1038/ng.327. [DOI] [PMC free article] [PubMed] [Google Scholar]
- 53.Coenen MJ, et al. Common and different genetic background for rheumatoid arthritis and coeliac disease. Hum Mol Genet. 2009;18:4195–203. doi: 10.1093/hmg/ddp365. [DOI] [PubMed] [Google Scholar]
- 54.Wijbrandts CA, et al. The clinical response to infliximab in rheumatoid arthritis is in part dependent on pretreatment tumour necrosis factor alpha expression in the synovium. Ann Rheum Dis. 2008;67:1139–44. doi: 10.1136/ard.2007.080440. [DOI] [PMC free article] [PubMed] [Google Scholar]
- 55.Costenbader KH, Chang SC, De Vivo I, Plenge R, Karlson EW. PTPN22, PADI-4 and CTLA-4 genetic polymorphisms and risk of rheumatoid arthritis in two longitudinal cohort studies: evidence of gene-environment interactions with heavy cigarette smoking. Arthritis Res Ther. 2008;10:R52. doi: 10.1186/ar2421. [DOI] [PMC free article] [PubMed] [Google Scholar]
- 56.Purcell S, et al. PLINK: a tool set for whole-genome association and populationbased linkage analyses. Am J Hum Genet. 2007;81:559–75. doi: 10.1086/519795. [DOI] [PMC free article] [PubMed] [Google Scholar]
- 57.Price AL, et al. Principal components analysis corrects for stratification in genomewide association studies. Nat Genet. 2006;38:904–9. doi: 10.1038/ng1847. [DOI] [PubMed] [Google Scholar]
Associated Data
This section collects any data citations, data availability statements, or supplementary materials included in this article.