Abstract
We sought to evaluate trends in overall and race-specific pediatric heart transplant (HT) wait-list mortality in the United States (US) during the last 20 years. We identified all children <18 years old listed for primary HT in the US during 1989–2009 (N=8096, 62% white, 19% black, 13% Hispanic, 6% other) using the Organ Procurement and Transplant Network database. Wait-list mortality was assessed in 4 successive eras (1989–1994, 1995–1999, 2000–2004, and 2005–2009). Overall wait-list mortality declined in successive eras (26%, 23%, 18% and 13%, respectively). The decline across eras remained significant in adjusted analysis (hazard ratio [HR] 0.70 in successive eras, 95% confidence interval [CI] 0.67, 0.74) and was 67% lower for children listed during 2005–2009 vs. those listed during 1989–1994 (HR 0.33, CI 0.28, 0.39). In models stratified by race, wait-list mortality decreased in all racial groups in successive eras. In models stratified by era, minority children were not at higher risk of wait-list mortality in the most recent era. We conclude that the risk of wait-list mortality among US children listed for HT has decreased by two-thirds during the last 20 years. Racial gaps in wait-list mortality present variably in the past are not present in the current era.
Keywords: heart transplantation, children, race, outcomes
INTRODUCTION
Early post-transplant survival has progressively improved in pediatric heart transplant (HT) recipients during the last 2 decades.(1, 2) This improvement, often referred to as the “era effect”, has benefited children of all racial/ethnic groups in the United States (US).(3) In contrast, the trends in wait-list mortality among children listed for a HT have not been characterized beyond brief comments in the reports of the Scientific Registry of Transplant Recipients.(4, 5) Even less is known about racial differences in wait-list mortality among children listed for a HT in the US,(6) in particular how these differences have evolved over time.
Children on the HT wait-list in the US face a higher risk of death while waiting than children listed for other solid organs or adults listed for a HT.(5, 7) Based on internal analyses of risk factors, the United Network of Organ Sharing (UNOS) has periodically modified the heart allocation policy for listed candidates with a goal to minimize their risk of death while waiting.(8) Advances in heart failure management(9) and the recent availability of ventricular assist devices for children as a bridge to HT(10, 11) are also likely to have improved survival in children on the wait-list. We therefore hypothesized that the risk of death on the HT wait-list among children in the US has progressively decreased during the last 20 years and that this decrease has been observed in children of all racial/ethnic groups. In this study, we sought to assess trends in overall and race-specific wait-list mortality among children listed for a HT in the US during the last 20 years.
MATERIALS AND METHODS
Study Population
All children <18 years of age who were listed for a primary HT in the US between January 1, 1989 and June 30, 2009 were identified in the Organ Procurement and Transplant Network (OPTN) database. The OPTN database includes demographic and clinical data on all wait-listed candidates in the US as submitted by the transplant centers. The Health Resources and Services Administration, US Department of Health and Human Services provides oversight to the activities of the OPTN contractor, the United Network for Organ Sharing (UNOS).
We excluded children who were listed for heart re-transplantation or for multi-visceral transplantation. All children were followed from the time of listing for HT until transplant, removal from the list, death or the day of last observation on November 20, 2009.
Study Design and Definitions
We tested the hypotheses that the risk of death while awaiting HT, adjusted for heart failure severity and other risk factors, has decreased during the last 20 years in children in the US and that all racial/ethnic groups have benefited from this progress. We compared baseline characteristics and wait-list mortality in children listed for a HT during 4 successive eras (those listed during years 1989–1994, 1995–1999, 2000–2004 and 2005–2009) in the OPTN database. These eras were chosen to allow approximately equivalent number of wait-listed children in each era. We defined time on the wait-list as the duration from initial listing to the date of removal from the wait-list due to transplant, death, deterioration or recovery. Children who died while awaiting HT were considered to have reached the primary endpoint. We also assessed a secondary, composite outcome of death on the wait-list or becoming too sick to transplant (removal from the list due to clinical deterioration). All clinical and demographic variables were defined at listing. Subjects were censored at the time of transplant, recovery (removal from the list) or the last day of the study.
Patient race/ethnicity (a mandatory variable) was reported by the transplant center as one of the following: white, black, Hispanic/Latino, Asian, American Indian/Alaska Native, Native Hawaiian/Pacific Islander, Multiracial, and Other. Due to the small sample size of racial/ethnic groups other than white, black or Hispanic, we categorized listed children into 4 groups: white, black, Hispanic and Other. The distribution of race/ethnicity among listed children during the study years was compared to the concurrent racial distribution of US children by extracting demographic data from the government web site childstats.gov.
To adjust for heart failure severity, we categorized listed children based on the level of hemodynamic support. A child was defined to be on extra-corporeal membrane oxygenation (ECMO) if supported on ECMO, on ventilator if on a ventilator but not on ECMO and on inotropes, if supported by inotropes but not a ventilator or ECMO.
None of the children had any missing data for the variables age, gender, race/ethnicity, diagnosis, blood type, hemodynamic support, dialysis and the dates of listing, death, removal or transplant. For children with missing data on any other variable, we created the corresponding indicator variable “variable not reported” to allow these children to contribute their other risk factors in multivariable models.
Statistical Analysis
Summary statistics are presented as median (inter-quartile range (IQR), 25th to 75th percentile) or number (percent). Baseline characteristics were compared among children listed during the 4 eras and among racial/ethnic groups using the chi-square test for categorical and the Kruskal-Wallis test for continuous variables. Univariable relationships of baseline variables (Table 1) with wait-list mortality were assessed using the log-rank test. Multivariable analyses were performed using a Cox proportional hazards model using forward selection; variables (Table 1) significant at the 0.10 level based on a likelihood ratio test were retained in the model to develop models of risk factors for primary and secondary outcome. Interaction of demographic and clinical risk factors was assessed prior to evaluation of era and race effect. Era effect was first assessed across race/ethnicity. Era effect was modeled in two ways, as a continuous variable coded 1 to 4 from the earliest to the most recent time period and using 1989–1994 as the reference group with binary, indicator covariates for each subsequent period. To verify the proportional hazards assumption, interactions between each risk factor and survival time were examined.
Table 1.
Baseline Characteristics of Wait-listed Patients by Era of Listing
| Variable | 1989–1994 (n=2078) | 1995–1999 (n=1982) | 2000–2004 (n=2057) | 2005–2009 (n=1979) | Total (n=8096) | P Value |
|---|---|---|---|---|---|---|
| Age, yr | 1 [0,10] | 2 [0,12] | 2 [0,11] | 2 [0,11] | 2 [0,11] | <0.001 |
| Age categories (yr) | <0.001 | |||||
| <1 | 994 (48) | 777 (39) | 772 (38) | 758 (38) | 3301 (41) | |
| 1–5 | 382 (18) | 385 (19) | 476 (23) | 453 (23) | 1696 (21) | |
| 6–11 | 275 (13) | 293 (15) | 308 (15) | 289 (15) | 1165 (14) | |
| 12–17 | 427 (21) | 527 (27) | 501 (24) | 479 (24) | 1934 (24) | |
| Female Gender | 860 (41) | 829 (42) | 912 (44) | 887 (45) | 3488 (43) | 0.06 |
| Diagnosis | <0.001 | |||||
| Repaired CHD | 5 (<1) | 38 (2)) | 394 (19) | 736 (37) | 1173 (14) | |
| Un-repaired CHD | 791(38) | 953 (48) | 619 (30) | 196 (10) | 2559 (33) | |
| CMP | 475 (23) | 797 (40) | 904 (44) | 856 (43) | 3032 (37) | |
| Other | 807 (39) | 194 (10) | 140 (7) | 191 (10) | 1332 (16) | |
| Prior Cardiac Surgery | 9 (<1) | 53 (3) | 468 (23) | 834 (42) | 1364 (17) | <0.001 |
| Listing Status | <0.001 | |||||
| 1 or 1A | 1445 (70) | 1304 (66) | 1264 (61) | 1313 (66) | 5326 (66) | |
| 1B | 0 (0) | 60 (3) | 264 (13) | 244 (12) | 568 (7) | |
| 2 | 633 (30) | 618 (31) | 529 (26) | 422 (21) | 2202 (27) | |
| Type of Support | <0.001 | |||||
| ECMO | 18 (1) | 155 (8) | 256 (12) | 237 (12) | 666 (8) | |
| Ventilator | 70 (3) | 424 (21) | 408 (20) | 387 (20) | 1289 (16) | |
| Inotropes | 88 (4) | 496 (25) | 601 (29) | 520 (26) | 1705 (21) | |
| None of above | 1902 (92) | 907 (46) | 792 (39) | 835 (42) | 4436 (55) | |
| VAD | 14 (1) | 47 (2) | 71 (3) | 132 (7) | 264 (3) | <0.001 |
| Blood Type | 0.03 | |||||
| O | 947 (46) | 957 (48) | 1000 (49) | 993 (50) | 3897 (48) | |
| A | 823 (40) | 703 (35) | 741 (36) | 677 (34) | 2944 (36) | |
| B | 228 (11) | 247 (12) | 232 (11) | 243 (12) | 950 (12) | |
| AB | 80 (4) | 75 (4) | 84 (4) | 66 (3) | 305 (4) | |
| Dialysis | 3 (<1) | 23 (1) | 31 (2) | 47 (2) | 104 (1) | <0.001 |
| Medicaid Insurance | 140 (7) | 649 (33) | 827 (40) | 869 (44) | 2485 (31) | <0.001 |
| Racial Group | <0.001 | |||||
| White | 1477 (71) | 1324 (67) | 1196 (58) | 1051 (53) | 5048 (62) | |
| Black | 337 (16) | 350 (18) | 386 (19) | 445 (22) | 1518 (19) | |
| Hispanic | 164 (8) | 227 (11) | 337 (16) | 352 (18) | 1080 (13) | |
| Other | 100 (5) | 81 (4) | 138 (7) | 131 (7) | 450 (6) |
Values are summarized as number (percent) or median (25th, 75th percentile). Yr (year), CHD (congenital heart disease), CMP (cardiomyopathy), ECMO (extra-corporeal membrane oxygenation), VAD (ventricular assist device)
Race-era interaction terms, with era as a continuous variable, were added to the main-effects models to assess whether there were racial differences in era effect for wait-list mortality. Because race-era interaction terms appeared statistically significant, multivariable models stratified by era were developed to assess racial differences in risk-adjusted wait-list mortality in the 4 eras. Similarly, stratified multivariable models for each racial/ethnic group were developed to assess risk-adjusted era effect in each group. The data were analyzed using statistical software SAS version 9.1 (SAS Institute Inc, Cary, NC) and STATA version 11.0 (StataCorp LP, College Station, TX).
The authors had full access to the data and take responsibility for its integrity. All authors have read and agree to the manuscript as written.
RESULTS
Study Population
During the study period, 8987 children were listed for HT in the US. Of these, 867 children were listed for heart re-transplantation and 24 for multi-visceral transplantation. These 891 children were excluded from further analysis. The remaining 8096 children formed the analytic cohort. Of these, 5048 (62%) were listed as white, 1518 (19%) as black, 1080 (13%) as Hispanic and the remaining 450 (6%) were defined as “Other”. The OPTN database reports race and ethnicity as two separate variables. For all white, black and Hispanic children in the cohort, race and ethnicity variables in the database were concordant (identical).
The baseline characteristics of study children by era of listing are summarized in Table 1. As expected, white children represented a lower percentage and the three minority groups a higher percentage of listed children in successive eras. This finding appeared to be in part due to a higher proportion of black and Hispanic children in the US getting listed for a HT in recent eras (Fig S1, online supplement). There was a progressive increase in the percentage of listed children with a diagnosis of congenital heart disease and prior cardiac surgery (P<0.001), in children supported by a ventricular assist device (P<0.001), in children on dialysis (P<0.001) and in those on public medical insurance (P<0.001). Only 7% of children listed during 1987–1994 had Medicaid insurance compared to ≥40% of children listed during the 2 recent eras.
Black children were likely to be older and more likely to have cardiomyopathy as their listing diagnosis (P<0.001 for distribution of age and diagnosis, see Table S1, online supplement). White children were more likely to have congenital heart disease with previous cardiac surgery as their listing diagnosis compared to other groups (P<0.001). Black and Hispanic children were more likely to have blood type O and less likely to have blood type A compared to white and other children (P<0.001 for racial distribution of blood type). Black (50%) and Hispanic (52%) children were more likely than white (21%) and Other (25%) children to have public medical insurance (P<0.001). Although there were statistically significant differences in racial distribution of gender, listing status and hemodynamic support, the differences appeared to be small and due to large sample size rather than of clinical importance.
Era Effect for Wait-list Mortality
Of 8096 children in the study, 4969 (61%) received a HT, 1616 (20%) died on the wait-list, 263 (3%) were removed from the wait-list due to clinical deterioration, 1090 (13%) were removed due to recovery or other reasons and 158 (2%) were still waiting on the last day of the study. Of 263 children who were removed from the wait-list due to clinical deterioration, 8 were re-listed, 5 died after re-listing, 2 were removed again due to deterioration and one due to recovery. There was a progressive decline in overall wait-list mortality in successive eras (26%, 23%, 18% and 13%, respectively). Wait-list mortality declined in all age-groups during the study period. Wait-list mortality was 29%, 29%, 22% and 19%, respectively during the four eras in infants less than 1 year of age. A similar trend was noted in the secondary, composite outcome of death on the wait-list or removal from the list due to clinical deterioration.
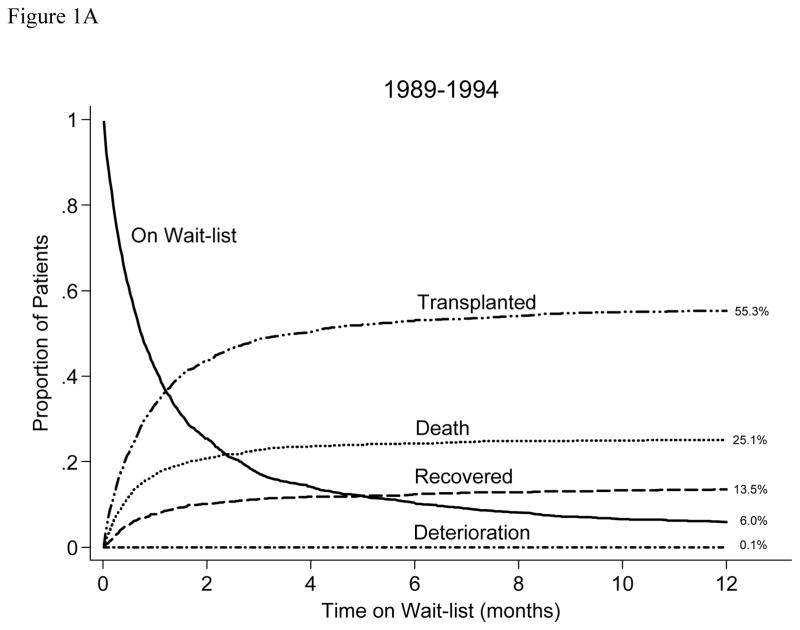
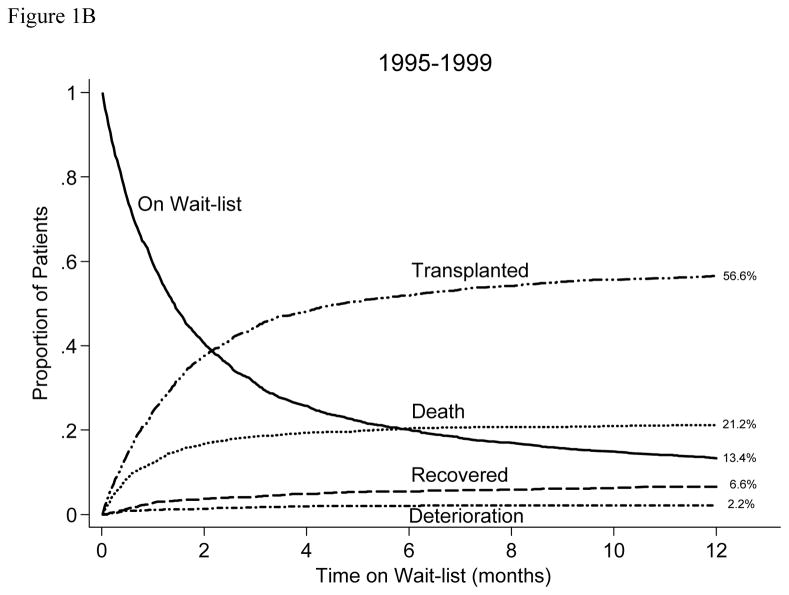
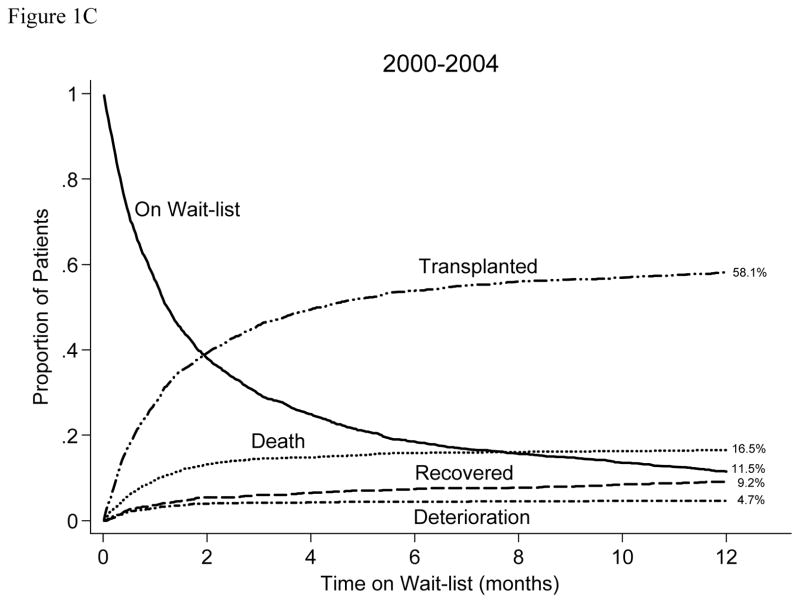
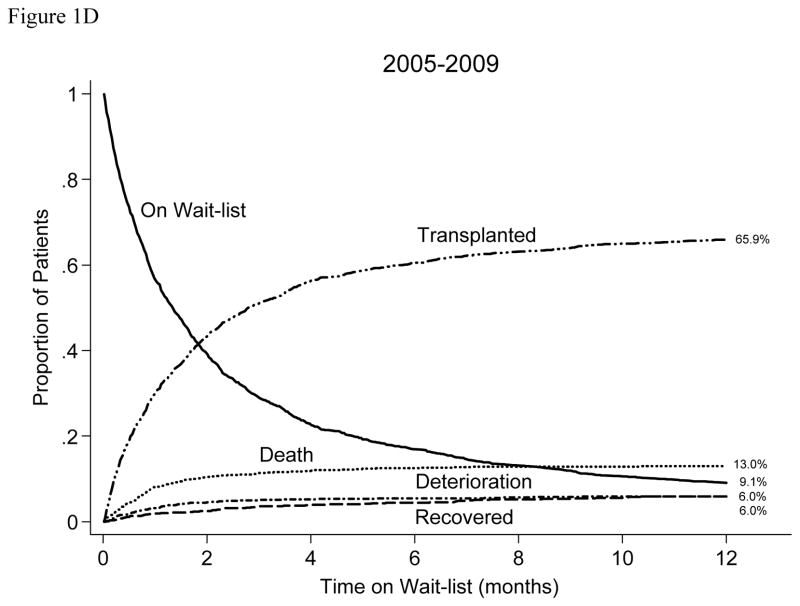
Figure 1 illustrates competing outcomes (proportion transplanted, died, removed due to deterioration, removed due to recovery/other reasons, and still waiting) in wait-listed children during the 12 months after listing for each of the 4 eras. There was a progressive increase in percentage of children listed during each era who received a HT (57, 60, 61, and 68 percent respectively including those transplanted > 12 months after listing) and a progressive increase in percentage of children who were removed from the list due to clinical deterioration (0.1, 2.2, 4.7, and 6.0 percent, respectively). The percentage of children who were removed from the list due to recovery appeared to be smaller with time whereas the percentage of children who were still on the wait-list >12 months after initial listing appeared to be higher in successive eras (Figure 2), however these trends were not consistent across eras. The percentage of children supported on a VAD at the time of their transplant increased progressively (2, 6, 7, and 13 percent, respectively) as did the percentage of children transplanted with an ABO incompatible HT (<1, <1, 1, and 4 percent, respectively).
Figure 1.
Competing outcomes after wait-listing for HT in children listed during the four study eras (1989–1994, 1995–1999, 2000–2004, 2005–2009) in the US.
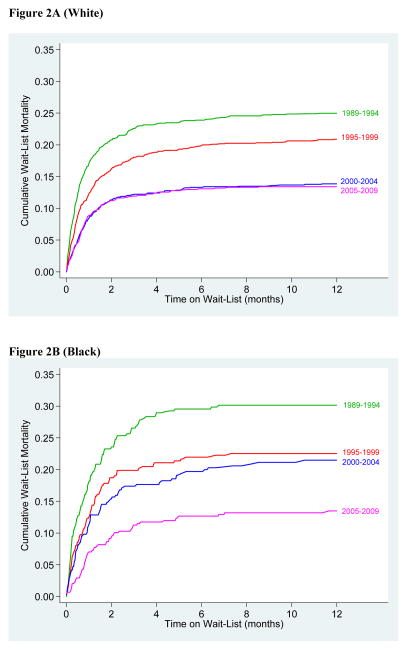
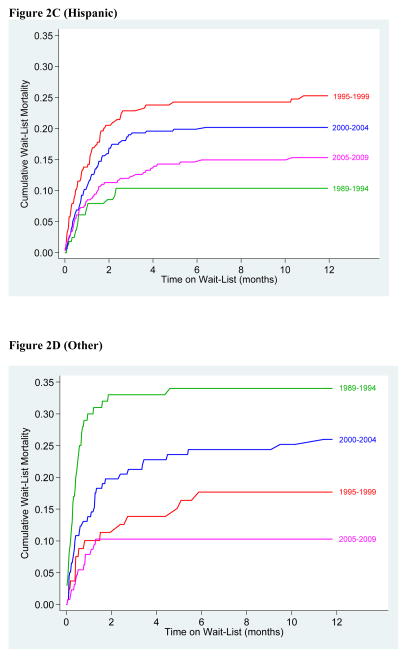
Figure 2.
Cumulative wait-list mortality during the study eras in white (3A), black (3B), Hispanic (3C) and Other (3D) children.
Overall wait-list mortality was 19% in white, 19% in Hispanic, 22% in black and 22% in Other children. During 1989–1994, only 12% of Hispanic children died on the wait-list compared to 26%, 31% and 34% of white, black and Other children, respectively. In the most recent era (2005–2009), wait-list mortality was 13% in white, 13% in black, 14% in Hispanic and 10% in Other children (Figure 2)
Predictors of Wait-list Mortality
In univariable analysis, a higher risk of wait-list mortality (shorter time to death) was associated with younger age, congenital heart disease, listing status 1 or 1A, ECMO or ventilator support, and dialysis support. Blood type A and the more recent eras were associated with a lower risk of death on the wait-list. Compared to children listed during 1989–1994, the risk of death on the wait-list decreased by 36% during 1995–1999 (Hazard ratio [HR] 0.64, 95% confidence interval CI 0.56, 0.73), by 47% during 2000–2004 (HR 0.53, CI 0.46, 0.60) and by 59% during 2005–2009 (HR 0.41, CI 0.35, 0.47). Similar associations were found for the secondary, composite outcome of wait-list mortality or removal from the list due to clinical deterioration.
In a multivariable model of era effect across race/ethnicity, the decline in mortality across eras remained significant after adjusting for age, race/ethnicity, diagnosis, blood type, listing status, hemodynamic support and dialysis (hazard ratio [HR] 0.70 in successive eras, 95% confidence interval [CI] 0.67, 0.74, P<0.001, Table 2). Wait-list mortality declined significantly in infants < 1year of age (HR 0.74 in successive eras, P<0.001) as well as in older children (HR 0.66 in successive eras, P<0.001). The overall risk of wait-list mortality was 67% lower in children listed during 2005–09 vs. those listed during 1989–94 (HR 0.33, CI 0.28, 0.39, P<0.001) in adjusted analysis. A similar association was found for the secondary outcome of death or de-listing due to deterioration in adjusted analysis (HR 0.78 in successive eras, 95% CI 0.74, 0.82, P<0.001). When race-era interaction terms were added to the models for wait-list mortality or the secondary outcome in Table 2, statistically significant interaction terms were identified, suggesting either that there were racial differences in era effect or that there were racial differences in wait-list outcomes in one or more eras. These findings were further evaluated by developing multivariable models of wait-list outcomes for children in each era and in each racial group (stratified multivariable models).
Table 2.
Multivariable Models of Primary (Wait-list Mortality) and Secondary (Composite of Wait-list Mortality and Removal due to Clinical Deterioration) Outcome
| Primary* Outcome HR (95% CI) |
P Value | Secondary* Outcome HR (95% CI) |
P Value | |
|---|---|---|---|---|
| Diagnosis (vs. CMP) | ||||
| CHD | 1.6 (1.4, 1.8) | <0.001 | 1.7 (1.5, 1.9) | <0.001 |
| Other | 2.7 (2.3, 3.1) | <0.001 | 2.4 (2.1, 2.8) | <0.001 |
| Listing Status 1/1A | 2.9 (2.5, 3.3) | <0.001 | 2.8 (2.5, 3.2) | <0.001 |
| Hemodynamic Support (vs. No ECMO or Ventilator) | ||||
| ECMO/Age<1 yr | 3.6 (3.0, 4.4) | <0.001 | 4.4 (3.7, 5.2) | <0.001 |
| ECMO/Age≥1 yr | 1.9 (1.5, 2.4) | <0.001 | 2.2 (1.8, 2.7) | <0.001 |
| Ventilator | 1.9 (1.6, 2.1) | <0.001 | 2.0 (1.8, 2.3) | <0.001 |
| Blood Type A | 0.85 (0.77, 0.95) | 0.004 | 0.88 (0.79, 0.97) | 0.01 |
| Dialysis | 1.8 (1.3, 2.5) | 0.001 | 1.8 (1.4, 2.4) | <0.001 |
| Race (vs. White) | ||||
| Black | 1.2 (1.0, 1.3) | 0.01 | 1.2 (1.1, 1.4) | 0.002 |
| Hispanic | 1.1 (0.9, 1.2) | 0.44 | 1.1 (1.0, 1.3) | 0.11 |
| Other | 1.4 (1.1, 1.7) | 0.002 | 1.4 (1.1, 1.7) | <0.001 |
| Era (vs. 1989–94) | ||||
| 1995–1999 | 0.59 (0.51, 0.68) | <0.001 | 0.60 (0.52, 0.69) | <0.001 |
| 2000–2004 | 0.47 (0.40, 0.55) | <0.001 | 0.54 (0.47, 0.62) | <0.001 |
| 2005–2009 | 0.33 (0.28, 0.39) | <0.001 | 0.44 (0.38, 0.51) | <0.001 |
| Era (Linear) | 0.70 (0.67, 0.74) | <0.001 | 0.78 (0.74, 0.82) | <0.001 |
The models include predictors prior to evaluation of a race-era interaction. Hazard ratios for the demographic and clinical variables are for the model with era as a continuous (linear) variable. HR (hazard ratio), CI (confidence interval), CHD (congenital heart disease), CMP (cardiomyopathy), ECMO (extra-corporeal membrane oxygenation)
Stratified Multivariable Models
In multivariable models stratified by race (with era as a continuous variable), era effect was present in all racial groups: white (HR 0.69, CI 0.64, 0.74, P<0.001), black (HR 0.70, CI 0.63, 0.78, P<0.001), Hispanic (HR 0.82, CI 0.71, 0.95, P=0.008) and Other (HR 0.64, CI 0.52, 0.79, P<0.001). Era effect was also demonstrated for the secondary, composite outcome in white (HR 0.77, 95% CI 0.72, 0.82, P<0.001), black (HR 0.75, 95% CI 0.68, 0.83, P<0.001) and Other (HR 0.73, 95% CI 0.61, 0.89, P=0.001) children but not in Hispanic children (HR 0.93, 95% CI 0.82, 1.1, P=0.28).
Figure 3 illustrates risk-adjusted hazard ratios for wait-list mortality (with corresponding 95% confidence intervals) in minority children compared to white children derived from multivariable models developed in wait-listed children in each era. Hispanic children listed during 1987–1994 were at lower risk of wait-list mortality. All three minority groups were at higher risk of wait-list mortality compared to white children during 2000–2004, however no racial differences in wait-list mortality were present in the most recent era (2005–2009). Similar results were obtained for the secondary, composite outcome in multivariable models developed for children in each era.
Figure 3.
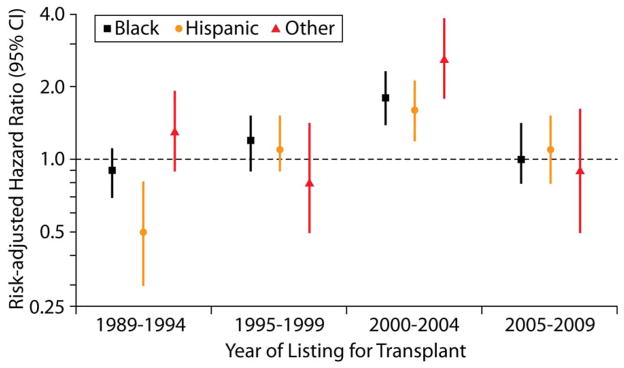
Hazard ratios and 95% confidence intervals for wait-list mortality in Black, Hispanic and Other children (vs. white children) during the four eras. Hazard ratios (CI) during each era were derived from a multivariable model limited to children listed in that era.
DISCUSSION
In this study, we found that the risk of dying on the wait-list among US children listed for a HT, adjusted for patient factors such as age, cardiac diagnosis, severity of heart failure and blood type, has decreased by two-thirds during the last 20 years. The risk of wait-list mortality has declined in infants as well as in older children. Importantly, the decline in wait-list mortality is demonstrable in children of all racial/ethnic groups and racial gaps in wait-list mortality, present variably in the past, are not present in the most recent era.
Although fewer deaths/patient-years of wait-list time among children listed for a HT have been previously noted (4, 5), this is the first study to describe trends in risk-adjusted wait-list mortality over a 20-year period. Because the annual HT procedures among US children were rather constant during the 1990s (12) and have gone up only recently (5), these trends in wait-list outcomes spanning 2 decades cannot be explained by a progressive increase in availability of donor hearts. Potential mechanisms include advances in the care of children with end-stage heart failure (9), better selection of transplant candidates and changes in donor allocation algorithm to ameliorate risk of death in high-risk groups. Recent availability of ventricular assist devices for infants and young children in need of mechanical support has allowed longer waiting times and may have contributed to the decline in wait-list mortality (10, 11, 13) as suggested by a progressive increase in the percentage of children receiving a HT while supported by a VAD in our analysis. Publication of guidelines for listing for heart transplantation in children may have helped centers improve their patient selection and timing of listing of children in heart failure.(14) A progressive increase in percentage of children who were removed from the list due to clinical deterioration (Figure 2) seems to have contributed to the decrease in wait-list mortality and may suggest a higher vigilance with respect to ongoing transplant suitability among listed children. Finally, allocation changes that may have helped improve outcomes in wait-listed children (8, 15) include (a) allocation of hearts from blood type O donors to type O recipients prior to their allocation to recipients of other blood types, (b) allocation of hearts from donors < 18 years old to children <18 years old before their allocation to eligible adults, (c) assigning a higher priority for donor hearts to sicker status 1A patients after dividing status 1 patients into 1A and 1B, (d) allowing allocation of donor hearts to ABO incompatible infants based on early success of this strategy (16–18) even as the long-term outcomes of such transplants were still awaited, and (e) allowing broader regional sharing of donor hearts to 1A and 1B candidates before directing them to less sick, local candidates. Although some of these mechanisms such as increasing number of ABO incompatible HT in infants have likely increased donor pool by allowing use of hearts that would otherwise be discarded (19), others have re-directed hearts towards children more urgently in need resulting in gains in risk-adjusted survival that are even more substantial than in simple comparison of survival across eras. Some of the potential mechanisms discussed here are speculative and are hypothesis-generating for future analyses.
Our analysis provides important insights into trends in racial gaps in wait-list mortality. We previously analyzed racial differences in wait-list mortality among children listed for a HT in the US during 1999–2006 and reported that all minority groups were at increased risk of overall and risk-adjusted wait-list mortality.(6) These findings led us to ask whether racial gaps in wait-list mortality have been present since the early years of HT and if so whether they have narrowed with time. We were surprised by the finding that Hispanic children were at a lower risk of risk-adjusted wait-list mortality vs. white children during 1987–1994. A potential explanation for this finding is that during the early years of pediatric HT, Hispanic children deemed to at high risk of poor post-transplant outcome were less likely to be listed. This speculation is supported by a lower percentage of US Hispanic children listed during that era (Figure 1B) and our previous analysis that showed better early post-transplant survival in Hispanic children (vs. other groups) during early years of pediatric HT.(20) The increased risk of wait-list mortality in minority children during 2000–2004 noted in the current analysis is consistent with our previous work.(6) This era is characterized by minority children representing a larger percentage of listed children compared to earlier eras (Figure 1A and 1B). Minority children on ventilator support appeared to be at particularly high risk for wait-list mortality during this era.(6)
The increase in percentage of black and Hispanic children listed for HT across eras appears disproportionate to and cannot be explained solely by a higher percentage of minority children in the US. A potential explanation is a progressive increase in incidence of end-stage heart failure in black and Hispanic children during the last 2 decades, a finding not reported previously. Alternatively, minority children in heart failure may be more likely to get listed for HT in the current era due to increased availability or acceptance of this therapy among minorities. Because the percentage of HT candidates on Medicaid insurance has also increased progressively, HT listing may have been determined by both medical and socioeconomic factors in the earlier eras. If so, these trends may represent a true narrowing of racial/ethnic gaps in access to HT among children in the US.
This study has limitations. First, it is a retrospective analysis of a national database with potentially variable quality control of submitted data among transplant centers. However, because these data are used by the UNOS to mediate real-time organ allocation in the US and to subsequently evaluate center performance, certain safeguards to data quality are to be expected. Second, race/ethnicity was analyzed as reported by the transplant centers and some children may have been misclassified. However, such misclassification is likely to be non-differential and not affect the study results because of the relatively large sample size. Third, the study does not provide insights into health care access and variations, if any, in clinical criteria for HT listing among racial/ethnic groups. Nonetheless, because of the regulatory requirement to report all wait-listed candidates to UNOS, the study cohort represents the entire population of interest and thus the best source for answering the study question.
In conclusion, the risk of wait-list mortality among US children listed for HT has decreased by two-thirds during the last 20 years. Racial gaps in wait-list mortality present variably in the past are not present in the most recent era.
Supplementary Material
Acknowledgments
Dr. Gauvreau had full access to all the data in the study and takes responsibility for the integrity of the data and the accuracy of data analysis. The work was supported in part by Health Resources and Services Administration contract 234-2005-370011C. The data reported here were supplied by the UNOS as the OPTN contractor. The interpretation and reporting of these data are the responsibility of the authors and not an official policy of or interpretation by the OPTN or the US Government. This study was supported by Heart Transplant Education and Research Fund, Department of Cardiology, Children’s Hospital Boston. This work was supported by the National Institutes of Health under award number: T32HL007572.
List of Abbreviations
- HT
heart transplant
- US
United States
- UNOS
United Network for Organ Sharing
- OPTN
Organ Procurement and Transplant Network
- ECMO
extra-corporeal membrane oxygenation
- IQR
inter-quartile range
- HR
hazard ratio
- CI
confidence interval
- VAD
ventricular assist device
Footnotes
The content is solely the responsibility of the authors and does not necessarily represent the official views of the National Institutes of Health.
Disclosures
The authors of this manuscript have no conflicts of interest to disclose as described by the American Journal of Transplantation.
Additional supporting information (Table S1 and Figure S1) may be found in the online version of this article
References
- 1.Kirk R, Edwards LB, Kucheryavaya AY, Aurora P, Christie JD, Dobbels F, et al. The Registry of the International Society for Heart and Lung Transplantation: thirteenth official pediatric heart transplantation report--2010. J Heart Lung Transplant. 2010;29(10):1119–28. doi: 10.1016/j.healun.2010.08.009. [DOI] [PubMed] [Google Scholar]
- 2.Boucek MM, Aurora P, Edwards LB, Taylor DO, Trulock EP, Christie J, et al. Registry of the International Society for Heart and Lung Transplantation: tenth official pediatric heart transplantation report--2007. J Heart Lung Transplant. 2007;26(8):796–807. doi: 10.1016/j.healun.2007.06.006. [DOI] [PubMed] [Google Scholar]
- 3.Singh TP, Edwards LB, Kirk R, Boucek MM. Era effect on post-transplant survival adjusted for baseline risk factors in pediatric heart transplant recipients. J Heart Lung Transplant. 2009;28(12):1285–91. doi: 10.1016/j.healun.2009.05.003. [DOI] [PubMed] [Google Scholar]
- 4.Magee JC, Krishnan SM, Benfield MR, Hsu DT, Shneider BL. Pediatric transplantation in the United States, 1997–2006. Am J Transplant. 2008;8(4 Pt 2):935–45. doi: 10.1111/j.1600-6143.2008.02172.x. [DOI] [PubMed] [Google Scholar]
- 5.Johnson MR, Meyer KH, Haft J, Kinder D, Webber SA, Dyke DB. Heart transplantation in the United States, 1999–2008. Am J Transplant. 2010;10(4 Pt 2):1035–46. doi: 10.1111/j.1600-6143.2010.03042.x. [DOI] [PubMed] [Google Scholar]
- 6.Singh TP, Gauvreau K, Thiagarajan R, Blume ED, Piercey G, Almond CS. Racial and ethnic differences in mortality in children awaiting heart transplant in the United States. Am J Transplant. 2009;9(12):2808–15. doi: 10.1111/j.1600-6143.2009.02852.x. [DOI] [PMC free article] [PubMed] [Google Scholar]
- 7.Mah D, Singh TP, Thiagarajan RR, Gauvreau K, Piercey GE, Blume ED, et al. Incidence and risk factors for mortality in infants awaiting heart transplantation in the USA. J Heart Lung Transplant. 2009;28(12):1292–8. doi: 10.1016/j.healun.2009.06.013. [DOI] [PMC free article] [PubMed] [Google Scholar]
- 8.Vega JD. The change in heart allocation policy in the United States: is it working as designed? J Heart Lung Transplant. 2010;29(3):255–6. doi: 10.1016/j.healun.2009.09.016. [DOI] [PubMed] [Google Scholar]
- 9.Rosenthal D, Chrisant MR, Edens E, Mahony L, Canter C, Colan S, et al. International Society for Heart and Lung Transplantation: Practice guidelines for management of heart failure in children. J Heart Lung Transplant. 2004;23(12):1313–33. doi: 10.1016/j.healun.2004.03.018. [DOI] [PubMed] [Google Scholar]
- 10.Jeewa A, Manlhiot C, McCrindle BW, Van Arsdell G, Humpl T, Dipchand AI. Outcomes With Ventricular Assist Device Versus Extracorporeal Membrane Oxygenation as a Bridge to Pediatric Heart Transplantation. Artificial organs. 2010;34:1087–91. doi: 10.1111/j.1525-1594.2009.00969.x. [DOI] [PubMed] [Google Scholar]
- 11.Imamura M, Dossey AM, Prodhan P, Schmitz M, Frazier E, Dyamenahalli U, et al. Bridge to cardiac transplant in children: Berlin Heart versus extracorporeal membrane oxygenation. The Annals of thoracic surgery. 2009;87(6):1894–901. doi: 10.1016/j.athoracsur.2009.03.049. discussion 901. [DOI] [PubMed] [Google Scholar]
- 12.Magee JC, Bucuvalas JC, Farmer DG, Harmon WE, Hulbert-Shearon TE, Mendeloff EN. Pediatric transplantation. Am J Transplant. 2004;4 (Suppl 9):54–71. doi: 10.1111/j.1600-6143.2004.00398.x. [DOI] [PubMed] [Google Scholar]
- 13.Morales DL, Almond CS, Jaquiss RD, Rosenthal DN, Naftel DC, Massicotte MP, et al. Bridging children of all sizes to cardiac transplantation: the initial multicenter North American experience with the Berlin Heart EXCOR ventricular assist device. J Heart Lung Transplant. 2011;30(1):1–8. doi: 10.1016/j.healun.2010.08.033. [DOI] [PubMed] [Google Scholar]
- 14.Canter CE, Shaddy RE, Bernstein D, Hsu DT, Chrisant MR, Kirklin JK, et al. Indications for heart transplantation in pediatric heart disease: a scientific statement from the American Heart Association Council on Cardiovascular Disease in the Young; the Councils on Clinical Cardiology, Cardiovascular Nursing, and Cardiovascular Surgery and Anesthesia; and the Quality of Care and Outcomes Research Interdisciplinary Working Group. Circulation. 2007;115(5):658–76. doi: 10.1161/CIRCULATIONAHA.106.180449. [DOI] [PubMed] [Google Scholar]
- 15.Renlund DG, Taylor DO, Kfoury AG, Shaddy RS. New UNOS rules: historical background and implications for transplantation management. United Network for Organ Sharing. J Heart Lung Transplant. 1999;18(11):1065–70. doi: 10.1016/s1053-2498(99)00075-3. [DOI] [PubMed] [Google Scholar]
- 16.West LJ, Pollock-Barziv SM, Dipchand AI, Lee KJ, Cardella CJ, Benson LN, et al. ABO-incompatible heart transplantation in infants. The New England journal of medicine. 2001;344(11):793–800. doi: 10.1056/NEJM200103153441102. [DOI] [PubMed] [Google Scholar]
- 17.Dipchand AI, Pollock BarZiv SM, Manlhiot C, West LJ, VanderVliet M, McCrindle BW. Equivalent outcomes for pediatric heart transplantation recipients: ABO-blood group incompatible versus ABO-compatible. Am J Transplant. 2010;10(2):389–97. doi: 10.1111/j.1600-6143.2009.02934.x. [DOI] [PubMed] [Google Scholar]
- 18.West LJ, Karamlou T, Dipchand AI, Pollock-BarZiv SM, Coles JG, McCrindle BW. Impact on outcomes after listing and transplantation, of a strategy to accept ABO blood group-incompatible donor hearts for neonates and infants. The Journal of thoracic and cardiovascular surgery. 2006;131(2):455–61. doi: 10.1016/j.jtcvs.2005.09.048. [DOI] [PubMed] [Google Scholar]
- 19.Almond CS, Gauvreau K, Thiagarajan RR, Piercey GE, Blume ED, Smoot LB, et al. Impact of ABO-incompatible listing on wait-list outcomes among infants listed for heart transplantation in the United States: a propensity analysis. Circulation. 2010;121(17):1926–33. doi: 10.1161/CIRCULATIONAHA.109.885756. [DOI] [PMC free article] [PubMed] [Google Scholar]
- 20.Singh TP, Almond CS, Gauvreau K. Improved survival in pediatric heart transplant recipients: have white, black and Hispanic children benefited equally? Am J Transplant. 2011;11(1):120–8. doi: 10.1111/j.1600-6143.2010.03357.x. [DOI] [PMC free article] [PubMed] [Google Scholar]
Associated Data
This section collects any data citations, data availability statements, or supplementary materials included in this article.


