

Abstract
Aims
Significant alterations in the pharmacokinetics (PK) of antimicrobials have been reported in critically ill patients. We describe PK parameters of imipenem in intensive care unit (ICU) patients with suspected ventilator-associated pneumonia and evaluate several dosage regimens.
Methods
This French multicentre, prospective, open-label study was conducted in ICU patients with a presumptive diagnosis of ventilator-associated pneumonia caused by Gram-negative bacilli, who empirically received imipenem intravenously every 8 h. Plasma imipenem concentrations were measured during the fourth imipenem infusion using six samples (trough, 0.5, 1, 2, 5 and 8 h). Data were analysed with a population approach using the stochastic approximation expectation maximization algorithm in Monolix 4.2. A Monte Carlo simulation was performed to evaluate the following six dosage regimens: 500, 750 or 1000 mg with administration every 6 or 8 h. The pharmacodynamic target was defined as the probability of achieving a fractional time above the minimal inhibitory concentration (MIC) of >40%.
Results
Fifty-one patients were included in the PK analysis. Imipenem concentration data were best described by a two-compartment model with three covariates (creatinine clearance, total bodyweight and serum albumin). Estimated clearance (between-subject variability) was 13.2 l h−1 (38%) and estimated central volume 20.4 l (31%). At an MIC of 4 μg ml−1, the probability of achieving 40% fractional time > MIC was 91.8% for 0.5 h infusions of 750 mg every 6 h, 86.0% for 1000 mg every 8 h and 96.9% for 1000 mg every 6 h.
Conclusions
This population PK model accurately estimated imipenem concentrations in ICU patients. The simulation showed that for these patients, the best dosage regimen of imipenem is 750 mg every 6 h and not 1000 mg every 8 h.
Keywords: critical care, imipenem, population pharmacokinetics, ventilator-associated pneumonia
What is Already Known about this Subject
In critically ill patients, there are significant alterations in pharmacokinetics (PK) of antimicrobials associated at bacteria with a high minimum inhibitory concentration (MIC).
The pharmacodynamic target for imipenem, widely used in this specific population, is based on time over the MIC, but few data are available for imipenem PK in these patients, and dosage regimens have not been evaluated.
What this Study Adds
Using a PK population approach, our study showed, in critically ill patients, a slightly increased clearance and 2-fold increase in the volume of distribution of imipenem, in comparison to healthy patients.
We also demonstrated that for bacteria with MICs of 2–4 μg ml−1, a dosage regimen of 750 mg every 6 h resulted in a 40% fractional time over the MIC.
Introduction
Imipenem was the first licensed antibiotic of the carbapenem class and has been widely used for >30 years, for hospital-related infections caused by resistant Gram-negative bacilli. Due to its broad spectrum, imipenem is often prescribed for initial empirical treatment of ventilator-associated pneumonia (VAP) in critically ill patients with risk factors for multidrug-resistant Gram-negative bacilli [1,2]. It is a hydrophilic molecule characterized by a half-life (t1/2) of 1 h, low plasma protein binding (<20%) and a predominantly renal excretion close to 70% [3,4]. In healthy subjects, the clearance is 12.1 l h−1 and the volume of distribution (Vd) of the central compartment is 9.6 l after 1000 mg every 8 h (q8h) with 0.5 h infusion [5]. Imipenem has a time-dependent bactericidal activity, and the pharmacodynamic (PD) parameter associated with its bactericidal effect is the fractional time (fT) during which the concentration is above the minimal inhibitory concentration (MIC). Imipenem has a postantibiotic effect of 2–6 h against most Gram-negative bacilli. Antimicrobial activity is optimized when the fraction of time above the MIC (fT > MIC) is >40% [6,7], but for critically ill patients some studies suggest an optimal fT > MIC of 100% [8,9].
In critically ill patients, the pharmacokinetic (PK) properties of drugs are modified, with an increase in Vd, fluctuation of plasma clearance, presence of oedema and drug–drug interaction [10–13], resulting in a lower or greater drug exposure.
In addition to changes in the PK characteristics of intensive care unit (ICU) patients, there is a worrisome increase in the incidence of multiresistant Gram-negative bacilli, especially in the ICU. In this context, dosage regimens of antibiotics used in the ICU must be adapted. Currently, clinicians tend to increase the doses of antibiotics or change the dosage schedule without customizing antibiotic regimens according to the host and the offending pathogen.
Although imipenem is widely used in critically ill patients, data allowing optimization of its administration are surprisingly scarce. Published PK studies with data in these patients are either of imperfect design [14] or have a low number of subjects [15–19]. Among these studies, three have specifically analysed imipenem PK variability in ICU patients with VAP.
Some authors have evaluated several dosage regimens of antimicrobials in critically ill patients. For aminoglycoside antibiotics, Conil et al. [20] showed the impact of adapting the regimen on PD targets (80 < area under the concentration–time curve < 125 mg l−1 h and peak >10 mg l−1) after simulated dosage regimens in ICU patients with nosocomial infections. For meropenem, an antibiotic of the same class as imipenem, Crandon et al. [21] evaluated the concentration–time profile in ICU patients with VAP in order to limit the potential inadequacies noted for current dosage regimens.
The aim of our study was to estimate the PK parameters of imipenem and their variability in ICU patients with suspected VAP, using a population approach to determine the influence of clinical and biological covariates for imipenem. We performed a Monte Carlo simulation to evaluate several dosage regimens based on the PD parameter (fT > MIC) for the range of clinical relevant MICs in ICU patients.
Methods
Study design and population
IMPACT study, a multicentre, prospective, open-label trial, was conducted in three ICUs of two French hospitals (Hôpital V Dupouy, polyvalent ICU, Argenteuil, France; and AP-HP, Hôpital Bichat, medical ICU and surgical ICU, Paris, France). All patients, empirically receiving imipenem intravenously for a presumptive diagnosis of VAP due to Gram-negative bacilli, were screened from 2008 to 2010. Inclusion criteria were as follows: (i) male or female over 18 years of age; (ii) use of mechanical ventilation for >48 h; (iii) clinical suspicion of VAP [1] (new or persistent radiological infiltrate and one of the following criteria: purulent tracheal aspiration or temperature ≥38.3°C or leucocytosis >10 000 ml−1); and (iv) VAP with high risk of multiresistant bacteria [1] (at least 6 days of mechanical ventilation or antibiotic treatment within 15 days). Exclusion criteria were as follows: (i) time between diagnosis and first antibiotic therapy ≥24 h; (ii) expected death within 48 h; and (iii) creatinine clearance <10 ml min−1 or renal replacement therapy.
At inclusion, all patients were treated with a single infusion of amikacin (20 mg kg−1) and imipenem every 8 h (q8h; 500–1000 mg) administered as 0.5 h infusions. The imipenem dose was defined by the protocol previously established according to the creatinine clearance estimated by Cockcroft-Gault (ClCG) of each patient at inclusion, as recommended by the European Medicine Agency (ClCG >70 ml min−1 (1.73 m)−2, 1000 mg q8h; ClCG >30 and ≤70 ml min−1 (1.73 m)−2, 750 mg q8h; and ClCG ≤30 ml min−1 (1.73 m)−2, 500 mg q8h).
The study was conducted in accordance with good clinical practice and was approved by the ethics committee (Comité de Protection des Personnes Ile de France I). All patients or their legal representative signed an informed consent form.
Clinical Trial Registration: http://www.clinicaltrials.gov; unique identifier: NCT00950222.
Sampling procedure and analytical methods
Imipenem concentrations were measured at steady state after the fourth dose, i.e. between 24 and 32 h after the first infusion of imipenem. Six blood samples per patient were collected immediately before and at 0.5, 1, 2, 5 and 8 h after the fourth infusion for concentration measurement.
Blood samples were retrieved from 4 ml of heparin and immediately centrifuged at 5000 g during 5 min. Plasma was then stabilized within 0.5 h after collection, by 4-morpholine propane sulphonic acid (MOPS) in ethylene glycol, and immediately frozen at −80°C. Plasma imipenem concentrations were determined after processing the samples by ultrafiltration, using high-performance liquid chromatography on an Interchrome© YP5C18 25QS reverse phase column (length 25 cm, internal diameter 4.6 cm). Ultraviolet detection was performed at 302 nm [22]. Chromatographic peaks were integrated and imipenem concentrations calculated using Empower 2 software Water® (https//www.waters.com). The lower limit of quantification was 0.5 mg l−1.
Analysis of blood samples was centralized in the pharmacology–toxicology laboratory of the Hôpital Bichat, AP-HP, Paris, France.
Population pharmacokinetic model building
Population PK analysis was performed using Monolix 4.1.2 software (http://www.lixoft.eu). Population PK parameters were estimated by maximum likelihood using the stochastic approximation expectation maximization (SAEM) algorithm [23]. The SAEM algorithm is an expectation maximization (EM) algorithm extension in the nonlinear mixed-effects models, where the parameter estimation was computed by the maximum likelihood estimator of the parameters without any approximation of the model as linearization. Briefly, SAEM converges to maximum likelihood estimates by repeatedly alternating between the E and M steps. The expectation of the complete likelihood is then computed according to a stochastic approximation [24].
The full maximum likelihood estimation allows the data below the limit of quantification (BQL) to be taken into account [25]. The BQL data are considered as left-censored observations, in which case the individual concentration data are not observed, but we only know that they are below the lower limit of quantification. The extension of the SAEM algorithm in Monolix to consider BQL realized a simulation of the left-censored data in a right-truncated Gaussian distribution with an integration below the limit of quantification to obtain the probability of BQL. It is very similar to the method call ‘M3’ in nonmem for handling BQL data [26].
Structural and statistical model
In the first step, a basic population PK model without covariates was developed. For the structural PK model, one- and two-compartment models were compared. Exponential random effects were assumed to describe between-subject variability. For example, for clearance (CL) of subject i,  where CLpop is the population parameter estimate and ηCL,i is the individual random effect. The random effects were first supposed to be independent with diagonal variance–covariance matrix Ω, and possible correlations between random effects were then tested in this variance–covariance matrix. Additive, proportional and combined error models were tested. The most appropriate pharmacostatistical model was selected on the basis of the following criteria: (i) smaller value of Bayesian information criterion (BIC); (ii) adequate goodness-of-fit plots; and (iii) low relative standard error (RSE) in estimated PK parameters.
Covariate analysis
From the basic model, 12 covariates were studied and chosen for their impact on the PK parameters specifically in the ICU, in accordance with published data. These 12 covariates were as follows: age; gender; total bodyweight at inclusion and total bodyweight change (between the 4th dose and admission); three specific ICU scores, namely SAPS II [27], the SOFA score [28] and the oedema score (ES) [29]; serum albumin and 4 h creatinine clearance (CrCL4h) [30]; positive end-expiratory pressure (PEEP); arterial partial pressure of oxygen/fractional inspired oxygen ( ) ratio; and the presence of septic shock. These covariates were recorded at the fourth dose of imipenem, except for SAPS II and weight, which were measured both at admission and at inclusion. Urine samples for CrCL4h were collected when the fourth infusion of imipenem had started. Measurement of creatinine clearance over 4 h was assumed to be a true reflection of renal function during the fourth infusion [31,32]. Missing values for tested covariates were imputed to the median value observed in the analysis population.
The parameter–covariate relationships were modelled multiplicatively as follows (e.g. for imipenem clearance): for continuous covariates,  , where β is the covariate effect to be estimated, COVi is the value for subject i, COVmedian is the median value of covariates; and for binary covariates,
  , where COVi takes a value of 0 or 1. For all covariates, binary or continuous, the unit of β is the logarithm of the unit of the associated parameter.
Covariates were selected with a forward method using the BIC [33]. First, a model with one covariate was selected with the smallest BIC. Then, a model with two covariates was selected in a similar manner. The addition of covariates was stopped when no further decrease of BIC was obtained. The covariates model was finalized with a backward selection, removing covariates one by one, using the likelihood ratio test (LRT). A covariate was retained in the model if the LRT was significant (P < 0.05) when it was removed from the full model. In the final model, the 95% confidence interval of each parameter was determined from 1000 nonparametric bootstraps based on resampling [34].
Model evaluation
Evaluation of the model was based on goodness-of-fit plots. The model was first evaluated using observations vs. individual and population prediction plots and usual residual-based plots [individual weighted residuals (IWRES) plot and population weighted residuals (PWRES) plot]. It was then assessed using simulation-based plots [visual predictive check (VPC) plot and normalized prediction distribution error (NPDE) vs. time]. The VPC plot showed the 10th, 50th and 90th percentiles of observed data over time and their corresponding 90% prediction intervals calculated from 500 Monte Carlo samples (simulated using the model, the parameter estimates and the design of the data set). The NPDE was built from the percentile derived from VPC prediction. The plot of NPDE takes into account the full predictive distribution of each individual observation and the various imipenem doses. Given that only a few patients had different doses of imipenem and that we plotted NPDE, we did not perform a prediction-corrected VPC [35].
Model evaluation was performed for both the basic model and the final model with covariates.
Monte Carlo simulation for evaluation of dosage regimen
A Monte Carlo simulation was performed using the final PK model with covariates to predict the distribution of plasma imipenem concentrations and to estimate the PD parameter fT > MIC for several current dosage regimens and various MIC values. Six usual dosage regimens were studied, as follows: 500, 750 and 1000 mg with administration every 6 (q6h) or every 8 h (q8h). We simulated 1000 patients with a set of covariates resampled among the observed covariates of included patients and a vector of random effects drawn from the estimated distribution. The concentration–time profile of the 1000 virtual patients was simulated at steady state for the six dosage regimens.
The MIC targets were selected from the European Committee on Antimicrobial Susceptibility Testing (EUCAST [36]) data and ranged from 0.06 to 32 μg ml−1. Two specific MICs, 2 and 4 μg ml−1, were studied. These MICs were the limited sensitivity breakpoint of imipenem currently observed for Gram-negative bacilli isolated in the ICU (Enterobacteriaceae species and Pseudomonas aeruginosa, respectively).
The time for which the imipenem concentration remained above the MIC at steady state was calculated as a cumulative percentage over a 24 h period, and the probability of pharmacodynamic target attainment (PTA) was assessed as a fraction that achieved 40% fT > MIC or 100% fT > MIC.
Results
Patients
Sixty-three patients were included in the IMPACT study. Twelve patients were excluded from the PK analysis; three patients lacked a kinetic profile and nine patients did not receive four doses of imipenem. Fifty-one patients were included in the PK analysis, 41 of whom were males (80%), ranging in age from 28 to 84 years (median 60 years). At inclusion, the median total bodyweight was 77 kg (range [45–126]). All patient characteristics are summarized in Table 1. Reasons for admission to the ICU were medical in 40 patients (78%) and surgical for 11 patients (22%), and the SAPS II at admission was 43 [17–80]. The median duration of stay in the ICU and of mechanical ventilation before inclusion was 8 [1–60] and 8 days [5–60], respectively. Antibiotic therapy was prescribed to 48 patients (94%) in the 3 months before admission, including 11 patients (30%) who had received imipenem previously.
Table 1.
Characteristics at inclusion or at time of PK sample collection (fourth dose) of the 51 ICU patients included in the PK analysis
| Parameters | Value* |
|---|---|
| At inclusion | |
| Male | 41 (80%) |
| Age (years) | 60 [28–84] |
| Total bodyweight (kg) | 77 [45–126] |
| SAPS II | 40 [19–74] |
| At time of fourth dose | |
| Weight change (kg)† | 1.1 [−18.1–19.1] |
| SOFA | 6 [2–14] |
| Oedema score | 7 [0–18] |
| Serum albumin (g l−1)‡ | 18 [10–28] |
| CrCL4h (ml min−1) | 86.4 [9.1–571.4] |
| Shock | 18 (35%) |
| PEEP (cmH2O) | 6 [0–13] |

|
182 [81–346] |
Abbreviations are as follows: ICU, intensive care unit; PEEP, positive end-expiratory pressure; PK, pharmacokinetics.
Values are expressed as median [min–max] or number (percentage).
Between the fourth dose and admission.
Median value for nine patients.
Four patients (9%) received 500 mg of imipenem, 15 (29%) 750 mg and 32 (62%) 1000 mg with the same dose interval, q8h.
Population pharmacokinetic analysis
A total of 297 samples were available for PK modelling, with a median of six samples [3–6] per individual (Figure 1). Imipenem concentrations at peak (0.5 h) and trough were 34.1 [12.3–67.5] and 1.9 mg l−1 [0.5–10.1], respectively. Nine per cent of imipenem concentrations were BQL. One patient received the fourth dose 5 h late.
Figure 1.
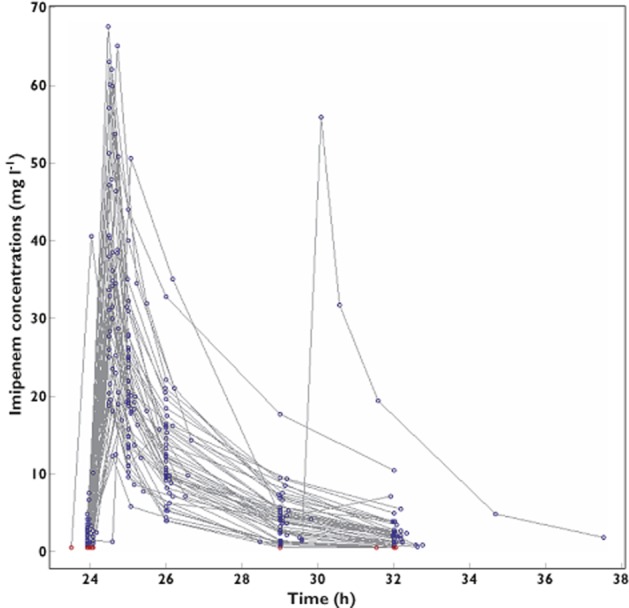
Spaghetti plot of imipenem concentrations vs. time following four doses for the 51 intensive care unit patients included in the analysis. Data above the limit of quantification are presented as open blues circles, data below the limit of quantification (BQL) as open red circles at the limit of quantification
Imipenem PK concentrations were best described by a two-compartment model. An exponential random effects model described the between-subject variability in clearance and volume of distribution of the central compartment, V1. Since the variability of intercompartmental clearance (Q) and the volume of distribution of the peripheral compartment (V2) were very low, the between-subject variability was not estimated and was taken as zero. A proportional model was used to describe the residual variability.
As shown in Table 2, estimated imipenem CL was 13 l h−1, Q 10.1 l h−1 and the volumes V1 and V2 were 22.4 and 9.9 l, respectively. A correlation between CL and V1 was retained in the basic model and estimated as 0.48. The goodness-of-fit plots of the basic model were satisfactory (plots not shown).
Table 2.
Population PK parameters of imipenem in 51 ICU patients
| Basic model | Final model | ||||||
|---|---|---|---|---|---|---|---|
| Value | RSE (%) | Value | RSE (%) | P value* | Median of bootstrap† | 95% Confidence interval of bootstrap† | |
| Fixed effects | |||||||
| CL (l h−1) | 13.0 | 6 | 13.2 | 5 | – | 13.2 | 11.4–15.3 |
| βCrCL4h (log l h−1) | – | – | 0.2 | 19 | 6.4 × 10⁻⁵ | 0.25 | 0.1–0.4 |
| V1 (l) | 22.4 | 9 | 20.4 | 7 | – | 19.8 | 14.9–25.4 |
| βWeight (log l) | – | – | 1.3 | 17 | 1.3 × 10⁻⁴ | 1.2 | 0.6–2.2 |
| βSerum albumin (log l) | – | – | −1.1 | 18 | 1.8 × 10⁻⁴ | −1.0 | −1.8 to −0.5 |
| Q (l h−1) | 10.1 | 28 | 12.2 | 25 | – | 12.3 | 4.7–20.3 |
| V2 (l) | 9.9 | 14 | 9.8 | 13 | – | 10.5 | 6.9–13.7 |
| Between-subject variability | |||||||
| ωCL (%) | 48 | 10 | 38 | 13 | – | 36 | 26–49 |
| ωV1 (%) | 48 | 15 | 31 | 18 | – | 22 | 1–45 |
| Correlation | – | ||||||

|
0.48 | 29 | 0.51 | 28 | – | 0.79 | −1 to 1 |
| Residual variability | |||||||
| σ (%) | 33 | 4 | 33 | 3 | – | 34 | 26–41 |
| BIC | 1595 | – | 1560 | – | – | – | – |
Abbreviations are as follows: BIC, Bayesian information criterion; ICU, intensive care unit; PK, pharmacokinetics; RSE, relative standard error.
Likelihood ratio test;
from 1000 bootstrap resampling.
Final population PK covariate model is as follows: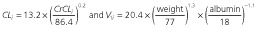 .
.
Model with covariates
The best model with one covariate included the effect of 4 h creatinine clearance (CrCL4h) on CL. Covariate selection was continued up to a model with four covariates; the model with five covariates had a larger BIC (Table 3).
Table 3.
Summary of covariates model building
| Model | Number of covariates | −2LL | BIC | ΔBIC |
|---|---|---|---|---|
| Basic model | 0 | 1563 | 1595 | – |
| CrCL on CL | 1 | 1541 | 1577 | −18 |
| CrCL and age on CL | 2 | 1536 | 1573 | −22 |
| CrCL and age on CL, Weight on V1 | 3 | 1527 | 1571 | −24 |
| CrCL and age on CL, Weight and Alb on V1 | 4 | 1510 | 1557 | −38 |
| CrCL and age on CL, Weight, Alb and ES on V1 | 5 | 1508 | 1559 | −36 |
Abbreviations are as follows: Alb, serum albumin; −2LL = −2 × log likelihood; ΔBIC = BIC (model step) – BIC (basic model); BIC, Bayesian information criterion; ES, edema score.
The backward selection was then performed from the model with the four following covariates: CrCL4h; age; serum albumin; and total bodyweight. Only the following three covariates were significant using the LRT and were retained in the final model: CrCL4h on CL; serum albumin (imputed to median value for eight patients with missing data); and total bodyweight on V1. Imipenem CL was found to increase with CrCL4h. The volume V1 was found to increase with total bodyweight and decrease with serum albumin (Figure 2).
Figure 2.
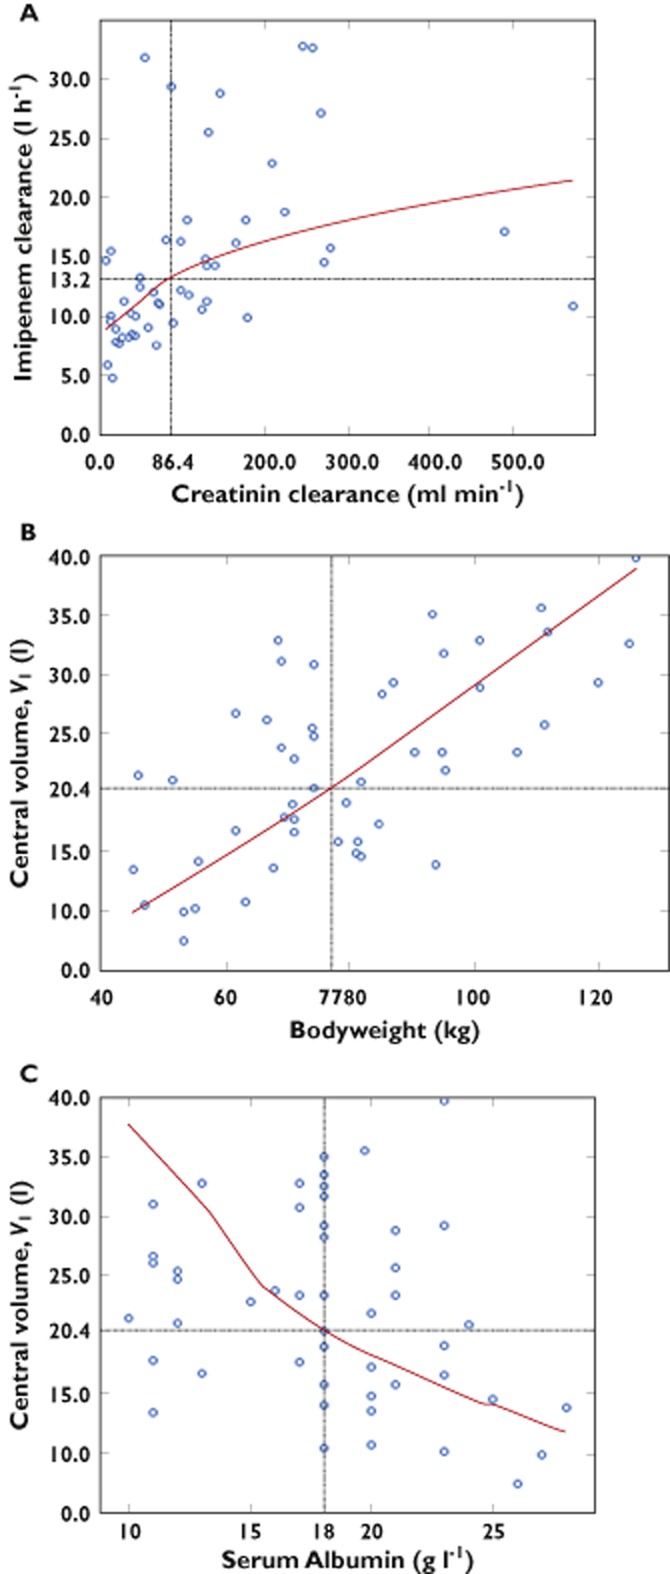
Relationship between estimated individual pharmacokinetic parameters and covariates. (A) Clearance vs. 4 h creatinine clearance. (B) Central volume vs. total bodyweight. (C) Central volume vs. serum albumin. In each panel, model predictions are displayed as the red curve
The introduction of CrCL4h alone reduced the variability of CL (ωCL) from 48 to 38%. The introduction of bodyweight and serum albumin reduced the variability of V1 from 48 to 31%. The final PK parameters are summarized in Table 2. All were reliably estimated, as reflected by the small RSEs from observed Fisher information matrix. The results of bootstrap medians and 95% confidence intervals were consistent, except for the between-subject variability ωV1 and the correlation. Nevertheless, the bootstrap analysis confirmed the reliability and robustness of the parameter estimates, and thus, the final model with covariates was representive. Estimated parameters were similar in the analysis of the 43 patients with no missing albumin data (results not shown).
Model evaluation
The goodness-of-fit plots of the final PK model with covariates are shown in Figures 3 and 4. The model adequately described the observations, as shown by the plots of observations vs. population and individual predictions, with the exception of the highest concentrations. Moreover, the NPDE plot vs. predictions and the IWRES show no trend. The VPC plot and the NPDE plot presented in Figure 4 as a function of time from first dose indicate a good predictive performance of the model.
Figure 3.

Goodness-of-fit plots for the final model with covariates: observations (A) and population weighted residuals (PWRES; B) vs. population predicted values; and observations (C) and individual weighted residuals (IWRES; D) vs. individual predicted values. Observations are plotted as blue circles and BQL data as red circles. Locally weighted scatterplot smoothed curves are plotted as blue curves
Figure 4.
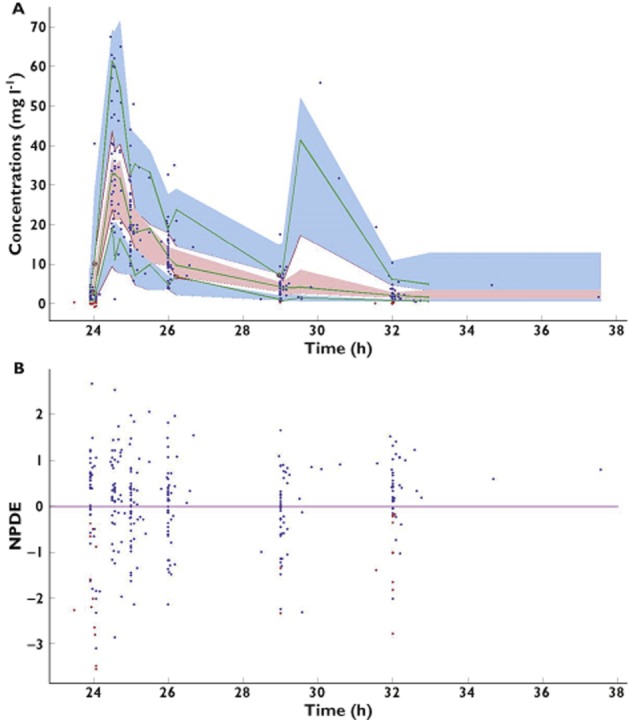
Visual predictive check (A) and normalized prediction distribution error (NPDE; B) vs. time since first dose for the final model. Visual predictive check details are as follows: the continuous green lines indicate the 10th, 50th and 90th percentiles for observed data; the shaded blue and pink areas represent 90% prediction intervals from the corresponding percentiles calculated from simulated data. Observations are plotted as blue circles and BQL data as red circles
Monte Carlo simulation for dosage regimen evaluation
Using the simulated concentration–time profiles at steady state, the PTA (40 or 100% fT > MIC) was calculated for the current dosage regimens 500, 750 and 1000 mg q6h or q8h. As shown in Figure 5A, all simulated patients had an fT > MIC of >40% for MIC from 0.06 to 1 μg ml−1 for the six dosage regimens. For MIC = 2 μg ml−1, 86% of patients had the PTA at 40% with 500 mg q8h and 96.9% with 500 mg q6h; 95.3% with 750 mg q8h and 99.1% with 750 mg q6h; and 97.9% with 1000 mg q8h and 99.4% with 1000 mg q6h. Figure 5B shows the probability of fT > MIC >100% with the six different dosage regimens. The percentage of patients was higher with the q6h regimen than with the q8h regimen, whatever the dose. For MIC = 4 μg ml−1, 5% of simulated patients had the PTA at 100% with 500 mg q8h and 18.7% with 500 mg q6h; 14.3% with 750 mg q8h and 32.5% with 750 mg q6h; and 20.9% with 1000 mg q8h and 45% with 1000 mg q6h.
Figure 5.
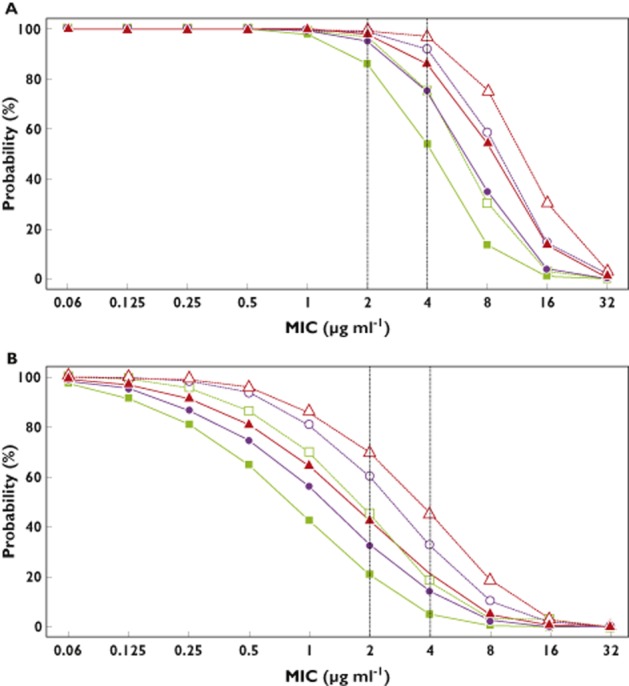
Simulated probabilities of pharmacodynamic target attainment vs. minimal inhibitory concentration (MIC) for various imipenem current dosage regimens at steady state: 40% fractional time (fT) > MIC (A) and 100% fT > MIC (B). Vertical dotted lines are displayed for MIC = 2 μg ml−1 and MIC = 4 μg ml−1, which are the thresholds currently observed for Gram-negative bacteria in the intensive care unit.  , 500 mg every 8 h (q8h);
  , 500 mg every 6 h (q6h);
  , 750 mg q8h;
  , 750 mg q6h;
  , 1000 mg q8h;
  , 1000 mg q6h
These results were confirmed by the simulated median concentration–time profile after four doses of imipenem (study protocol), as shown in Figure 6. The median patient with the 1000 mg q8h regimen did not achieve the PD target of MIC = 2 μg ml−1. The median patient with 750 or 1000 mg q6h achieved the PD target of MIC = 2 μg ml−1, but not for MIC = 4 μg ml−1.
Figure 6.
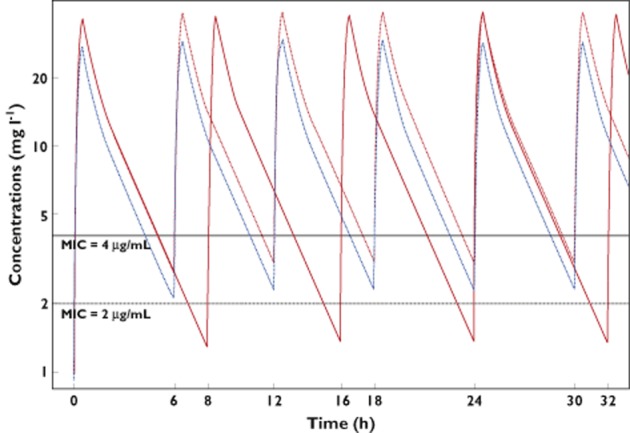
Predicted concentrations of imipenem for median value of parameters for 1000 mg q8h ( ) or 1000 mg q6h (
 ) or 750 mg q6h (
 )
)
We also explored the impact of each of the three significant covariates, namely CrCL4h, total bodyweight and serum albumin, on PTA. In Table S1, we computed the PTA for the dose of 1000 mg q8h (the dosage regimen of the protocol) and 750 mg q6h (same daily dose) for three percentiles of each covariate (10th, 50th and 90th), assuming the two remaining covariates were at their median value. For both dosing regimens, 40% fT > MIC was obtained for the target MICs 2 and 4 μg ml−1 for all values of the covariates. Figure S1 shows the concentration profile at steady state for 750 mg q6h for the various covariate values. It illustrates the rather limited impact of covariates on fT > MIC for that dosage regimen.
Discussion
We studied the pharmacokinetics of imipenem after intravenous infusion in 51 critically ill patients hospitalized in an ICU with suspected Gram-negative VAP, using a population approach. We found that imipenem concentrations were best described by a two-compartment model, in accordance with previously published studies [14,17,18]. The strength of our study is the number of patients, with prospective collection of kinetic profiles with six points and a central laboratory for concentration assessment. To the best of our knowledge, the present study is the first study of imipenem PK using a population approach in the ICU.
In the population PK study performed by Lee et al. [5] in healthy subjects, estimated imipenem clearance was 12.1 l h−1 and estimated central volume was 9.7 l. In ICU patients, we found a very similar clearance. The volume of distribution was estimated to be 20.4 l in the final model, which is 2-fold higher than that described in a healthy population. This increase is consistent with the clinical status of ICU patients. Indeed, the inflammatory response in sepsis leads to an increased capillary permeability, with fluid flow to the extracellular compartment (development of oedema). McKindley et al. [15] reported an increased volume of distribution in ICU patients with VAP. Likewise, Novelli et al. [17] enhanced the impact of sepsis on the volume of distribution with a new compartment, the third compartment for critically ill patients with sepsis.
For covariate selection, we used a standard stepwise approach rather than a more modern approach (such as the lasso method associated with cross-validation [37]). Results of the selection steps were very consistent with our rich pharmacokinetic design. Of the 12 covariates studied, we found that CrCL4h, total bodyweight and serum albumin have a significant impact on the PK variability of imipenem. The addition of these three covariates reduces the variability of imipenem clearance and central Vd, with a decrease of 10% for CL and 17% for V1. A recent study by Yoshizawa et al. [38] also showed the impact of creatinine clearance on imipenem clearance in patients with altered renal function. The other covariates tested, namely age and bodyweight, were not retained in their model. Estimates of pharmacokinetic parameters CL and V1 were 8 l h−1 and 11.4 l, respectively, with a median CrCL = 54.1 ml min−1, and were lower than those estimated in our population. In our study, we observed high values of creatinine clearance. These high values are consistent with the hyperdynamic state of sepsis patients and confirmed the physiological impact on the PK parameters [39]. It is therefore necessary to control this creatinine clearance parameter regularly in the ICU to limit an effect on the clearance of imipenem, although this effect was limited in our final PK model (Figure S1). A similar process of recorded creatinine clearance was previously described by Belzberg et al. [14] during 2 h, with a maximal value of 408 ml min−1. In accordance with our study, they did not find an influence of creatinine clearance on imipenem clearance but an increase in the volume of distribution.
The hydrophilic nature of imipenem makes it sensitive to changes in the distribution of body fluids. Its volume of distribution is affected by all disorders resulting in an increase of the extracellular compartment, such as sepsis or those conditions clinically revealed by oedema. In our study, we did not find any effect of oedema on the volume of distribution of imipenem in the PK model, but total bodyweight and serum albumin were found to influence the distribution of imipenem significantly, and this probably reflected the physiological characteristics encountered in the ICU. The same increase of central volume was also observed for another antibiotic class, the aminoglycosides. Tanigawara et al. [40] showed a significant increase of the volume of distribution in a comparative study between healthy subjects and patients with pneumonia or sepsis treated by arbekacin hydrophilic and low-protein-binding antibacterial agents, such as imipenem. For the results shown in Figure 2 and the total bodyweight estimate coefficient, we evaluated the volume with a coefficient of total bodyweight fixed to one. The volumes expressed as litres per kilogram were very similar between the final model and the total bodyweight coefficient model; 0.26 and 0.27 l kg−1, respectively. Owing to the hydrophilic properties of this antibacterial agent, we wished to evaluate other weight metrics (such as ideal bodyweight or lean bodyweight), but unfortunately, these parameters could not be collected during patient monitoring. No other covariates, especially ICU scores, were found in the PK model and considered for determination of the dosage regimen of imipenem.
With the PK results, we also performed a Monte Carlo simulation to evaluate several dosage regimens with doses given q6h or q8h. In the context of suspected VAP due to Gram-negative bacilli, we focused our simulations on the target MICs of 2 and 4 μg ml−1 (sensitivity breakpoint of Enterobacteriaceae species and Pseudomonas aeruginosa, respectively). With the same daily dose of 3 g, a q6h infusion led to a PD objective of >40% fT > MIC for those two target MICs. Despite their impact on the variability of PK parameters, the covariates lead to rather small changes in PK parameters and concentration profiles and thus have a limited effect on PTA, and we show rather small changes in the PTA 40% fT > MIC. Our evaluation of the 3 g daily dose has confirmed that q6h is a good dosage regimen for use in the ICU. This dosage did not exceed the threshold of toxicity, and the q6h regimen was optimized to take into account the higher PK variability seen in critically ill patients.
Conclusion
Our results demonstrate that imipenem pharmacokinetics varies in ICU patients. Imipenem clearance (CL) and central volume (V1) were best estimated with three covariates, whose influence on pharmacokinetic estimates was limited. Using population pharmacokinetic parameters, we showed that an infusion 750 mg q6h dosage regimen (3 g daily dose) is needed to achieve adequate pharmacodynamics, i.e. a fraction of time above MIC of >40% for usual the MICs of 2 and 4 μg ml−1.
Competing Interests
All authors have completed the Unified Competing Interest form at http://www.icmje.org/coi_disclosure.pdf (available on request from the corresponding author) and declare: no support from any organization for the submitted work; no financial relationships with any organizations that might have an interest in the submitted work in the previous 3 years; no other relationships or activities that could appear to have influenced the submitted work.
This study was funded by the Contrat d'Initiation à la Recherche Clinique 2006 (Assistance Publique-Hôpitaux de Paris, Département de la Recherche Clinique et du Développement, CRC 06049).
Supporting Information
Additional Supporting Information may be found in the online version of this article at the publisher's web-site:
Predicted steady–state concentrations of imipenem for 750 mg q6h dosage regimen with percentile values (10th, 50th and 90th) of the three significant covariates: with (a) creatinine clearance percentiles: 10th = 17 ml min–1; 50th = 86.4 ml min–1; 90th = 258 ml min–1; (b) body weight: 10th = 53 kg; 50th = 77 kg; 90th = 111 kg; (c) serum albumin: 10th = 11 g l–1; 50th = 18 g l–1; 90th = 23 g l–1. Vertical lines are displayed for MIC = 2 μg ml–1 and MIC = 4 μg ml–1
Expected fractional time above MIC (fT > MIC) for two target MICs 2 and 4 μg ml−1 for 1000 mg q8h and 750 mg q6h dosage regimen and population parameters for the 10th, 50th and 90th percentiles of the three significant covariates
References
- 1.American Thoracic Society, Infectious Diseases Society of America. Guidelines for the management of adults with hospital-acquired, ventilator-associated, and healthcare-associated pneumonia. Am J Respir Crit Care Med. 2005;171:388–416. doi: 10.1164/rccm.200405-644ST. [DOI] [PubMed] [Google Scholar]
- 2.Joseph J, Rodvold KA. The role of carbapenems in the treatment of severe nosocomial respiratory tract infections. Expert Opin Pharmacother. 2008;9:561–575. doi: 10.1517/14656566.9.4.561. [DOI] [PubMed] [Google Scholar]
- 3.Balfour JA, Bryson HM, Brogden RN. Imipenem/cilastatin: an update of its antibacterial activity, pharmacokinetics and therapeutic efficacy in the treatment of serious infections. Drugs. 1996;51:99–136. doi: 10.2165/00003495-199651010-00008. [DOI] [PubMed] [Google Scholar]
- 4.Wolff M, Joly-Guillou M, Pajot O. Les carbapénèmes. Réanimation. 2009;18(Suppl. 2):S199–208. [Google Scholar]
- 5.Lee LS, Kinzig-Schippers M, Nafziger AN, Ma L, Sörgel F, Jones RN, Drusano GL, Bertino JS. Comparison of 30-min and 3-h infusion regimens for imipenem/cilastatin and for meropenem evaluated by Monte Carlo simulation. Diagn Microbiol Infect Dis. 2010;68:251–258. doi: 10.1016/j.diagmicrobio.2010.06.012. [DOI] [PubMed] [Google Scholar]
- 6.Rodloff AC, Goldstein EJC, Torres A. Two decades of imipenem therapy. J Antimicrob Chemother. 2006;58:916–929. doi: 10.1093/jac/dkl354. [DOI] [PubMed] [Google Scholar]
- 7.Mouton JW, Touzw DJ, Horrevorts AM, Vinks AA. Comparative pharmacokinetics of the carbapenems: clinical implications. Clin Pharmacokinet. 2000;39:185–201. doi: 10.2165/00003088-200039030-00002. [DOI] [PubMed] [Google Scholar]
- 8.Craig WA. Pharmacokinetic/pharmacodynamic parameters: rationale for antibacterial dosing of mice and men. Clin Infect Dis. 1998;26:1–10. doi: 10.1086/516284. [DOI] [PubMed] [Google Scholar]
- 9.Zelenitsky SA, Ariano RE, Zhanel GG. Pharmacodynamics of empirical antibiotic monotherapies for an intensive care unit (ICU) population based on Canadian surveillance data. J Antimicrob Chemother. 2011;66:343–349. doi: 10.1093/jac/dkq348. [DOI] [PubMed] [Google Scholar]
- 10.Roberts JA, Lipman J. Pharmacokinetic issues for antibiotics in the critically ill patient. Crit Care Med. 2009;37:840–851. doi: 10.1097/CCM.0b013e3181961bff. [DOI] [PubMed] [Google Scholar]
- 11.Pea F, Viale P, Furlanut M. Antimicrobial therapy in critically ill patients: a review of pathophysiological conditions responsible for altered disposition and pharmacokinetic variability. Clin Pharmacokinet. 2005;44:1009–1034. doi: 10.2165/00003088-200544100-00002. [DOI] [PubMed] [Google Scholar]
- 12.Mehrotra R, De Gaudio R, Palazzo M. Antibiotic pharmacokinetic and pharmacodynamic considerations in critical illness. Intensive Care Med. 2004;30:2145–2156. doi: 10.1007/s00134-004-2428-9. [DOI] [PubMed] [Google Scholar]
- 13.Boucher BA, Wood GC, Swanson JM. Pharmacokinetic changes in critical illness. Crit Care Clin. 2006;22:255–271. doi: 10.1016/j.ccc.2006.02.011. [DOI] [PubMed] [Google Scholar]
- 14.Belzberg H, Zhu J, Cornwell EE, III, Murray JA, Sava J, Salim A, Velmahos GC, Gill MA. Imipenem levels are not predictable in the critically ill patient. J Trauma. 2004;56:111–117. doi: 10.1097/01.TA.0000056164.26493.28. [DOI] [PubMed] [Google Scholar]
- 15.McKindley DS, Boucher BA, Hess MM, Croce MA, Fabian TC. Pharmacokinetics of aztreonam and imipenem in critically ill patients with pneumonia. Pharmacotherapy. 1996;16:924–931. [PubMed] [Google Scholar]
- 16.Tegeder I, Schmidtko A, Bräutigam L, Kirschbaum A, Geisslinger G, Lötsch J. Tissue distribution of imipenem in critically ill patients. Clin Pharmacol Ther. 2002;71:325–333. doi: 10.1067/mcp.2002.122526. [DOI] [PubMed] [Google Scholar]
- 17.Novelli A, Adembri C, Livi P, Fallani S, Mazzei T, De Gaudio AR. Pharmacokinetic evaluation of meropenem and imipenem in critically ill patients with sepsis. Clin Pharmacokinet. 2005;44:539–549. doi: 10.2165/00003088-200544050-00007. [DOI] [PubMed] [Google Scholar]
- 18.Sakka SG, Glauner AK, Bulitta JB, Kinzig-Schippers M, Pfister W, Drusano GL, Sorgel F. Population pharmacokinetics and pharmacodynamics of continuous versus short-term infusion of imipenem-cilastatin in critically ill patients in a randomized, controlled trial. Antimicrob Agents Chemother. 2007;51:3304–3310. doi: 10.1128/AAC.01318-06. [DOI] [PMC free article] [PubMed] [Google Scholar]
- 19.Jaruratanasirikul S, Sudsai T. Comparison of the Pharmacodynamics of Imipenem in Patients with Ventilator-Associated Pneumonia Following Administration by 2 or 0.5 H Infusion. J Antimicrob Chemother. 2009;63:560–563. doi: 10.1093/jac/dkn543. [DOI] [PubMed] [Google Scholar]
- 20.Conil J-M, Georges B, Ruiz S, Rival T, Seguin T, Cougot P, Fourcade O, Houin G, Saivin Sylvie. Tobramycin disposition in ICU patients receiving a once daily regimen: population approach and dosage simulations. Br J Clin Pharmacol. 2011;71:61–71. doi: 10.1111/j.1365-2125.2010.03793.x. [DOI] [PMC free article] [PubMed] [Google Scholar]
- 21.Crandon JL, Ariano RE, Zelenitsky SA, Nicasio AM, Kuti JL, Nicolau DP. Optimization of meropenem dosage in the critically ill population based on renal function. Intensive Care Med. 2011;37:632–638. doi: 10.1007/s00134-010-2105-0. [DOI] [PubMed] [Google Scholar]
- 22.Garcia-Capdevila L, López-Calull C, Arroyo C, Moral MA, Mangues MA, Bonal J. Determination of imipenem in plasma by high-performance liquid chromatography for pharmacokinetic studies in patients. J Chromatogr B Biomed Sci App. 1997;692:127–132. doi: 10.1016/s0378-4347(96)00498-7. [DOI] [PubMed] [Google Scholar]
- 23.Lavielle M, Mentré F. Estimation of Population Pharmacokinetic Parameters of Saquinavir in HIV Patients with the MONOLIX Software. J Pharmacokinet Pharmacodyn. 2007;34:229–249. doi: 10.1007/s10928-006-9043-z. [DOI] [PMC free article] [PubMed] [Google Scholar]
- 24.Kuhn E, Lavielle M. Maximum likelihood estimation in nonlinear mixed effects models. Comput Stat Data Anal. 2005;49:1020–1038. [Google Scholar]
- 25.Samson A, Lavielle M, Mentré F. Extension of the SAEM algorithm to left-censored data in nonlinear mixed-effects model: application to HIV dynamics model. Comput Stat Data Anal. 2006;51:1562–1574. [Google Scholar]
- 26.Beal SL. Ways to fit a PK model with some data below the quantification limit. J Pharmacokinet Pharmacodyn. 2001;28:481–504. doi: 10.1023/a:1012299115260. [DOI] [PubMed] [Google Scholar]
- 27.Le Gall JR, Lemeshow S, Saulnier F. A new Simplified Acute Physiology Score (SAPS II) based on a European/North American multicenter study. J Am Med Assoc. 1993;270:2957–2963. doi: 10.1001/jama.270.24.2957. [DOI] [PubMed] [Google Scholar]
- 28.Vincent JL, Moreno R, Takala J, Willatts S, De Mendonça A, Bruining H, Reinhart CK, Suter PM, Thijs LG. The SOFA (Sepsis-related Organ Failure Assessment) score to describe organ dysfunction/failure. On behalf of the Working Group on Sepsis-Related Problems of the European Society of Intensive Care Medicine. Intensive Care Med. 1996;22:707–710. doi: 10.1007/BF01709751. [DOI] [PubMed] [Google Scholar]
- 29.Gómez CM, Cordingly JJ, Palazzo MG. Altered pharmacokinetics of ceftazidime in critically ill patients. Antimicrob Agents Chemother. 1999;43:1798–1802. doi: 10.1128/aac.43.7.1798. [DOI] [PMC free article] [PubMed] [Google Scholar]
- 30.Pickering JW, Frampton CM, Walker RJ, Shaw GM, Endre ZH. Four hour creatinine clearance is better than plasma creatinine for monitoring renal function in critically ill patients. Crit Care Lond Engl. 2012;16:R107. doi: 10.1186/cc11391. [DOI] [PMC free article] [PubMed] [Google Scholar]
- 31.Herrera-Gutiérrez ME, Seller-Pérez G, Banderas-Bravo E, Muñoz-Bono J, Lebrón-Gallardo M, Fernandez-Ortega JF. Replacement of 24-h creatinine clearance by 2-h creatinine clearance in intensive care unit patients: a single-center study. Intensive Care Med. 2007;33:1900–1906. doi: 10.1007/s00134-007-0745-5. [DOI] [PubMed] [Google Scholar]
- 32.Herget-Rosenthal S, Quellmann T, Linden C, Hollenbeck M, Jankowski V, Kribben A. How does late nephrological co-management impact chronic kidney disease? – An observational study. Int J Clin Pract. 2010;64:1784–1792. doi: 10.1111/j.1742-1241.2010.02535.x. [DOI] [PubMed] [Google Scholar]
- 33.Mould DR, Upton RN. Basic concepts in population modeling, simulation, and model-based drug development-part 2: introduction to pharmacokinetic modeling methods. CPT Pharmacomet Syst Pharmacol. 2013;2:e38. doi: 10.1038/psp.2013.14. [DOI] [PMC free article] [PubMed] [Google Scholar]
- 34.Thai H-T, Mentré F, Holford NHG, Veyrat-Follet C, Comets E. Evaluation of bootstrap methods for estimating uncertainty of parameters in nonlinear mixed-effects models: a simulation study in population pharmacokinetics. J Pharmacokinet Pharmacodyn. 2014;41:15–33. doi: 10.1007/s10928-013-9343-z. [DOI] [PubMed] [Google Scholar]
- 35.Bergstrand M, Hooker AC, Wallin JE, Karlsson MO. Prediction-corrected visual predictive checks for diagnosing nonlinear mixed-effects models. AAPS J. 2011;13:143–151. doi: 10.1208/s12248-011-9255-z. [DOI] [PMC free article] [PubMed] [Google Scholar]
- 36.EUCAST. Breakpoint table for interpretation of MICs and zone diameters [Internet]. Available at http://www.eucast.org/ (last accessed 25 November 2013)
- 37.Ribbing J, Nyberg J, Caster O, Jonsson EN. The lasso-a novel method for predictive covariate model building in nonlinear mixed effects models. J Pharmacokinet Pharmacodyn. 2007;34:485–517. doi: 10.1007/s10928-007-9057-1. [DOI] [PubMed] [Google Scholar]
- 38.Yoshizawa K, Ikawa K, Ikeda K, Kumon H, Ohge H, Morikawa N. Optimisation of imipenem regimens in patients with impaired renal function by pharmacokinetic-pharmacodynamic target attainment analysis of plasma and urinary concentration data. Int J Antimicrob Agents. 2012;40:427–433. doi: 10.1016/j.ijantimicag.2012.06.011. [DOI] [PubMed] [Google Scholar]
- 39.De Paepe P, Belpaire FM, Buylaert WA. Pharmacokinetic and pharmacodynamic considerations when treating patients with sepsis and septic shock. Clin Pharmacokinet. 2002;41:1135–1151. doi: 10.2165/00003088-200241140-00002. [DOI] [PubMed] [Google Scholar]
- 40.Tanigawara Y, Sato R, Morita K, Kaku M, Aikawa N, Shimizu K. Population pharmacokinetics of Arbekacin in patients infected with methicillin-resistant Staphylococcus aureus. Antimicrob Agents Chemother. 2006;50:3754–3762. doi: 10.1128/AAC.00420-05. [DOI] [PMC free article] [PubMed] [Google Scholar]
Associated Data
This section collects any data citations, data availability statements, or supplementary materials included in this article.
Supplementary Materials
Predicted steady–state concentrations of imipenem for 750 mg q6h dosage regimen with percentile values (10th, 50th and 90th) of the three significant covariates: with (a) creatinine clearance percentiles: 10th = 17 ml min–1; 50th = 86.4 ml min–1; 90th = 258 ml min–1; (b) body weight: 10th = 53 kg; 50th = 77 kg; 90th = 111 kg; (c) serum albumin: 10th = 11 g l–1; 50th = 18 g l–1; 90th = 23 g l–1. Vertical lines are displayed for MIC = 2 μg ml–1 and MIC = 4 μg ml–1
Expected fractional time above MIC (fT > MIC) for two target MICs 2 and 4 μg ml−1 for 1000 mg q8h and 750 mg q6h dosage regimen and population parameters for the 10th, 50th and 90th percentiles of the three significant covariates