

Abstract
Aims
To report Australian population trends in subsidized prescribed opioid use, total costs to the Australian government to subsidize these medicines and opioid-related harms based on hospitalizations and accidental poisoning deaths.
Methods
We utilized three national aggregated data sources including dispensing claims from the Pharmaceutical Benefits Scheme, opioid-related hospitalizations from the National Hospital Morbidity Database and accidental poisoning deaths from the Australian Bureau of Statistics.
Results
Between 1992 and 2012, opioid dispensing episodes increased 15-fold (500 000 to 7.5 million) and the corresponding cost to the Australian government increased 32-fold ($8.5 million to $271 million). Opioid-related harms also increased. Opioid-related hospitalizations increased from 605 to 1464 cases (1998–2009), outnumbering hospitalizations due to heroin poisonings since 2001. Deaths due to accidental poisoning (pharmaceutical opioids and illicit substances combined) increased from 151 to 266 (2002–2011), resulting in a rise in the death rate of 0.78 to 1.19 deaths/100 000 population over 10 years. Death rates increased 1.8 fold in males and 1.4 fold in females.
Conclusions
The striking increase in opioid use and related harms in Australia is consistent with trends observed in other jurisdictions. Further, there is no evidence to suggest these increases are plateauing. There is currently limited evidence in Australia about individual patterns of opioid use and the associated risk of adverse events. Further research should focus on these important issues so as to provide important evidence supporting effective change in policy and practice.
Keywords: Australia, death, drug utilization, factual databases, hospitalization, opioid analgesics
What Is Already Known about This Subject
Prescribed opioid use is rising, particularly in the US and Canada, to treat cancer and non-cancer pain.
The consequences of prescribed opioid misuse are increasing, specifically in the US.
Currently, there is no Australian research demonstrating patterns/consequences of opioid utilization for all opioids subsidized by the national reimbursement medicine scheme.
What Does This Study Add?
In Australia opioid use is increasing, as is the cost to the government and the personal consequences of opioid use including number of hospitalizations and number of deaths.
Further research is required to understand the patterns of prescribed medicine use to reduce/prevent associated adverse consequences.
Introduction
There has been a long-standing role for opioid analgesics to treat patients with cancer pain. Over the past 20 years, the indication for opioids has expanded to treat acute and chronic, non-cancer pain. Opioids have been shown to be effective for short term pain relief but there is only limited evidence of the long term benefits of opioid use for any indication [1,2]. As a consequence of extending these indications, opioid utilization has increased significantly in many jurisdictions, most notably the US [3–7]. Increased use, coupled with prolonged use in patients with chronic non-cancer pain, have led to concerns on the part of policy makers, health professionals and the general public about population and individual risks and benefits of prescribed opioids [8,9].
Three professional bodies from the US and Australia have outlined concerns about the staggering increases in opioid use and the increase in related harms. However, they caution against strict regulations in accessing these medications for patients requiring pain relief [8–10].
There has been an increase in opioid use in Australia over the past 30 years [11–18]. In 2013, there were 241 preparations for 12 opioid analgesics available for prescribing in Australia. Morphine (87 preparations), tramadol (48 preparations), fentanyl (43 preparations) and oxycodone (37 preparations) have the highest number of preparations (Table 1). Eight opioids are currently subsidized by the Pharmaceutical Benefit Scheme (PBS): buprenorphine, codeine, fentanyl, hydromorphone, methadone, morphine, oxycodone and tramadol. Currently, there are four opioids available for prescription in Australia, which are not PBS-listed, alfentanil, dextropropoxyphene, pethidine and tapentadol.
Table 1.
The number of opioids available in Australia for prescription
| Opioids available in Australia for prescription | Number of opioid preparations available in Australia* for analgesia | Number of opioid preparations available in Australia* to treat opiate addiction |
|---|---|---|
| Alfentanil | 2 | 0 |
| Buprenorphine | 5 | 5 |
| Codeine | 2 | 0 |
| Dextropropoxyphene | 1 | 0 |
| Fentanyl | 43 | 0 |
| Hydromorphone | 5 | 0 |
| Methadone | 2 | 5 |
| Morphine | 87 | 0 |
| Oxycodone | 37 | 0 |
| Pethidine | 4 | 0 |
| Tapentadol | 5 | 0 |
| Tramadol | 48 | 0 |
| Total | 241 | 10 |
A preparation is defined as an entry in the ‘narcotic analgesics’ section of MIMS regardless of PBS status, pack size and preparation. This reflects the product range available to prescriber and consumer (MIMS data accessed September 27 2013).
In Australia, studies have investigated the harms related to the use of specific opioids such as oxycodone, fentanyl and morphine [14,15,18]. This paper updates our previous report [11] on trends in PBS-subsidized opioid use in Australia. We also report the total costs to the Australian government to subsidize these medicines. Lastly, we will report the opioid-related harms based on hospitalizations and accidental deaths.
Methods
Setting
In 2012, the population of Australia was approximately 22.7 million. Australia has a publically funded universal healthcare system entitling all citizens and permanent residents to a range of subsidized health services including free treatment in public hospitals and subsidized treatment in private hospitals. It also includes a range of subsidized outpatient services including consultations with clinicians and prescribed medicines. These arrangements place Australia in a unique position to analyze patterns of medicine utilization and reported harms at a population level.
Data sources and method
Three national publically available, online aggregated data sources were utilized to report patterns of PBS-listed opioid utilization and costs to the government; number of hospitalizations due to opioid poisonings, and number of accidental deaths related to illicit drugs and pharmaceutical opioids.
Prescribed opioid use and costs
The PBS is a national medicine reimbursement system subsidizing a range of prescribed medicines. PBS dispensing records are available in aggregate (de-identified) form via Medicare Australia (http://www.medicareaustralia.gov.au/provider/pbs/stats.jsp) where data queries can be performed to establish volume and costs of specific PBS item numbers according to time periods of interest. We report the number of dispensing episodes and cost to the government for the eight PBS-listed opioids by calendar year from 1992 to 2012 inclusive. We do not report volume of combination medicines, nor population, age or sex-adjusted data.
There are several limitations associated with PBS data. The dispensing of a PBS medicine is not recorded in the database if: the Commonwealth does not contribute to the cost of the medicine, it is given within some public hospital settings, or the indication is to treat an addictive disorder (which is funded by the Section 100 ‘Highly Specialised Drugs’ program). Consequently, there is under-ascertainment of PBS-listed medicines that fall below the general beneficiary co-payment. In 2013, 78 of the 146 PBS item numbers related to an opioid preparation were priced under the general beneficiary copayment of $36.10. It is not possible to report the number of opioids priced under the copayment per year so we cannot determine the extent to which the data presented underestimates total use. We cannot determine the indication for opioid use (i.e. cancer or non-cancer pain), as the same PBS item number is used for both indications.
Opioid-related hospitalizations
The National Hospital Morbidity Database (NHMD) reports hospitalizations in Australia, since July 1993. In this context, a hospitalization refers to the completion of treatment for an admitted patient due to death, discharge or transfer to another facility. Each hospitalization is coded according to the International Classification of Diseases (ICD). We report the number of hospitalizations for any opioid-related poisoning, either prescribed or illicit, by financial year (from July 1 to June 30) from 1998 to 2009 inclusive, hereafter referred to as year. These are coded according to the ICD and related health problems, 10th revision, clinical modification (ICD-10-CM) [19]. In 1998 the codes across Australian jurisdictions changed to ICD-10 codes, to ensure the reported data are consistent and comparable, we chose to limit the date range. We present the hospitalizations where the ICD-codes indicate the principal diagnosis as a poisoning due to ‘other opioids’ (T40.2) (includes morphine, oxycodone and codeine), methadone (T40.3) and ‘other and unspecified narcotics’ (T40.6). We also present heroin-related (T40.1) hospitalizations to track changes over time. The total number of opioid-related poisonings reported are the sum of hospitalizations using these ICD-10 codes only [20,21].
The NHMD is a national dataset compiled from data supplied by the state and territory health authorities. However, one Australian state (South Australia) did not contribute to the data from 1999 to 2001 inclusive. Over the counter and prescription codeine preparations may contribute to the ‘other opioids’ poisoning category as the database does not differentiate between these preparations. The NHMD relies on individual coders at each hospital to enter data accurately and consistently regarding principal diagnosis, which is of a high standard in Australia [22]. Hospital data are likely to under-ascertain the true number of pharmaceutical opioid-related poisonings as they may not be recognized or accurately recorded by clinicians, and hospital coders may under-detect such diagnoses.
Accidental poisoning deaths
Cause of death data were obtained from the Australian Bureau of Statistics (ABS), Causes of Death, 2011 report [23]. The cause of death included in this report is ‘accidental poisoning by and exposure to narcotics and hallucinogens not elsewhere classified’ (ICD-10 code X42). We report the number of deaths for each calendar year from 2002 to 2011 inclusive. We calculated the rate of death based on the number of deaths and ABS reported Australian population in 2002 and 2011.
This is a national dataset recording cause of death based on death certificate data. The ICD-10 code X42 excludes deaths with suicidal or homicidal intent, or if the dosage of medicine is consistent with therapeutic doses. These data record accidental poisoning deaths caused by codeine, pharmaceutical opioids [methadone, morphine and opium (alkaloids)] and non-pharmaceutical drugs (cannabis, cocaine, heroin, lysergide and mescaline). The ABS cause of death coding does not distinguish between pharmaceutical and illicit substances, therefore it is not possible for us to delineate the contribution of each cause of death in the data.
Results
Prescribed opioid use and costs
Between 1992–2012, there was a 15-fold increase in the number of PBS-listed opioid dispensing episodes (500 568 to 7 495 648) (Figure 1A). Oxycodone has been the main contributor to the increase in opioid utilization. The most striking recent trend has been the escalating use of buprenorphine and fentanyl for the treatment of pain. This finding reflects buprenorphine use for the indication of pain only, as data on medicines used to treat opiate addiction are not available through this data source.
Figure 1.
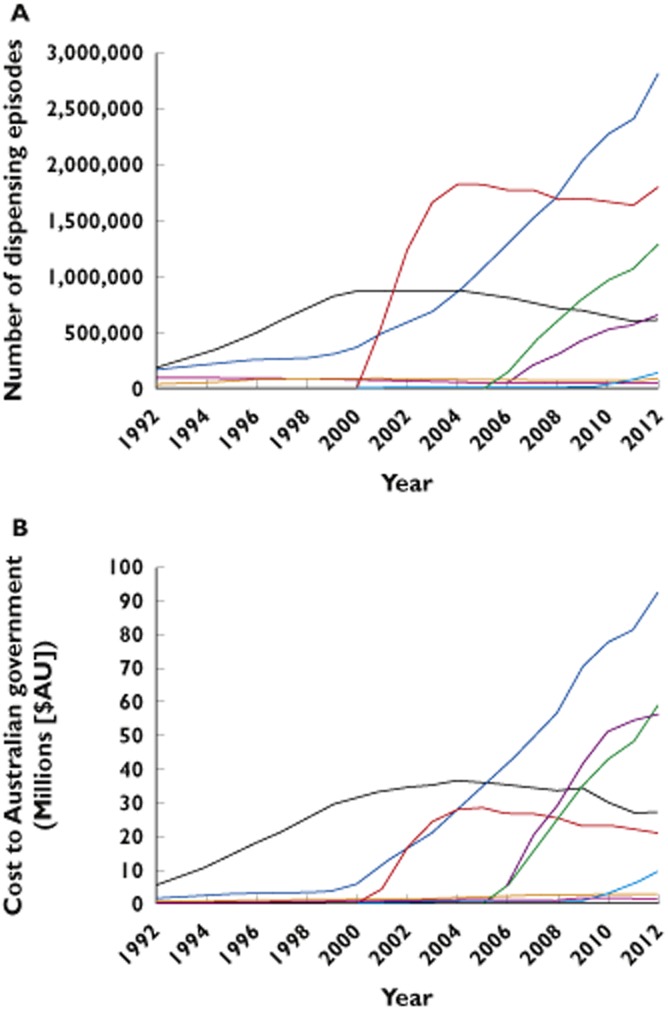
(A) Number of dispensing episodes for opioid analgesics by medicine in Australia: 1992–2012. (B) Benefits paid by the Australian government for opioid analgesics in Australia: 1992–2012.  , oxycodone;
  , tramadol;
  , buprenorphine;
  , fentanyl;
  , morphine;
  , hydromorphone;
  , methadone;
  , codeine
In 1992, the Australian government paid approximately $8.5 million (for 500 568 dispensing episodes) in subsidies for PBS-listed opioids, increasing to $270.8 million (for 7.5 million dispensing episodes) in 2012, a 32-fold increase (Figure 1B). In 2012, oxycodone preparations accounted for 38% of the total number of dispensing episodes (2.8 million) and 34% of the benefits paid ($92.7 million). The cost of buprenorphine and fentanyl to the PBS are rising at a striking rate and now rank second and third in terms of opioid-related costs, respectively. Since 2009, the combined annual cost of buprenorphine and fentanyl has exceeded the annual cost of oxycodone.
Opioid-related harms
In 1998, 65% of hospitalizations due to opioid poisoning were attributable to heroin and 23% due to ‘other opioids’. In 2001, ‘other opioids’ overtook heroin as the leading cause of opioid-related hospitalizations; by 2009, ‘other opioids’ accounted for 58% (Figure 2). There was a decline in the total number of opioid poisonings from 1999 to 2002 but since 2005 the number of opioid-related poisonings has increased primarily due to ‘other opioids’. Methadone and ‘other and unspecified narcotics’ hospitalization numbers have remained stable over this time period.
Figure 2.
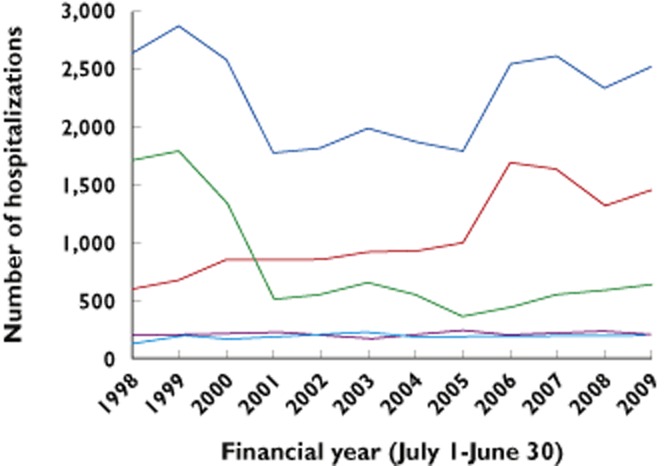
Number of hospitalizations by opioid poisoning type across Australia: 1998–2009.  , total;
  , other opioids;
  , heroin;
  , methadone;
  , other and unspecified narcotics
Accidental poisoning deaths
The number of accidental deaths due to pharmaceutical opioids and other illicit substances increased from 151 in 2002 to 266 in 2011 (Figure 3), representing a 1.7-fold increase. The rate of increase was higher for males (1.8 fold) than females (1.4-fold). The rate of accidental poisoning deaths increased over the time period from 0.78 to 1.19 deaths/100 000 population.
Figure 3.
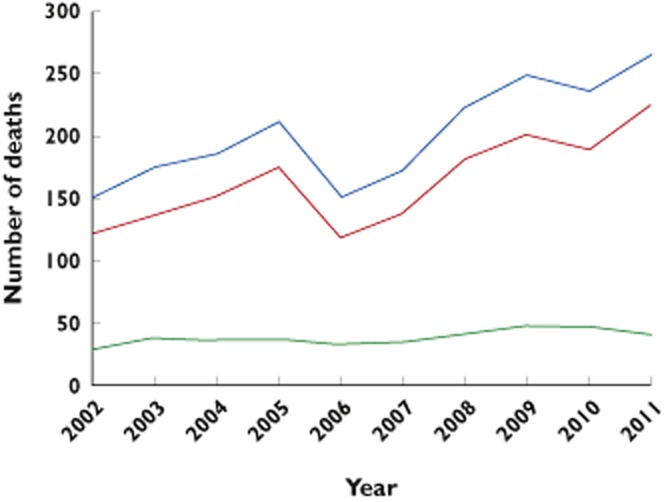
Number of accidental deaths due to illicit drugs and pharmaceutical opioids in Australia: 2002–2011.  , total;
  , male;
  , female
Discussion
This report confirms and extends previous findings documenting the escalation of prescription opioid use in Australia. This study found that opioid utilization has continued to increase at a striking rate since our previous report just 5 years ago [11]. The use of buprenorphine and fentanyl combined has escalated since that report and their total cost to government now exceeds that for oxycodone. We found an increase in the past decade in the number of hospitalizations related to prescribed opioids and the number of accidental deaths due to illicit drugs and pharmaceutical opioids. These data indicate the need for broad new strategies to manage opioid use.
A number of explanations may account for the exponential increase in opioid utilization in Australia in the past 20 years including changes in PBS listings, prescriber/patient preference for specific opioids, the ageing population, increase in prevalence of pain and/or reduced availability of illicit drugs.
The increase in opioid dispensing may reflect PBS listing changes. The increase in oxycodone and tramadol dispensing from 2000 (Figure 1A) is likely due to the extension of the PBS listings for opioid analgesics to treat both cancer and non-cancer pain [24]. Moreover, in 2004 there was an increase in the quantity and number of repeat PBS prescriptions for oxycodone, hydromorphone, methadone and morphine. Tramadol is a weaker analgesic compared with these opioids and it appears that when doctors were given the opportunity to prescribe larger quantities of stronger opioids, the rate of tramadol dispensing decreased. Despite the broadening of restrictions for all opioids, oxycodone has experienced the greatest increase in dispensing. These data suggest the increase in pack size of oxycodone influenced prescribing practices.
A recent Australian study found a significant proportion of older persons initiating oxycodone for non-cancer pain had not been treated in the previous 12 months with any other analgesic [25]. This is a concern as PBS-listed opioids are funded as ‘second line treatment for pain not relieved by non-narcotic analgesics’ such as paracetamol. This may be due to Australian prescribers being less aware of the best practice prescribing guidelines for analgesia. An alternate explanation may be due to prescriber preference. In Denmark, hospital physicians and general practitioners preferred to prescribe oxycodone over morphine to opioid naïve patients [26], and in Spain, oxycodone and fentanyl may be prescribed instead of morphine, due to the latter's association with the end of life [27].
Australia's ageing population may also account for the observed increase in opioid utilization. Of all oxycodone and fentanyl dispensed, the rate of utilization in the 80+ years age group is higher than any other age group [14,15]. Rates of concomitant medicine use are also high in the elderly [28], as well as an increased sensitivity to drug toxicity suggests opioid related harm may be a particular issue in this age group.
The prevalence of pain has increased at a population level in Australia since 1995, which would be expected to increase the demand for analgesia. According to Australia's National Health Survey, the reported prevalence of body pain was 57% in 1995 increasing to 68% in 2008 as assessed by the SF-36, a validated quality of life measure. Similarly, there was an increase in self-reported severe/very severe pain, from 7% in 1995 to 10% in 2008 [29]. Despite the increase in opioid use and availability of different opioids and formulations, there remain many cases where pain is undertreated [30].
The limited availability of illicit drugs may also impact on prescribed opioid utilization. Australia experienced a heroin drought in 2001, and due to the reduction of heroin availability, some drug seekers may have sought pharmaceutical opioids as a replacement [13,31].
Cost of opioid utilization
Since 1992, the Australian government has paid over $2 billion in opioid prescription subsidies. The cost of opioids has risen significantly in the past 5 years, primarily due to the increase in dispensing of buprenorphine and fentanyl. The newer opioids are more expensive as they include controlled release preparations. This increased rate of prescribing most likely accounts for the extraordinary 32-fold increase in cost to the government compared with the 15-fold increase in opioid dispensing episodes. This is likely to be of concern for the government, as the utilization and hence cost to the government for these opioids is yet to plateau (Figure 1A,B).
Of note is the escalating cost of buprenorphine and fentanyl. Since 2005, the PBS has subsidized buprenorphine transdermal patches to treat pain costing between $24.67 and $56.18 per dispensing. The buprenorphine patch singularly accounts for all buprenorphine use and has been the driver for increased buprenorphine use in other jurisdictions [27,32]. For fentanyl, the transdermal patch and lozenge are PBS-subsidized. From 2006–2008 the fentanyl patch was the only PBS-listed formulation costing between $41.53 and $171.63 per dispensing. The lozenge was introduced in 2008 costing between $114.62 and $680.23 per dispensing and used exclusively in palliative care. We note the significant upward trend in number of dispensings and cost did not appear to be impacted on by the introduction of the lozenge, meaning that the patch is likely to be the biggest contributor to volume and cost. Other jurisdictions have also reported the transdermal patch to be the primary driver of increased fentanyl use [27,32,33].
Opioid-related harms
There is a plethora of literature reporting the medical harms associated with opioid use [14,15,34–44] and all of these findings indicate opioid-related harms are increasing.
Based on publically available data we were able to examine opioid-related hospitalizations and accidental poisoning deaths, both of which have been increasing since the early 2000s. These patterns are consistent with the US with one notable exception. In Australia the increase in death was higher in males (1.8-fold) than females (1.4-fold), whereas, in the US, between 1999 and 2010, for opioid-related deaths the rate of increase was higher for females (400%) than males (265%) [45]. The absolute number of overdose deaths in males exceeds females in both countries. One explanation for this discrepancy may be the inclusion of illicit drugs in the Australian cause of death data, as males are more likely to overdose on illicit substances than females.
The strengths of this report include combining multiple national data sources to document opioid prescription availability, utilization, costs and related harms in the Australian context. To our knowledge, no previous Australian study has synthesized the information presented from these data sources to describe the rise and consequences of an increase in the use of all PBS-funded opioids. This overview also demonstrates there is a wide array of high quality data freely available documenting trends of opioid use, costs and harms that can be utilized to assess the effectiveness of strategies to contain usage.
This paper does rely on routinely collected datasets and they are not without limitations as described above. One of the main limitations of the PBS dataset is it underestimates whole of population use, making the accuracy of the trends uncertain and all interpretations are subject to this limitation. However, a recent study analyzing data from the state of Queensland found that PBS data correlate closely with data derived from state-based mandatory reporting for all Schedule 8 opioid prescriptions [17]. All opioids reported in this study are Schedule 8, except tramadol, listed as a Schedule 4 medicine indicating a reduced risk of abuse.
The present study shows that opioid use is increasing in Australia, with no sign of stabilization. Within the same time period, the number of opioid-related hospitalizations and accidental poisoning deaths have also increased. A national pharmaceutical drug strategy has been devised [46] but does not appear to have impacted on the rising opioid use to date. We recommend further population based studies exploring individual level data on opioid use. Such studies could assess the safety of opioids through identifying risky prescribing patterns, ensure prescribing patterns are consistent with health policy guidelines and limit concomitant use of opioids with other potentially dangerous medicines such as benzodiazepines, particularly in the elderly. We also need to understand patterns of medicine use that may indicate evolving dependence on opioids. This information could in turn be communicated to prescribers to guide interventions aimed at preventing opioid dependence and consequent harms.
In conclusion, opioid analgesics are effective in treating both cancer and non-cancer pain. However, the ongoing increase in opioid utilization and related harms in Australia demonstrates there is an urgent need for further research to understand patterns of opioid use that moves from aggregated data to individual level analyses for the Australian population. Through this research we hope to generate strategies to optimize the use of opioid analgesics and optimize pain relief with minimal complications.
Author contributions
Concept and design – all authors; Analysis and interpretation – all authors; Drafting the manuscript – all authors; Manuscript approved – all authors.
Competing Interests
All authors have completed the Unified Competing Interest form at http://www.icmje.org/coi_disclosure.pdf (available on request from the corresponding author) and declare no support from any organization for the submitted work, no financial relationships with any organizations that might have an interest in the submitted work in the previous 3 years and no other relationships or activities that could appear to have influenced the submitted work.
This paper is based on a presentation to the International Narcotics Research Conference in Cairns, Australia in July 2013. BB is supported by a University of Sydney Postgraduate Award.
References
- 1.Ballantyne JC. Chronic opioid therapy and its utility in different populations. Pain. 2012;153:2303–2304. doi: 10.1016/j.pain.2012.07.015. [DOI] [PubMed] [Google Scholar]
- 2.Kissin I. Long-term opioid treatment of chronic nonmalignant pain: unproven efficacy and neglected safety? J Pain Res. 2013;6:513–529. doi: 10.2147/JPR.S47182. [DOI] [PMC free article] [PubMed] [Google Scholar]
- 3.Kuehn BM. Opioid prescriptions soar: increase in legitimate use as well as abuse. JAMA. 2007;297:249–251. doi: 10.1001/jama.297.3.249. [DOI] [PubMed] [Google Scholar]
- 4.Manchikanti L, Fellows B, Ailinani H, Pampati V. Therapeutic use, abuse, and nonmedical use of opioids: a ten-year perspective. Pain Physician. 2010;13:401–435. [PubMed] [Google Scholar]
- 5.Manchikanti L, Helm S, 2nd, Fellows B, Janata JW, Pampati V, Grider JS, Boswell MV. Opioid epidemic in the United States. Pain Physician. 2012;15:ES9–38. [PubMed] [Google Scholar]
- 6.Manchikanti L, Singh A. Therapeutic opioids: a ten-year perspective on the complexities and complications of the escalating use, abuse, and nonmedical use of opioids. Pain Physician. 2008;11:S63–88. [PubMed] [Google Scholar]
- 7.Casati A, Sedefov R, Pfeiffer-Gerschel T. Misuse of medicines in the European Union: a systematic review of the literature. Eur Addict Res. 2012;18:228–245. doi: 10.1159/000337028. [DOI] [PubMed] [Google Scholar]
- 8.The Royal Australian & New Zealand College of Psychiatrists. 2011. Response to the national pharmaceutical drug misuse strategy. Available at https://www.ranzcp.org/Files/Resources/Submissions/sub61-pdf.aspx (last accessed 1 December 2013)
- 9.Nicholas R, Lee N, Roche A. Pharmaceutical Drug Misuse in Australia: Complex Problems, Balanced Responses. Adelaide: Flinders University; 2011. National Centre for Education and Training on Addiction (NCETA) [Google Scholar]
- 10.Zacny J, Bigelow G, Compton P, Foley K, Iguchi M, Sannerud C. College on Problems of Drug Dependence taskforce on prescription opioid non-medical use and abuse: position statement. Drug Alcohol Depend. 2003;69:215–232. doi: 10.1016/s0376-8716(03)00003-6. [DOI] [PubMed] [Google Scholar]
- 11.Leong M, Murnion B, Haber PS. Examination of opioid prescribing in Australia from 1992 to 2007. Intern Med J. 2009;39:676–681. doi: 10.1111/j.1445-5994.2009.01982.x. [DOI] [PubMed] [Google Scholar]
- 12.Berbatis CG, Sunderland VB, Bulsara M, Lintzeris N. Trends in licit opioid use in Australia, 1984–1998: comparative analysis of international and jurisdictional data. Med J Aust. 2000;173:524–527. doi: 10.5694/j.1326-5377.2000.tb139320.x. [DOI] [PubMed] [Google Scholar]
- 13.Degenhardt L, Black E, Breen C, Bruno R, Kinner S, Roxburgh A, Fry C, Jenkinson R, Ward J, Fetherston J, Weekley J, Fischer J. Trends in morphine prescriptions, illicit morphine use and associated harms among regular injecting drug users in Australia. Drug Alcohol Rev. 2006;25:403–412. doi: 10.1080/09595230600868504. [DOI] [PubMed] [Google Scholar]
- 14.Roxburgh A, Burns L, Drummer OH, Pilgrim J, Farrell M, Degenhardt L. Trends in fentanyl prescriptions and fentanyl-related mortality in Australia. Drug Alcohol Rev. 2013;32:269–275. doi: 10.1111/dar.12033. [DOI] [PubMed] [Google Scholar]
- 15.Roxburgh A, Bruno R, Larance B, Burns L. Prescription of opioid analgesics and related harms in Australia. Med J Aust. 2011;195:280–284. doi: 10.5694/mja10.11450. [DOI] [PubMed] [Google Scholar]
- 16.Bell JR. Australian trends in opioid prescribing for chronic non-cancer pain, 1986–1996. Med J Aust. 1997;167:26–29. doi: 10.5694/j.1326-5377.1997.tb138759.x. [DOI] [PubMed] [Google Scholar]
- 17.Hollingworth SA, Symons M, Khatun M, Loveday B, Ballantyne S, Hall WD, Najman JM. Prescribing databases can be used to monitor trends in opioid analgesic prescribing in Australia. Aust N Z J Public Health. 2013;37:132–138. doi: 10.1111/1753-6405.12030. [DOI] [PubMed] [Google Scholar]
- 18.Rintoul AC, Dobbin MDH, Drummer OH, Ozanne-Smith J. Increasing deaths involving oxycodone, Victoria, Australia, 2000–09. Inj Prev. 2011;17:254–259. doi: 10.1136/ip.2010.029611. [DOI] [PubMed] [Google Scholar]
- 19.World Health Organisation. The ICD-10 Classification of Mental and Behavioural Disorders – Diagnostic Criteria for Research. Geneva: WHO; 1993. [Google Scholar]
- 20.Australian Institute of Health and Welfare. 2013. Separation statistics by principal diagnosis in ICD-10-AM, 1998–99 to 2007–08. Available at http://www.aihw.gov.au/hospitals-data/principal-diagnosis-data-cubes/ (last accessed 1 October 2013)
- 21.Australian Institute of Health and Welfare. Separation statistics by principal diagnosis in ICD-10-AM, 2008–09 to 2009–10 http://www.aihw.gov.au/hospitals-data/principal-diagnosis-data-cubes/ (last accessed 1 October 2013)
- 22.Henderson T, Shepheard J, Sundararajan V. Quality of diagnosis and procedure coding in ICD-10 administrative data. Med Care. 2006;44:1011–1019. doi: 10.1097/01.mlr.0000228018.48783.34. [DOI] [PubMed] [Google Scholar]
- 23.Australian Bureau of Statistics. Causes of death, Australia, 2011. Available at http://www.abs.gov.au/AUSSTATS/abs@.nsf/DetailsPage/3303.02011?OpenDocument (last accessed 4 October 2013)
- 24.Australian Government Department of Health. PBAC outcomes. Available at http://www.pbs.gov.au/info/industry/listing/elements/pbac-meetings/pbac-outcomes (last accessed 10 October 2013)
- 25.Gadzhanova S, Bell JS, Roughead EE. What analgesics do older people use prior to initiating oxycodone for non-cancer pain? A retrospective database study. Drugs Aging. 2013;30:921–926. doi: 10.1007/s40266-013-0115-7. [DOI] [PubMed] [Google Scholar]
- 26.Poulsen KK, Andersen SE, Moreno SI, Glintborg D, Thirstrup S, Aagaard L. General practitioners' and hospital physicians' preference for morphine or oxycodone as first-time choice for a strong opioid: a national register–based Study. Basic Clin Pharmacol Toxicol. 2013;112:110–115. doi: 10.1111/j.1742-7843.2012.00927.x. [DOI] [PubMed] [Google Scholar]
- 27.Garcia del Pozo J, Carvajal A, Viloria JM, Velasco A, Garcia del Pozo V. Trends in the consumption of opioid analgesics in Spain. Higher increases as fentanyl replaces morphine. Eur J Clin Pharmacol. 2008;64:411–415. doi: 10.1007/s00228-007-0419-9. [DOI] [PubMed] [Google Scholar]
- 28.Maher RL, Hanlon J, Hajjar ER. Clinical consequences of polypharmacy in elderly. Expert Opin Drug Saf. 2014;13:57–65. doi: 10.1517/14740338.2013.827660. [DOI] [PMC free article] [PubMed] [Google Scholar]
- 29.Australian Bureau of Statistics. 2012. Characteristics of bodily pain in Australia. Available at http://www.abs.gov.au/ausstats/abs@.nsf/Lookup/4841.0Chapter12011 (last accessed 14 November 2013)
- 30.Fairchild A. Under-treatment of cancer pain. Curr Opin Support Palliat Care. 2010;4:11–15. doi: 10.1097/SPC.0b013e328336289c. [DOI] [PubMed] [Google Scholar]
- 31.Longo MC, Henry-Edwards SM, Humeniuk RE, Christie P, Ali RL. Impact of the heroin ‘drought’ on patterns of drug use and drug-related harms. Drug Alcohol Rev. 2004;23:143–150. doi: 10.1080/09595230410001704118. [DOI] [PubMed] [Google Scholar]
- 32.Fredheim OM, Skurtveit S, Breivik H, Borchgrevink PC. Increasing use of opioids from 2004 to 2007 – pharmacoepidemiological data from a complete national prescription database in Norway. Eur J Pain. 2010;14:289–294. doi: 10.1016/j.ejpain.2009.05.006. [DOI] [PubMed] [Google Scholar]
- 33.Hudec R, Tisonova J, Bozekova L, Foltan V. Trends in consumption of opioid analgesics in Slovak Republic during 1998–2002. Eur J Clin Pharmacol. 2004;60:445–448. doi: 10.1007/s00228-004-0793-5. [DOI] [PubMed] [Google Scholar]
- 34.Schumann H, Erickson T, Thompson TM, Zautcke JL, Denton JS. Fentanyl epidemic in Chicago, Illinois and surrounding Cook County. Clin Toxicol. 2008;46:501–506. doi: 10.1080/15563650701877374. [DOI] [PubMed] [Google Scholar]
- 35.Porucznik CA, Johnson EM, Sauer B, Crook J, Rolfs RT. Studying adverse events related to prescription opioids: the Utah experience. Pain Med. 2011;12(Suppl 2):S16–25. doi: 10.1111/j.1526-4637.2011.01133.x. [DOI] [PubMed] [Google Scholar]
- 36.Stannard C. Opioids in the UK: what's the problem? BMJ. 2013;347:f5108. doi: 10.1136/bmj.f5108. [DOI] [PubMed] [Google Scholar]
- 37.Unick GJ, Rosenblum D, Mars S, Ciccarone D. Intertwined epidemics: national demographic trends in hospitalizations for heroin- and opioid-related overdoses, 1993–2009. PLoS ONE. 2013;8:e54496. doi: 10.1371/journal.pone.0054496. [DOI] [PMC free article] [PubMed] [Google Scholar]
- 38.Coben JH, Davis SM, Furbee PM, Sikora RD, Tillotson RD, Bossarte RM. Hospitalizations for poisoning by prescription opioids, sedatives, and tranquilizers.[Erratum appears in Am J Prev Med. 2010 Dec;39(6):613] Am J Prev Med. 2010;38:517–524. doi: 10.1016/j.amepre.2010.01.022. [DOI] [PubMed] [Google Scholar]
- 39.Lloyd BK, McElwee PR. Trends over time in characteristics of pharmaceutical drug-related ambulance attendances in Melbourne. Drug Alcohol Rev. 2011;30:271–280. doi: 10.1111/j.1465-3362.2011.00292.x. [DOI] [PubMed] [Google Scholar]
- 40.Hall AJ, Logan JE, Toblin RL, Kaplan JA, Kraner JC, Bixler D, Crosby AE, Paulozzi LJ. Patterns of abuse among unintentional pharmaceutical overdose fatalities. JAMA. 2008;300:2613–2620. doi: 10.1001/jama.2008.802. [DOI] [PubMed] [Google Scholar]
- 41.Jones CM, Mack KA, Paulozzi LJ. Pharmaceutical overdose deaths, United States, 2010. JAMA. 2013;309:657–659. doi: 10.1001/jama.2013.272. [DOI] [PubMed] [Google Scholar]
- 42.Paulozzi LJ, Kilbourne EM, Shah NG, Nolte KB, Desai HA, Landen MG, Harvey W, Loring LD. A history of being prescribed controlled substances and risk of drug overdose death. Pain Med. 2012;13:87–95. doi: 10.1111/j.1526-4637.2011.01260.x. [DOI] [PubMed] [Google Scholar]
- 43.Paulozzi LJ, Logan JE, Hall AJ, McKinstry E, Kaplan JA, Crosby AE. A comparison of drug overdose deaths involving methadone and other opioid analgesics in West Virginia. Addiction. 2009;104:1541–1548. doi: 10.1111/j.1360-0443.2009.02650.x. [DOI] [PubMed] [Google Scholar]
- 44.Darnall BD, Stacey BR, Chou R. Medical and psychological risks and consequences of long-term opioid therapy in women. Pain Med. 2012;13:1181–1211. doi: 10.1111/j.1526-4637.2012.01467.x. [DOI] [PMC free article] [PubMed] [Google Scholar]
- 45.Centers for Disease Control and Prevention. 2013. Vital signs: prescription painkiller overdoses: a growing epidemic, especially among women. Available at http://www.cdc.gov/vitalsigns/PrescriptionPainkillerOverdoses/index.html (last accessed 1 October 2013)
- 46.The National Centre for Education and Training on Addiction. National pharmaceutical drug misuse strategy. Available at http://nceta.flinders.edu.au/society/projects_and_research/national-pharmaceutical-drug-misuse-strategy/ (last accessed 1 December 2013)