

Abstract
Background and Purpose
YC-1 exhibits potent anticancer activity via numerous actions in many cancer cell lines. Hence, we investigated the in vivo antitumour efficacy of YC-1 in an MDA-MB-468 xenograft model and elucidated the mechanism of down-regulation of enhancer of zeste homology 2 (EZH2) by YC-1 in breast cancer cells.
Experimental Approach
In YC–1-treated breast cancer cells and tumour specimens from YC–1-treated MDA-MB-468 xenografts, EZH2 expression was analysed by Western blotting. Pharmacological inhibitors and short hairpin RNA-mediated knockdown were applied to identify possible signalling pathways involved in EZH2 down-regulation by YC-1.
Key Results
YC-1 reduced the viability of breast cancer cells and tumour growth in MDA-MB-468 xenografts. In breast cancer cells, YC-1 down-regulated EZH2 expression in a concentration- and time-dependent manner. Depletion of EZH2 reduced the proliferation and susceptibility of breast cancer cells to YC–1-induced apoptosis. EZH2 expression was suppressed in tumour specimens from YC–1-treated MDA-MB-468 xenograft mice. YC-1 enhanced both the degradation rate and ubiquitination of EZH2. The down-regulation of EZH2 by YC-1 was associated with activation of PKA and Src–Raf–ERK-mediated signalling pathways. Furthermore, depletion of Casitas B-lineage lymphoma (c-Cbl), an E3 ubiquitin ligase, abolished YC–1-induced apoptosis and suppression of EZH2. YC-1 rapidly activated c-Cbl to induce signalling associated with ERK and EZH2.
Conclusion and Implications
We discovered that YC-1 induces apoptosis and inhibits tumour growth of breast cancer cells via down-regulation of EZH2 by activating c-Cbl and ERK. These data suggest that YC-1 is a potential anticancer drug candidate for triple-negative breast cancer.
Introduction
Breast cancer is the most common malignancy and second most common cause of mortality in women (Siegel et al., 2013). Basic therapeutic standards involve radiation, surgery and chemotherapy. A variety of therapeutic targets have been identified, the best known of which are the oestrogen receptor, progesterone receptor and HER2 (also known as Neu, see Alexander et al., 2013). However, ∼15–20% of breast cancer patients present no effective response or low sensitivity to hormone-based therapies because they lack the oestrogen receptor, progesterone receptor and HER2; this is referred to as triple-negative breast cancer (TNBC) (Lin et al., 2012). Clinical histopathological diagnosis classifies TNBC into the aggressive histological subtype with highly metastatic properties (Nielsen et al., 2004). So far, there are no specific therapeutic agents available for the treatment of TNBC. With limited treatment options, TNBC has poor prognosis, high recurrence and a low survival rate (Gluz et al., 2009). Therefore, identification of novel therapeutic agents for TNBC is urgently needed.
Epigenetic dysregulation plays a critical role in cancer initiation and progression (Ellis et al., 2009). The polycomb group proteins are important epigenetic regulators that mainly function to silence tumour suppressor genes, and their dysregulation can contribute to tumourigenesis and pathogenesis (Rajasekhar and Begemann, 2007; Margueron and Reinberg, 2011). Polycomb group proteins are divided into two groups: polycomb repressive complex (PRC) 1 and PRC2. PRC2 is responsible for initiating gene silencing, and PRC2 includes enhancer of zeste homology (EZH) 2/EZH1, suppressor of zeste 12 (SUZ12), embryonic ectoderm development (EED) and retinoblastoma-associated protein 48 (RbAp48). PRC1 functions as a complex with PRC2 to identify targets of gene silencing. PRC1 is mainly composed of Ring1A, Ring1B and B cell-specific Moloney murine leukemia virus integration site 1 (Bmi1) (Rajasekhar and Begemann, 2007; Margueron and Reinberg, 2011). Among the polycomb group of proteins, EZH2 is the catalytic unit and serves as a histone methyltransferase that histone 3 lysine 27 trimethylation (H3K27me3) to mediate silencing of EZH2-targeted genes (Cao et al., 2002; Cao and Zhang, 2003). Overexpression of EZH2 has been reported in a variety of malignancies, including breast cancer, prostate cancer, colon cancer, renal cell cancer and haematopoietic malignancies (Bachmann et al., 2006; Collett et al., 2006). In breast cells, EZH2 exerts oncogenic properties that are highly associated with cell proliferation, invasion, metastasis and tumour aggressiveness (Bachmann et al., 2006; Collett et al., 2006; Kunju et al., 2011), and suppression of EZH2 inhibits breast cancer cell metastasis (Gonzalez et al., 2009; Du et al., 2012). Therefore, EZH2 is regarded as a marker for the detection of disease progression and prediction of prognosis after therapy regimens in breast cancer (Kleer et al., 2003; Kunju et al., 2011). These findings suggest that the inhibition of EZH2 may be a promising therapeutic strategy in breast cancer treatment.
YC-1, 3-(5′-hydroxymethyl-2′-furyl)-1-benzylindazole, was originally identified as an activator of NO-independent soluble guanylyl cyclase, and it inhibits platelet aggregation and prevents vascular contraction (Ko et al., 1994). YC-1 also exhibits potent anticancer activity via numerous actions in many cancer cell lines (Hsu et al., 2003; Pan et al., 2005; Liu et al., 2006; Lau et al., 2007; Wu et al., 2008; Fallahian et al., 2011; Lee et al., 2011; Cheng et al., 2012). Previous studies demonstrated that YC-1 has anticancer activity in breast cancer cells through a cGMP-dependent pathway (Fallahian et al., 2011; Cheng et al., 2012). However, the molecular mechanism underlying YC–1-induced apoptosis of breast cancer cells remains unclear. In our preliminary screen, YC-1 predominantly inhibited EZH2 expression in MDA-MB-468 cells, a TNBC cell line. Therefore, the purpose of this study was to identify the role of EZH2 inhibition and the anticancer mechanism of YC-1 in breast cancer cells.
Methods
Reagents and antibodies
YC-1 and YC-1-succinate (YC-1-S) were obtained from Yungshin Pharmaceutical Industry Co. Ltd. (Taichung, Taiwan). DMEM/F12 medium, RPMI-1640 medium, FBS, penicillin and streptomycin were purchased from HyClone Laboratories (Logan, UT, USA). Inhibitors: PD98059, SB203580, SP600125, MG-132, KT5720, KT5823, NS2028, Bay-43–9006, farnesyl thiosalicylic acid, roscovitine, AG1478, DZNep, and 5-azacytidine were obtained from Cayman (Ann Arbor, MI, USA). Src kinase inhibitor I and LY294002 were purchased from EMD Millipore Corporation (Billerica, MA, USA). Cycloheximide, 1H-[1,2,4]Oxadiazolo[4,3-a]quinoxalin-1-one (ODQ), genistein and gefitinib were obtained from Sigma-Aldrich (St. Louis, MO, USA). These inhibitors and YC-1 were dissolved in DMSO (its final concentration was less than 0.1% v·v−1). Antibodies against EZH2, SUZ12, Ring1A, Ring1B, Bmi1, phospho-p44/42 MAPK (ERK1/2) (Thr202/Tyr204), phospho-MEK1/2 (Ser217/221), phospho-p38 MAPK (Thr180/Tyr182), phospho-Src (Tyr416), phospho-c-Raf (Ser338), phospho-c-castias B-lineage lymphoma (Cbl) (Tyr731), phospho-c-Cbl (Tyr774), phospho-EGFR (Tyr1045), phospho-EGFR (Tyr1068), EGFR, caspase-3, caspase-8, caspase-9, PARP, p44/42 MAPK (ERK1/2), MEK1/2, Src, PKA C-α, PKA RI-α, tri-methyl-histone H3 (Lys27) and c-Cbl were purchased from Cell Signaling Technology (Beverly, MA, USA). Antibodies against EZH1, ubiquitin, Ras and β-actin were from EMD Millipore Corporation. Antibodies against PCNA, histone H3, normal rabbit IgG, normal mouse IgG, DNA methyltransferase (DNMT) 3a and DNMT3b were purchased from Santa Cruz Biotechnology (Santa Cruz, CA, USA). Antibodies against hypoxia-inducible factor-1α, EED, RbAp48, phospho-EZH2 (Thr487), α-tubulin and phospho–cyclin-dependent kinase 1 (CDK1) (Thr161) were obtained from GeneTex (Irvin, CA, USA). Antibodies against EZH2, Raf-1, CDK1 and DNMT1 were from BD Biosciences (San Diego, CA, USA). Other reagents were purchased from Sigma-Aldrich.
Cell culture
All cell lines used in this study were obtained from American Type Culture Collection (Manassas, VA, USA). MDA-MB-231, MDA-MB-453, MDA-MB-468, MCF-7, SKBR3 and T47D cells were cultured in DMEM/F12 medium supplemented with 10% (v·v−1) FBS, 100 U·mL−1 penicillin, and 100 μg·mL−1 streptomycin. 184A1 and MCF-10A were cultured in DMEM/F12 medium supplemented with 5% (v·v−1) horse serum, 0.5 μg·mL−1 hydrocortisone, 10 μg·mL−1 insulin, 20 ng·mL−1 EGF, 0.1 μg·mL−1 cholera enterotoxin, 2 mM L-glutamine, 100 U·mL−1 penicillin and 100 μg·mL−1 streptomycin. All cells were maintained in a humidified incubator containing 5% CO2. For hypoxia treatment, cells were incubated in a chamber flushed with 1% O2, 5% CO2 and 94% N2 at 37°C.
Cell viability assay
Cell viability was measured by the 3-(4,5-dimethyl-2-thiazolyl)2,5-diphenyl-2H-tetrazolium bromide (MTT) assay.
Morphological observation
Cells were incubated in the presence or absence of YC-1. For morphological observation, cells were visualized and photographed using a phase-contrast microscope equipped with a digital camera (Leica Microsystems, Wetzlar, Germany).
Colony formation assay
After exposure to YC-1, cells were collected and washed extensively with PBS. Five hundred cells per well were seeded onto six-well plates and maintained in a 37°C, 5% CO2 incubator. Three weeks later, colonies were fixed with formaldehyde (3.7%, v·v−1), stained with crystal violet (0.5%, w·v−1), and then counted.
Cell cycle analysis
Cells treated with YC-1 were fixed in cold 70% ethanol overnight. Cells were stained with staining solution (0.5% v·v−1 Triton X-100, 20 μg·mL−1 propidium iodide, 0.1 mg·mL−1 RNase A in PBS), followed by analysis on a FACSCalibur flow cytometer (BD Biosciences, Mountain View, CA, USA).
Western blot analysis
Cells were suspended in PBS containing proteinase inhibitor and phosphatase inhibitors, and then sonicated. Protein concentration was measured using the protein assay from Bio-Rad (Hercules, CA, USA). Lysate proteins were separated by SDS-PAGE and transferred to Immobilon P membrane (EMD Millipore Corporation). The membranes were incubated with appropriate primary antibodies and HRP–conjugated secondary antibodies (EMD Millipore Corporation). Signalling was visualized using the chemiluminescence substrate kit (EMD Millipore Corporation) and collected by the luminescence image analyser, LAS4000 (Fuji Photo Film Co., Tokyo, Japan). The band intensities were analysed and quantified by the Multi Gauge software (Fuji Photo Film Co.).
shRNA transfection and cell infection
The pCMV-R8.91 harboring Gag and Pol genes, pMD.G containing the gene for expressing the vesicular stomatitis virus envelope glycoprotein (i.e. VSV-G), and pLKO.1 bearing specific shRNAs were purchased from the National RNAi Core Facility Academia Sinica (Taipei, Taiwan). shRNA clones used in this study are described in Supporting Information Table S1. Lentivirus particles were produced by transient transfection with specific shRNA and packaging vectors (pCMV-ΔR8.91 and pMD.G) using Lipofectamine 2000 transfection reagent (Invitrogen Corp., Carlsbad, CA, USA) in HEK 293T cells. Forty-eight hours after transduction, the media were filtered with a 0.22 μm filter and used for infection. MDA-MB-468 cells were infected with specific shRNA viral-contained supernatant in the presence of polybrene (8 μg·mL−1). After 24 h incubation, the medium was replaced with complete medium containing puromycin (2 μg·mL−1). Cells were prepared for tests and harvested based on the experiment required.
Quantification of DNA methylation
Genomic DNA were extracted using the genomic DNA extraction kit (Real Genomics, Taipei, Taiwan), and was followed by nuclease S1 (New England Biolabs, Ipswich, MA, USA) and alkaline phosphatase (New England Biolabs) digestion. The methylated fraction of DNA was detected using the DNA methylation kit (Cayman).
Quantitative real-time reverse transcription PCR (Q-RT-PCR)
Total RNA was isolated from MDA-MB-468 cells treated with YC-1 and extracted using TRIzol Reagent (Invitrogen Corp.). cDNA was reverse-transcribed by oligo dT(15) using M-MLV reverse transcriptase (Invitrogen Corp.). Q-RT-PCR analysis was performed by a LightCycler 480 II RTPCR system (Roche Applied Sciences, Manheim, Germany) using the Fast Start DNA Master Plus SYBR Green I kit (Roche Applied Sciences). PCR primers are shown in Supporting Information Table S2. The level of mRNA expression was normalized to the level of GAPDH mRNA in the same sample. Determination of miRNA expression was performed using a stem-loop-like RT primer and PCR primer specific to the various miRNAs (Supporting Information Table S3). miRNA expression was normalized to U48 small nucleolar RNA in the same sample.
Ubiquitination assay
Cells were lysed with Mg2+ lysis/wash buffer (MLB) buffer (25 mM HEPES, pH 7.5, 150 mM NaCl, 1% v·v−1 Igepal CA-630, 10 mM MgCl2, 1 mM EDTA, 2% v·v−1 glycerol, 1 mM Na3VO4, 1 mM NaF, 1 mM phenylmethanesulfonyl fluoride (PMSF), 10 μg·mL−1 each of leupeptin, aprotinin and pepstatin A). After sonication, cell lysates were centrifuged at 12 000× g for 10 min at 4°C. Supernatants were incubated with anti-EZH2 (BD Biosciences) and protein A-Sepharose beads (GE Healthcare Life Sciences, Pittsburgh, PA, USA) overnight at 4°C. After being washed with MLB buffer, precipitated proteins were boiled in 1× Laemmli sample buffer and then separated with SDS-PAGE. The ubiquitination levels of EZH2 were determined using monoclonal antibody against ubiquitin.
Immunoprecipitation
Cells were lysed with RIPA buffer (50 mM Tris-HCl, pH 7.5, 1% Igepal CA-630, 150 mM NaCl, 1 mM EDTA, 1 mM Na3VO4, 1 mM NaF, 1 mM PMSF, 10 μg·mL−1 each of leupeptin, aprotinin and pepstatin A) for 30 min at 4°C. Cell lysate (1 mg) was incubated with anti-EZH2 or anti-c-Cbl and protein A-Sepharose beads, then gently rotated at 4°C overnight. Immune complexes were then precipitated and subjected to Western blotting.
MDA-MB-468 breast cancer xenograft animal model
Fifty-eight female nu/nu mice (4 weeks-old) were from the National Laboratory Animal Center, Taipei, Taiwan. Mice were maintained under the procedures and guidelines from the Institutional Animal Care and Use of the National Health Research Institutes. All experiments were conducted under the supervision of the Institutional Animal Care and Use Committee, China Medical University, Taichung, Taiwan. All studies involving animals are reported in accordance with the ARRIVE guidelines for reporting experiments involving animals (Kilkenny et al., 2012; McGrath et al., 2011). Animals in this study were maintained in the Experimental Animal Center, China Medical University, Taichung, Taiwan. Animals were housed in an isolated specific pathogen-free environment with a semi-natural light cycle of 12:12 h light : dark. Five mice were kept in one cage (L29 cm × W19 cm × H13 cm) with bedding. Cages were cleaned once a week. Room temperature range was kept between 22 and 26°C. The humidity was 45–65%. All animals were fed a commercial diet and sterile water. Food and water were provided ad libitum. MDA-MB-468 breast cancer cells (5 × 10⁶ cells per mouse) were suspended in 0.1 mL of Matrigel solution (50% v·v−1 Matrigel in PBS) and inoculated into the mammary fat pads of nude mice. When the tumour masses reached 100 mm3, the tumour-bearing mice were randomly divided into groups for treatments with different YC-1/YC-1-S doses. The mice were i.p. injected with YC-1 or administered YC-1-S p.o. Tumour size and mouse body weight were measured once every 3 days, and tumour volume (mm3) was calculated using the equation: length × (width)2 × 0.5. At the end of the experiments, mice were killed and tumour nodules were dissected and weighed. Tumour tissues were subjected to Western blotting.
Statistical analysis
All data are expressed as mean ± SEM of three independent experiments. Data for statistical difference and means were analysed using Student's t-test. P-values less than 0.05 were considered statistically significant (*P < 0.05, **P < 0.01).
Results
YC-1 inhibits proliferation of breast cancer cells
The effect of YC-1 on the viability of human breast cancer and normal mammary epithelial cells was first investigated using the MTT assay. YC-1 significantly reduced the viability of breast cancer cells in a concentration- and time-dependent manner (Figure 1A), whereas no effect was seen on the viability of normal mammary epithelial cells, 184A1 and MCF-10A (data not shown), demonstrating that YC-1 selectively affected breast cancer cells. MDA-MB-468 and SKBR3 cells were more sensitive to YC-1. The IC50 values for MDA-MB-468 and SKBR3 were 0.33 ± 0.01 μM and 0.73 ± 0.05 μM, respectively, after incubation for 72 h. Morphological observation revealed that YC-1 treatment caused breast cancer cell apoptosis with apoptotic characteristics, including cytoplasmic membrane blebbing and cell shrinkage (Figure 1B). To evaluate pro-apoptotic activation from exposure to YC-1, Western blotting was performed to detect the activation of caspases and PARP. Data showed that YC-1 caused the cleavage of caspase-8, -9, -3 and PARP in MDA-MB-468 and SKBR3 cells in a concentration-dependent manner (Figure 1C). Cell cycle distribution was assessed to determine whether YC–1-induced viability inhibition was associated with cell cycle alteration. Treatment with YC-1 significantly increased the sub-G1 cell population (5.7 vs. 13.4%; control vs. 6 h post-treatment) and decreased the G2/M phase population (Figure 1D). These results indicated that YC-1 induced apoptosis of breast cancer cells. Additionally, the antitumour capacity of YC-1 was evaluated by clonogenic activity, which indicated that YC-1 potently attenuated tumour formation (Figure 1E).
Figure 1.

YC-1 induces apoptosis of breast cancer cells. (A) Various breast cancer cell lines were treated with the indicated concentrations of YC-1 for 72 h. Cell viability was determined by the MTT method. (B) MDA-MB-468 and SKBR3 cells were treated with vehicle (DMSO, CTL) or YC-1 (MDA-MB-468: 3 μM for 12 h; SKBR3: 10 μM for 24 h). Changes in cell morphology in response to YC-1 were assessed by phase-contrast microscopy. (C) Cells were treated with the indicated concentrations of YC-1 for 24 h (MDA-MB-468) or 48 h (SKBR3). Cells were lysed and analysed for the indicated proteins by Western blotting. β-actin was used as a loading control. Blots are representative of results from three independent experiments. (D) MDA-MB-468 cells were treated with vehicle (DMSO, as control) or 3 μM YC-1 for 6 h. The cell cycles were analysed by flow cytometry. (E) MDA-MB-468 cells were treated with the indicated concentrations of YC-1 and then the clonogenic assay was conducted. Results are expressed as mean ± SEM of three independent experiments. **P < 0.01, compared with control.
YC-1 inhibits tumour growth in MDA-MB-468 xenograft animal model
In vivo antitumour activity of YC-1 was investigated in nude mice inoculated with MDA-MB-468 cells. MDA-MB-468 tumour-bearing mice were i.p. injected with 30 or 60 mg·kg−1 YC-1. As shown in Figure 2A (left), YC-1 inhibited MDA-MB-468 tumour growth in a dose-dependent manner. The effect of the prodrug formulation of YC-1, YC-1-S, in MDA-MB-468 tumour-bearing mice was also investigated. In vivo pharmacokinetic analysis revealed that YC-1-S was quickly converted into its active form. Mice were administered 20, 40 or 80 mg·kg−1 YC-1-S p.o. YC-1-S also displayed dose-dependent inhibition of MDA-MB468 tumour growth (Figure 2A, right). Both YC-1 and YC-1-S dose-dependently reduced tumour weight (Figure 2B). Moreover, the mean body weight of mice was not affected by YC-1 or YC-1-S compared with vehicle-treated groups (Figure 2C).
Figure 2.

Antitumour activity of YC-1 in MDA-MB-468 xenograft mouse model. MDA-MB-468 cells were used to inoculate nu/nu mice. (A, left) Tumour-bearing mice were given vehicle (10 μL DMSO) or YC-1 (30 or 60 mg·kg−1 day−1) by i.p. injection. (A, right) Tumour-bearing mice were given vehicle (normal saline) or YC-1-succinate (YC-1-S; 20, 40 or 80 mg·kg−1day−1) p.o. During the treatment period, tumour volume (A) and mouse body weight (C) were measured once every 3 days. Data are expressed as mean of tumour volume (mm3) ± SEM from six mice (YC-1 treatment) or 10 mice (YC-1-S treatment). *P < 0.05; **P < 0.01, compared with control.
YC-1 down-regulates EZH2 expression in breast cancer cells and in tumours from MDA-MB-468 xenograft animals
Polycomb group proteins play an important role in breast cancer progression (Bachmann et al., 2006; Collett et al., 2006; Kunju et al., 2011). In particular, EZH2 is regarded as a marker of aggressive malignancies, and it is strongly associated with disease progression (Kleer et al., 2003; Kunju et al., 2011). The effects of YC-1 on EZH2 levels in cells were next investigated. YC-1 displayed concentration-dependent suppression of EZH2 expression in both MDA-MB-468 and SKBR3 cells (Figure 3A). In MDA-MB-468 cells, YC-1 quickly reduced EZH2, and significant inhibition was detected at 2 h (∼18% inhibition; Figure 3B). Meanwhile, caspase-3 activation was detected at 4 h (Figure 3B). EZH1 was also inhibited by YC-1 (Figure 1A and B). However, H3K27me3, EZH2-downstream molecule, remained unchanged when cells were exposed to YC-1 (Figure 3A and B), even after 72 h of treatment (Supporting Information Fig. S1).
Figure 3.

YC-1 down-regulates EZH2 expression in breast cancer cells. (A and B) MDA-MB-468 (A and B) and SKBR3 (A) cells were treated with the indicated concentrations of YC-1 (MDA-MB-468: 24 h; SKBR3: 30 h; A) or 3 μM YC-1 for the indicated times (B). Cells were harvested and protein content analysed by Western blotting. The levels of EZH2 expression were quantified and are shown under the blots. MDA-MB-468 (C) and SKBR3 (D) cells were transfected with EZH2 shRNA for 0, 1, 2, 3 and 4 days, and collected for determination of cell viability (left) and protein level (right). (E and F) MDA-MB-468 cells were transfected with shRNA for 72 h, and then floating cells were removed by washing. Cells were then incubated with 3 μM YC-1 for 4 h and analysed for viability (E) and protein content (F). Results are expressed as mean ± SEM of three independent experiments. **P < 0.01, compared with control (shLuc). (G) Tumour specimens were isolated and protein was extracted for Western blotting. Results are expressed as mean ± SEM of six mice. **P < 0.01, compared with control.
Suppression of EZH2 expression inhibits the growth of breast tumours (Gonzalez et al., 2009; Du et al., 2012). To explore whether down-regulation of EZH2 contributes to the death of breast cancer cells, a specific shRNA was used to deplete EZH2 in MDA-MB-468 and SKBR3 cells. EZH2 knockdown caused significant reduction in the viability of both cell lines (Figure 3C and D). Furthermore, when cells were treated with YC-1 after EZH2 depletion, less reduction of cell viability and cleavage of caspase-3 and PARP were observed in EZH2-depleted cells compared with control shRNA (shLuc)-transfected cells (Figure 3E and F), indicating that knockdown of EZH2 significantly desensitized cells to pro-apoptotic induction by YC-1. YC-1 also decreased the EZH2 level in tumours from MDA-MB-468 xenograft mice (Figure 3G), showing that suppression of EZH2 accounts for the inhibition of tumour growth.
Treatment with YC-1 also decreased the expression of several PRC proteins in MDA-MB-468 cells, including SUZ12, RbAp48, Ring1A, Ring1B and Bmi1 (Supporting Information Fig. S2A and B). Knockdown of EZH2 attenuated YC–1-induced PRC protein down-regulation (Supporting Information Fig. S2C), suggesting that EZH2 has an important role in YC–1-induced PRC protein down-regulation. EZH2 target genes, CDKN1C, FOXC1 and RUNX3 (Fujii et al., 2008; Yang et al., 2009; Du et al., 2012), were examined in YC–1-treated MDA-MB-468 cells. CDNK1C and FOXC1 mRNA expression was increased after YC-1 treatment, whereas RUNX3 was unchanged (Supporting Information Fig. S3). EZH2 down-regulation by YC-1 was also examined under hypoxia. YC-1 showed an inhibition pattern that was similar in both cell viability and EZH2 level under normoxia and hypoxia (Supporting Information Fig. S4A and B).
EZH2 mediates DNA methylation by modulating the levels of DNMTs in YC–1-treated breast cancer cells
EZH2 mediates downstream effects though either H3K27me3 (Cao et al., 2002; Cao and Zhang, 2003) or direct recruitment of DNMTs to mediate the methylation of target genes (Hernandez-Munoz et al., 2005; Vire et al., 2006). YC-1 did not alter the level of H3K27me3 (Figure 3A and B). Thus, we examined the effect of YC-1 on DNMTs. YC-1 inhibited the expression of DNMT1 and DNMT3a in a concentration-dependent manner, whereas it had no effect on DNMT3b (Figure 4A). Knockdown of EZH2 also led to a decrease of DNMT1 and DNMT3a expression (Figure 4B). Immunoprecipitation showed that the association of EZH2 and DNMT1/DNMT3a was enhanced by YC-1 (Figure 4C). These data suggested that EZH2 may manipulate DNA methylation through regulation of DNMTs. Next, we evaluated global DNA methylation after YC-1 treatment. Both YC-1 and 5-azacytidine, a DNMT inhibitor, efficiently inhibited global DNA methylation (Figure 4D). Furthermore, EZH2 knockdown by shEZH2 modulated the effect of YC-1 on DNA methylation (Figure 4E). Taken together, these results suggested that YC-1 inhibited DNA methylation through EZH2-mediated down-regulation of DNMT1 and DNMT3a.
Figure 4.

YC-1 inhibits global DNA methylation through down-regulation of DNMTs. (A) MDA-MB-468 and SKBR3 cells were treated with the indicated concentrations of YC-1 for 24 h (MDA-MB-468) or 30 h (SKBR3). Cell lysates were prepared and analysed by Western blotting. (B) Cells were transfected with EZH2 shRNA for 72 h. Cells were collected and proteins were examined by Western blotting. (C) MDA-MB-468 cells were pretreated with 3 μM YC-1 in the presence of MG-132 (3 μM) for the indicated times. Cells were harvested and lysed for immunoprecipitation (IP) with antibody against EZH2. The results presented are representative of triplicate experiments. (D) Cells were treated with DMSO (CTL), YC-1 (MDA-MB-468: 3 μM for 6 h; SKBR3: 10 μM for 12 h), or 10 μM 5-azacytidine (Aza) for 24 h. Cells were harvested and DNA methylation was quantified (E) shEZH2 knockdown MDA-MB-468 cells were treated with 3 μM YC-1 for 4 h and analysed for DNA methylation. The values presented are the mean ± SEM from three independent experiments. **P < 0.01, compared with control.
YC-1 decreases the stability of EZH2 and enhances proteasome degradation of EZH2
To further establish the mechanism of YC-1 down-regulation of EZH2, the level of EZH2 expression was evaluated next. Q-RT-PCR indicated that YC-1 inhibited expression of EZH2 mRNA (Figure 5A), but YC-1 affected mRNA levels less than protein levels. The stability of EZH2 was next examined. Cells were treated with YC-1 in the presence of cycloheximide, an inhibitor of translation. As shown in Figure 5B, the degradation rate of EZH2 was accelerated in MDA-MB-468 cells treated with YC-1 (t1/2 = 6.6 ± 0.2 h) compared with vehicle-treated MDA-MB-468 cells (t1/2 = 14.8 ± 0.2 h, data not shown). YC-1 also promoted EZH2 degradation in SKBR3 cells (Figure 5C). Polycomb group proteins are degraded via a proteasome-dependent mechanism (Tan et al., 2007). To investigate the possibility of proteasome involvement, cells were treated with YC-1 in the presence or absence of a proteasome inhibitor (MG-132) or lysosome inhibitor (NH4Cl). MG-132 prevented EZH2 degradation caused by YC-1 treatment. MG-132 also reversed the reduction of MDA-MB-468 cell viability caused by YC-1 (Figure 5E). These findings suggested that YC–1-induced apoptosis related to EZH2 down-regulation was due to direct effects on the protein level, but not the mRNA level. To further implicate the involvement of the proteasome pathway, the levels of ubiquitinated EZH2 were assessed in cells treated with YC-1 for 0–8 h. In MDA-MB-468 cells, YC-1 induced a significant increase in EZH2 ubiquitination, which was observed as early as 2 h after stimulation with YC-1. The ubiquitination of EZH2 correlated negatively with EZH2 expression (Figure 5F). EZH2 ubiquitination induced by YC-1 was also observed in SKBR3 cells (Figure 5G). These results demonstrated that YC-1 post-translationally regulated EZH2 by increasing EZH2 ubiquitination and its subsequent proteasomal degradation.
Figure 5.

YC-1 enhances proteasome-dependent EZH2 degradation and ubiquitination in breast cancer cells. (A) Effect of YC-1 on EZH2 mRNA abundance in MDA-MB-468 cells. Cells were treated with 3 μM YC-1 for 3 or 6 h. Cells were collected for the detection of EZH2 mRNA expression with Q-RT-PCR. (B and C) Cells were pretreated with cycloheximide (30 μM) for 1 h and followed by induction with vehicle (DMSO) or YC-1 (3 μM) for the indicated times (MDA-MB-468, B) or 10 μM YC-1 for 16 h (SKBR3, C). Cells were harvested for detection of protein level by Western blotting. (D and E) MDA-MB-468 cells were incubated with 3 μM YC-1 for 6 h in the presence of vehicle, 3 μM MG-132, or 30 μM NH4Cl. Cells were harvested for detection of protein level (D) or assessment of viability (E). The EZH2 expression levels were quantified and are shown under the blot. Results are expressed as mean ± SEM of three independent experiments. *P < 0.05; **P < 0.01, compared with control. (F) After treatment with 3 μM YC-1 for the indicated times, MDA-MB-468 cells were lysed and subjected to the EZH2 ubiquitination assay. (G) After treatment with 10 μM YC-1 for 16 h, SKBR3 cells were collected for the EZH2 ubiquitination assay. Ub, ubiquitin.
Possible mechanisms of decreased EZH2 mRNA expression by YC-1 were also investigated. MicroRNAs (miRNAs), including miR-26a, miR-101 and miR-214, are negative regulators of EZH2 expression (Kleer et al., 2003; Cao et al., 2010; Derfoul et al., 2011). They can target the 3′-untranslated region of EZH2 by destabilizing transcripts or attenuating translation to inhibit its expression (Kleer et al., 2003; Cao et al., 2010). YC-1 treatment significantly increased miR-26a, miR-101, and miR-214 expression (Supporting Information Fig. S5), suggesting that YC-1 may inhibit EZH2 mRNA expression by increasing these miRNAs.
YC-1 inhibits EZH2 via the PKA and Src/Raf-1/ERK pathways
The possible signalling pathways involved in suppression of EZH2 by YC-1 were next investigated. YC-1 is an activator of cGMP and cAMP (Ko et al., 1994; Chang et al., 2002; Hwang et al., 2003). Therefore, YC-1 may inhibit EZH2 expression via a PKG- or PKA-dependent pathway in MDA-MB-468 cells. KT5720 (PKA inhibitor), KT5823 (PKG inhibitor), NS2028 (PKG inhibitor) and ODQ (soluble guanylyl cyclase inhibitor) were used to investigate the effects of YC-1 on EZH2 expression and cell viability. In contrast to KT5720, which significantly reversed the YC–1-induced inhibition of EZH2 expression and cell viability, KT5823, NS2028 and ODQ did not show these effects (Figure 6A). Furthermore, knockdown of the PKA catalytic domain by shRNA attenuated the down-regulation of EZH2 by YC-1 (Supporting Information Fig. S6).
Figure 6.

Involvement of PKA and ERK pathway in YC–1-induced EZH2 down-regulation in breast cancer cells. (A) Cells were pretreated with KT5720 (3 μM), KT5823 (3 μM), NS2028 (30 μM), or ODQ (30 μM) and then stimulated with YC-1 (3 μM) for 6 h. Cells were then collected for assessment of protein level by Western blotting (left) or viability (right). The EZH2 expression levels were quantified and are shown under the blot. (B) Cells were pre-incubated with DMSO (as control), PD98059 (10 μM), SB203580 (10 μM) or SP600125 (10 μM), followed by stimulation with 3 μM YC-1 for 6 h. Cells were collected and analysed for protein content (left) and cells viability (right). (C) Cells were induced by 3 μM YC-1 for 6 h in the presence of PD98059 or KT5720. Cells were then collected for the assessment of ERK phosphorylation by Western blotting. (D) Cells were treated with MG-132 (3 μM), PD98059 (10 μM) or KT5720 (3 μM) for 1 h before treatment with 3 μM YC-1. Six hours later, cells were harvested for the EZH2 ubiquitination assay. (E) Cells were pretreated with DMSO (as control), Bay-43–9006 (Bay, 10 μM), farnesyl thiosalicylic acid (FTS, 10 μM), Src inhibitor I (SrcI, 10 μM), and genistein (Gen, 10 μM), or AG1478 (AG, 10 μM) then incubated with YC-1 (3 μM) for 6 h. Cells were harvested and lysed for Western blotting (left) and assessment of viability (right). (F) Cells were induced by 3 μM YC-1 in the presence of the indicated inhibitors. Cells were lysed and subjected to the EZH2 ubiquitination assay. Results are expressed as mean ± SEM of three independent experiments. *P < 0.05; **P < 0.01, compared with control.
The activation of MAPK-related pathways is required for YC-1 to conduct anticancer activity in cancer cells (Hwang et al., 2003; Wu et al., 2008). Specific inhibitors, PD98059 (MEK inhibitor), SB203580 (p38 MAPK inhibitor), and SP600125 (JNK inhibitor) were used to test the role of MAPKs in EZH2 inhibition. Among these inhibitors, PD98059 almost completely abolished YC–1-mediated reduction of both EZH2 expression and viability of MDA-MB-468 cells (Figure 6B) and SKBR3 cells (Supporting Information Fig. S7A and B). Furthermore, YC-1 failed to suppress EZH2 and induce cell death while ERK protein was depleted (Supporting Information Fig. S8A). YC-1 treatment caused rapid phosphorylation/activation of ERK beginning at 2 h and reaching maximal activation at 6 h (Supporting Information Fig. S8B). KT5720 did not affect ERK phosphorylation (Figure 6C). The ubiquitination of EZH2 was blocked by KT5720 and PD98059 (Figure 6D). Taken together, these results indicate that YC-1 inhibited EZH2 expression through both the PKA- and ERK-mediated pathways.
The upstream signalling molecules of ERK were explored using the Raf-1 inhibitor (Bay-43–9006), Ras inhibitor (farnesyl thiosalicylic acid), Src inhibitor (SrcI) and broad tyrosine kinase inhibitor (genistein). The reduction of EZH2 expression and cell viability were attenuated by Bay-43–9006, SrcI and genistein (Figure 6E). Depletion of Raf-1 and Src by shRNA markedly modulated YC–1-induced inhibition of EZH2 expression (Supporting Information Fig. S8C and D). Treatment with YC-1 resulted in time-dependent phosphorylation/activation of Src, Raf-1, and MEK (Supporting Information Fig. S8E). Surprisingly, farnesyl thiosalicylic acid had no effect on YC–1-induced EZH2 inhibition (Figure 6E). Furthermore, YC-1 did not induce Ras activation in MDA-MB-468 cells (Supporting Information Fig. S8F). MDA-MB-468 cells are characterized as EGFR-predominant breast cancer cells (Nielsen et al., 2004), and a previous study revealed that YC-1 can inhibit EGFR expression in MDA-MB-468 cells (Cheng et al., 2012) and nasopharyngeal carcinoma (Hong et al., 2010). The role of EGFR in YC-1-inhibited EZH2 expression was further examined. Data showed that YC-1 rapidly induced EGFR phosphorylation and caused a significant decrease in EGFR level after 6 h of treatment (Supporting Information Fig. S9A). However, the levels of EZH2 inhibition by YC-1 were not affected by two EGFR inhibitors, AG1478 and gefitinib (Supporting Information Fig. S9B). Furthermore, Bay-43–9006, SrcI, and genistein significantly suppressed YC–1-induced EZH2 ubiquitination (Figure 6F).
The activation of Akt and CDK1 is associated with EZH2 inhibition and degradation (Cha et al., 2005; Wei et al., 2011; Wu and Zhang, 2011). However, LY294002, a PI3K inhibitor, did not reverse YC–1-induced EZH2 suppression (Supporting Information Fig. S10A). CDK1 phosphorylates EZH2 at Thr345 and Thr487 to promote EZH2 ubiquitination and subsequent proteasome degradation (Wei et al., 2011; Wu and Zhang, 2011). YC-1 induced the phosphorylation of CDK1, but inhibited the phosphorylation of EZH2 Tyr487 (Supporting Information Fig. S10B). Moreover, both CDK1 inhibitor, roscovitine and specific CDK1 shRNA failed to modulate EZH2 protein levels in response to YC-1 treatment (Supporting Information Fig. S10C and D). These data suggested that YC-1 may mediate the PKA and Src–Raf-1–MEK–ERK pathways to enhance EZH2 ubiquitination and its degradation.
YC-1 mediates c-Cbl to down-regulate EZH2 expression
PRAJA1 and Smurf2 have been identified to serve as EZH2 E3 ligases (Zoabi et al., 2011; Yu et al., 2013). However, no effect on EZH2 expression was found following cell treatment with PRAJA1 shRNA or Smurf2 shRNA (data not shown). There might be other ubiquitin ligases that are responsible for EZH2 degradation. A previous study showed that c-Cbl mediates the ubiquitination and degradation of EGFR (Ravid et al., 2004). Interestingly, EZH2 suppression and apoptotic activation by YC-1 were almost completely abolished when c-Cbl was depleted (Figure 7A). c-Cbl Tyr731 and Tyr774 underwent rapid phosphorylation after 1 h of YC-1 treatment (Figure 7B). The levels of c-Cbl were decreased by YC-1 (Figure 7B). This inhibition of c-Cbl could be reversed by MG-132, but not by NH4Cl (Figure 7C). Furthermore, YC-1 induced the formation of the EZH2–c-Cbl–ERK complex 1 h after induction and reached a maximum at 2 h (Figure 7D), which coincided with c-Cbl phosphorylation. This complex was disrupted by treatment with MEK inhibitor, PD98059 (Figure 7E). These data demonstrated that YC-1 led to activation of c-Cbl followed by ERK activation, then complex formation with EZH2, resulting in EZH2 ubiquitination and proteasome degradation.
Figure 7.

YC-1 activates c-Cbl to mediate EZH2 down-regulation in breast cancer cells. (A) c-Cbl-knockdown cells were treated with YC-1 (MDA-MB-468: 3 μM for 4 h; SKBR3: 10 μM for 10 h). Cells were harvested for detection of protein level by Western blotting. The EZH2 expression levels were quantified and are shown under the blots. (B) MDA-MB-468 cells were treated with 3 μM YC-1 for the indicated times. Cells were collected and c-Cbl phosphorylation was detected. (C) MDA-MB-468 cells were pretreated with MG-132 (3 μM) or NH4Cl (30 μM) for 1 h followed by 3 μM YC-1 induction for 6 h and c-Cbl was detected by Western blotting. (D) MDA-MB-468 cells were pretreated with MG-132 and then induced by 3 μM YC-1 for the indicated times. Cells were harvested and lysed for the immunoprecipitation assay. The association among c-Cbl, ERK and EZH2 was determined by Western blotting and probing with anti-EZH2, anti-ERK or anti-c-Cbl. Membranes were stripped and reprobed with anti-c-Cbl or anti-EZH2 to check the input. (E) Cells were pre-incubated with or without PD98059 (PD, 10 μM) in the presence of MG-132 for 1 h before treatment with 3 μM YC-1 for 2 h. Cells were then collected and the c-Cbl-EZH2 complexes were detected in the lysate protein.
Discussion and conclusions
EZH2 is aberrantly expressed in aggressive and metastatic breast cancer cells, and it is highly positively correlated with recurrence or metastasis of TNBC (Hussein et al., 2012). Depletion of EZH2 reduces cell proliferation of breast cancer cells, MDM-MB-231 and CAL51 (Gonzalez et al., 2009). Consistent with this, knockdown of EZH2 by shRNA also reduced the viability of MDA-MB-468 and SKBR3 cells. Both our in vitro cell study and in vivo animal model demonstrated that YC-1 markedly and dose-dependently inhibited EZH2 expression. In addition to EZH2, YC-1 also down-regulated other PRC proteins, EZH1, SUZ12, RbAp48, Ring1A, Ring1B and Bmi1. The levels of PRC2 proteins are partly dependent on the presence of other components in the core complex (Pasini et al., 2004; Montgomery et al., 2005) and can be co-regulated by Bmi1, a main PRC1 component (Hernandez-Munoz et al., 2005). shEZH2 treatment decreased SUZ12 and Bmi1 and resulted in the attenuation of other PRC components (RbAp48, Ring1A and Ring1B) inhibited by YC-1. These data demonstrate that EZH2 plays a critical role in YC–1-mediated down-regulation of PRC protein level and inhibition of breast cancer cell proliferation. In addition to EZH2, deregulation of other PRC members, such as Bmi1 and SUZ12, has been correlated with breast cancer pathogenesis (Iliopoulos et al., 2010; Guo et al., 2011). YC-1 co-suppressed Bmi1 and SUZ12, as well as other PRC components, thus suggesting it has therapeutic potential for breast cancer.
H3K27me3 and DNMTs are important mediators for regulation of expression by EZH2 through gene promoters and methylation (Cao et al., 2002; Cao and Zhang, 2003; Hernandez-Munoz et al., 2005; Vire et al., 2006). EZH2 depletion inhibits the expression of DNMT1 and DNMT3a in human osteosarcoma U2OS cells (Vire et al., 2006), which was also observed in MDA-MB-468 and SKBR3 cells. Our results showed that YC-1 exerted its epigenetic effect by interacting with and down-regulating the expression of DNMT1 and DNMT3a. YC-1 enhanced DNMT degradation in a pattern similar to EZH2, through ERK-dependent and proteasome-mediated pathways (data not shown). Results of a global DNA methylation assay suggested that both the decline of EZH2 and DNMTs may lead to subsequent promoter demethylation and reactivation of silenced genes in YC–1-treated cells. EZH2 down-regulates RUNX3 by increasing H3K27me3 (Fujii et al., 2008). YC-1 failed to alter the RUNX3 mRNA level, which may indicate that YC-1 regulates epigenetic events in an H3K27me3-independent pathway in breast cancer cells.
Most actions of YC-1 are either cGMP-dependent or cAMP-mediated (Chang et al., 2002; Hsu et al., 2003; Hwang et al., 2003). Our data demonstrated that YC-1 inhibits EZH2 through a cAMP- or PKA-dependent mechanism. MAPK activation is another important element in YC-1's anticancer activities (Chang et al., 2002; Wu et al., 2008). Previous studies showed that the Raf–ERK pathway mainly affects EZH2 inhibition through gene transcription rather than protein degradation (Fujii et al., 2011). In this study, we found that YC-1 promoted EZH2 protein degradation through Raf-1/MEK/ERK activation.
Our data demonstrated that YC-1 mediates down-regulation of EZH2 mainly by enhancing its ubiquitination and degradation. Tan et al. (2007) showed that EZH2, SUZ12 and EED are degraded in a proteasome-dependent manner. YC-1 promoted EZH2 degradation by a proteasome-dependent pathway in both MDA-MB-468 and SKBR3 cells. Ubiquitination of EZH2 increased over time in response to YC-1, indicating that EZH2 inhibition results from ubiquitin ligase activation. Two EZH2 E3 ligases have been identified, PRAJA1 and Smurf2 (Zoabi et al., 2011; Yu et al., 2013). In our study, both E3 ubiquitin ligases were unrelated to YC–1-induced EZH2 degradation. In addition to EZH2, YC-1 predominately enhances EGFR down-regulation (Cheng et al., 2012). This may suggest that c-Cbl, a known EGFR E3 ubiquitin ligase (Ravid et al., 2004), plays a role in YC-1 function, including EZH2 degradation. Intriguingly, depletion of c-Cbl attenuated YC–1-induced EZH2 protein levels and apoptotic effects. These results suggest that c-Cbl could be responsible for EZH2 degradation in response to YC-1 treatment in MDA-MB-468 cells.
Cbl proteins are key regulators of the activation of receptor tyrosine kinases. Three Cbl proteins were identified in mammalian cells: c-Cbl, Cbl-b and Cbl-c (Swaminathan and Tsygankov, 2006). Cbl can be phosphorylated and activated by receptor tyrosine kinases (Swaminathan and Tsygankov, 2006). Cbl can positively and negatively regulate the activation of tyrosine kinases. c-Cbl contains phosphotyrosine-binding domains such as Src homology domain 2 and the proline-rich motif that allow interaction with receptor tyrosine kinases, such as EGFR, VEGFR-2, PDGFR, as well as downstream effectors, including the p85 subunit of PI3K, Src, Crk, and Grb2 for signal transduction and amplification (Andoniou et al., 1996; Schmidt and Dikic, 2005; Mohapatra et al., 2013). By carrying a RING finger motif and a putative leucine zipper, c-Cbl acts as a RING-type ubiquitin ligase. c-Cbl negatively regulates activated receptor tyrosine kinases by promoting their ubiquitination followed by lysosome- or proteasome-mediated degradation (Schmidt and Dikic, 2005; Mohapatra et al., 2013).
Phosphorylation of Tyr731 results in a conformational change of c-Cbl that releases the autoinhibition form, which is a critical step required for downstream protein ubiquitination (Dou et al., 2012), whereas Tyr774 phosphorylation is responsible for Crk/CrkL binding and signal amplification (Schmidt and Dikic, 2005). c-Cbl Tyr731 and Tyr774 underwent rapid phosphorylation upon YC-1 stimulation, and the maximum activation occurred at 1–2 h, which coincided with Src and ERK activation. c-Cbl activation drives the activation of MAPKs (Schmidt and Dikic, 2005; Swaminathan and Tsygankov, 2006). Our data showed that YC-1 induced the activation of c-Cbl and consequently activated Raf-1/MEK/ERK, which led to c-Cbl–ERK–EZH2 complex formation. This c-Cbl–ERK–EZH2 complex was disrupted by PD98059, demonstrating the importance of ERK in YC–1-induced c-Cbl activation and subsequent EZH2 degradation. Moreover, YC-1 also inhibited c-Cbl expression by promoting proteasome degradation. These results together elucidate the mechanism of antitumour activity of YC-1 in MDA-MB-468 cells. Upon YC-1 induction, c-Cbl underwent rapid phosphorylation followed by Src/Raf-1/ERK pathway activation. Activated ERK promoted the recruitment of EZH2 and activated c-Cbl, inducing the coordinated degradation of EZH2 and c-Cbl in the proteasome (Figure 8). Additionally, YC-1 induced EGFR degradation in a proteasome-dependent manner, and the depletion of c-Cbl attenuated YC–1-induced EGFR inhibition (data not shown), which indicated that YC-1 also mediated c-Cbl to promote EGFR degradation. c-Cbl functions as a proto-oncogene, which is related to tumourigenesis in breast cancer (Kang et al., 2012). The YC–1-induced c-Cbl suppression may also contribute to antitumour activity in MDA-MB-468 cells.
Figure 8.
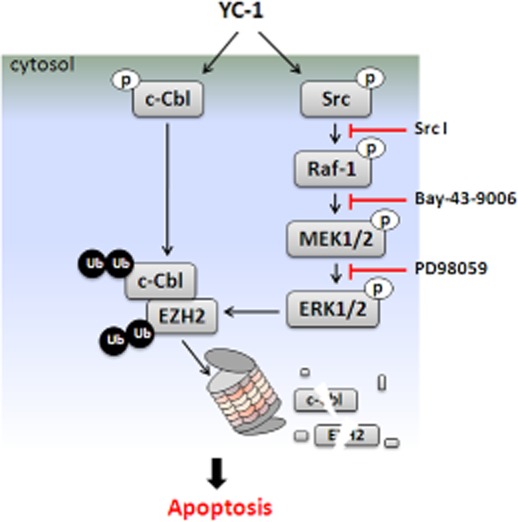
Model shows how YC-1 promotes EZH2 degradation and inhibits proliferation of breast cancer cells.
In conclusion, our study revealed that EZH2 down-regulation is involved in the antitumour activity of YC-1 in breast cancer cells, and this down-regulation is achieved by the activation of c-Cbl in collaboration with ERK.
Acknowledgments
This work was supported by a National Science Council of the Republic of China grant (NSC101–2325-B-039-005 and NSC101–2320-B-039-008 to S. C. K.; NSC101–2321-B-039-004 to Y. L. Y.) and a National Health Research Institute of the Republic of China grant (NHRI-EX102-10245BI to Y.L. Y.).
Glossary
- Bmi1
B cell-specific Moloney murine leukemia virus integration site 1
- Cbl
castias B-lineage lymphoma
- CDK1
cyclin-dependent kinase 1
- DNMT
DNA methyltransferase
- EED
embryonic ectoderm development
- EZH
enhancer of zeste homology
- H3K27me3
histone 3 lysine 27 trimethylation
- PRC
polycomb repressive complex
- RbAp48
retinoblastoma-associated protein 48
- SUZ12
suppressor of zeste 12
- TNBC
triple-negative breast cancer
- YC-1-S
YC-1-succinate
Author contributions
Conceived and designed the experiments: L. C. C., Y. L. Y. and S. C. K. Performed the experiments: L. C. C. and H. Y. L. Analysed the data: L. C. C. and H. Y. L. Contributed reagents/materials/analysis tools: M. T. T., R. H. C., F. Y. L., H. Y. H. and L. J. H. Wrote the paper: L. C. C., S. C. K. and Y. L. Y.
Conflict of interest
None.
Supporting Information
Additional Supporting Information may be found in the online version of this article at the publisher's web-site:
Figure S1 Effects of YC-1 and DZNep on EZH2 and H3K27me3 expression in MDA-MB-468 cells. Cells were treated with the indicated concentrations of YC-1 or DZNep for 72 h. Cells were collected, and protein levels were assessed by Western blotting.
Figure S2 Effects of YC-1 on PRC protein expression in MDA-MB-468 breast cancer cells. Cells were treated with the indicated concentrations of YC-1 for 24 h (A) or with 3 μM YC-1 for the indicated times (B). (C) EZH2 knockdown MDA-MB-468 cells were treated with 3 μM YC-1 for 4 h. Cells were harvested and used for Western blotting.
Figure S3 Effects of YC-1 on CDKN1C, FOXC1 and RUNX3 expression. MDA-MB-468 cells were treated with 3 μM YC-1 for the indicated times. Cells were harvested for Q-RT-PCR. The values presented are the mean ± SEM from three independent experiments. **P < 0.05; **P < 0.01, compared with control.
Figure S4 Effects of YC-1 on EZH2 expression under normoxia and hypoxia. (A) MDA-MB-468 breast cancer cells were incubated with the indicated concentrations of YC-1 for 24 h under normoxia or hypoxia. Cells were collected for assessment of viability by MTT assay. (B) Cells were stimulated with vehicle (DMSO, as control), 1 or 3 μM YC-1 for 9 h under normoxia or hypoxia. Cells were harvested and analysed by Western blotting to determine EZH2, HIF-1α and β-actin expression. Results are expressed as mean ± SEM of three independent experiments. **P < 0.01, compared with control.
Figure S5 YC-1 increases miR-26a, miR-101, and miR-214 expression. MDA-MB-468 cells were treated with 3 μM YC-1 for the indicated times. Cells were collected to determine miRNA expression. The values presented are the mean ± SEM from three independent experiments. *P < 0.05; **P < 0.01, compared with control.
Figure S6 Involvement of PKA in YC–1-induced inhibition of EZH2 expression. After 3 days of PKA knockdown, cells were induced with 3 μM YC-1 for 4 h. Cells were harvested and then analysed by Western blotting. The levels of EZH2 expression were quantified and are shown under the top blot.
Figure S7 YC-1 down-regulates EZH2 through the ERK pathway in SKBR3 breast cancer cells. Cells were pre-incubated with DMSO (as control), PD98059 (PD, 10 μM), SB203580 (SB, 10 μM) or SP600125 (SP, 10 μM) followed by induction with 10 μM YC-1 for 24 h. Cells were collected and then analysed by Western blotting (A) and for viability (B). Results are expressed as mean ± SEM of three independent experiments. **P < 0.01, compared with the control group.
Figure S8 YC-1 induces EZH2 down-regulation through the ERK pathway in MDA-MB-468 breast cancer cells. (A) p44/42 MAPK-knockdown cells were treated with 3 μM YC-1 for 4 h and then analysed by Western blotting. (B) Cells were treated with 3 μM YC-1 for the indicated times. Cells were harvested for detection of protein phosphorylation by Western blotting. (C and D) MDA-MB-468 cells were transfected with shRNA directed to Raf-1 (C) or Src (D). After stimulation with 3 μM YC-1 for 4 h, cell proteins were analysed by Western blotting. (E) Cells were incubated with 3 μM YC-1 for the indicated times and then lysed for detection of Src, Raf-1 and MEK activation using specific antibodies. (F) Cells were treated with 3 μM YC-1 for the indicated times. Cells were lysed and Ras activation was detected using Raf-RBD-conjugated agarose to pull down Ras-GTP. The total Ras in the cell lysate was also detected.
Figure S9 Effect of the EGFR pathway in YC–1-induced down-regulation of EZH2. (A) Cells were incubated with 3 μM YC-1 for the indicated times. (B) Cells were incubated in 3 μM YC-1 for 6 h with or without EGFR inhibitors, AG1478 (AG, 10 μM) or gefitinib (Gef, 10 μM). Cells were harvested and then analysed by Western blotting.
Figure S10 Activation of Akt and CDK1 were not involved in YC–1-induced down-regulation of EZH2 expression. (A) MDA-MB-468 breast cancer cells were pretreated with LY294002 (LY, 10 μM) for 1 h followed by induction by 3 μM YC-1 for 6 h. Cells were harvested for the detection of proteins by Western blotting. (B) MDA-MB-468 cells were incubated with 3 μM YC-1 for the indicated times. Cells were harvested for the detection of phospho-CDK1 (Thr161), CDK1, phospho-EZH2 (Tyr487), EZH2 and PCNA expression by Western blotting. EZH2 phosphorylation levels were calculated by phospho-EZH2 normalized to total EZH2. Results are expressed as mean ± SEM of three independent experiments. *P < 0.05, compared with control. (C) Cells were treated with YC-1 for 6 h in the absence or presence of roscovitine (Rosc, 20 μM). Cells were harvested and analysed by Western blotting for protein expression. (D) CDK1 was knocked down in MDA-MB-468 cells induced with 3 μM YC-1 for 4 h, and proteins were analysed by Western blotting.
Table S1 shRNA used in this study.
Table S2 Primer sequences used for qRT-PCR.
Table S3 Primer sequences used for miRNAs.
References
- Andoniou CE, Thien CB, Langdon WY. The two major sites of cbl tyrosine phosphorylation in abl-transformed cells select the crkL SH2 domain. Oncogene. 1996;12:1981–1989. [PubMed] [Google Scholar]
- Alexander SPH, Benson HE, Faccenda E, Pawson AJ, Sharman JL, Spedding M, Peters JA, Harmar AJ CGTP Collaborators. The Concise Guide to PHARMACOLOGY 2013/14: Catalytic receptors. Br J Pharmacol. 2013;170:1676–1705. doi: 10.1111/bph.12449. [DOI] [PMC free article] [PubMed] [Google Scholar]
- Bachmann IM, Halvorsen OJ, Collett K, Stefansson IM, Straume O, Haukaas SA, et al. EZH2 expression is associated with high proliferation rate and aggressive tumor subgroups in cutaneous melanoma and cancers of the endometrium, prostate, and breast. J Clin Oncol. 2006;24:268–2673. doi: 10.1200/JCO.2005.01.5180. [DOI] [PubMed] [Google Scholar]
- Cao P, Deng Z, Wan M, Huang W, Cramer SD, Xu J, et al. MicroRNA-101 negatively regulates Ezh2 and its expression is modulated by androgen receptor and HIF-1α/HIF-1β. Mol Cancer. 2010;9:108–119. doi: 10.1186/1476-4598-9-108. [DOI] [PMC free article] [PubMed] [Google Scholar]
- Cao R, Zhang Y. The functions of E(Z)/EZH2-mediated methylation of lysine 27 in histone H3. Curr Opin Genet Dev. 2003;14:155–164. doi: 10.1016/j.gde.2004.02.001. [DOI] [PubMed] [Google Scholar]
- Cao R, Wang L, Wang H, Xia L, Erdjument-Bromage H, Tempst P, et al. Role of histone H3 lysine 27 methylation in polycomb-group silencing. Science. 2002;298:1039–1043. doi: 10.1126/science.1076997. [DOI] [PubMed] [Google Scholar]
- Cha TL, Zhou BP, Xia W, Wu Y, Yang CC, Chen CT, et al. Akt-mediated phosphorylation of EZH2 suppresses methylation of lysine 27 in histone H3. Science. 2005;310:306–310. doi: 10.1126/science.1118947. [DOI] [PubMed] [Google Scholar]
- Chang MS, Lee WS, Teng CM, Lee HM, Sheu JR, Hsiao G, et al. YC-1 increases cyclo-oxygenase-2 expression through protein kinase G- and p44/42 mitogen-activated protein kinase-dependent pathways in A549 cells. Br J Pharmacol. 2002;136:558–567. doi: 10.1038/sj.bjp.0704777. [DOI] [PMC free article] [PubMed] [Google Scholar]
- Cheng Y, Li W, Liu Y, Cheng HC, Ma J, Qiu L. YC-1 exerts inhibitory effects on MDA-MB-468 cancer cells by targeting EGFR in vitro and in vivo under normoxic condition. Chin J Cancer. 2012;31:248–256. doi: 10.5732/cjc.011.10383. [DOI] [PMC free article] [PubMed] [Google Scholar]
- Collett K, Eide GE, Arnes J, Stefansson IM, Eide J, Braaten A, et al. Expression of enhancer of zeste homologue 2 is significantly associated with increased tumor cell proliferation and is a marker of aggressive breast cancer. Clin Cancer Res. 2006;12:1168–1174. doi: 10.1158/1078-0432.CCR-05-1533. [DOI] [PubMed] [Google Scholar]
- Derfoul A, Juan AH, Difilippantonio MJ, Palanisamy N, Ried T, Sartorelli V. Decreased microRNA-214 levels in breast cancer cells coincides with increased cell proliferation, invasion and accumulation of the polycomb Ezh2 methyltranserase. Carcinogenesis. 2011;32:1607–1614. doi: 10.1093/carcin/bgr184. [DOI] [PMC free article] [PubMed] [Google Scholar]
- Dou H, Buetow L, Hock A, Sibbet GJ, Vousden KH, Huang DT. Structural basis for autoinhibition and phoshorylation-dependent activation of c-Cbl. Nat Struct Mol Biol. 2012;19:184–192. doi: 10.1038/nsmb.2231. [DOI] [PMC free article] [PubMed] [Google Scholar]
- Du J, Li L, Ou Z, Kong C, Zhang Y, Dong Z, et al. FOXC1, a target of polycomb, inhibits metastasis of breast cancer cells. Breast Cancer Res Treat. 2012;131:65–73. doi: 10.1007/s10549-011-1396-3. [DOI] [PubMed] [Google Scholar]
- Ellis L, Atadja PW, Johnston RW. Epigenetics in cancer. Target chromatin modifications. Mol Cancer Ther. 2009;8:1409–1420. doi: 10.1158/1535-7163.MCT-08-0860. [DOI] [PubMed] [Google Scholar]
- Fallahian F, Karami-Tehrani F, Salami S, Aghaei M. Cyclin GMP induced apoptosis via protein kinase G in oestrogen receptor-positive and -negative breast cancer cell lines. FEBS J. 2011;278:3360–3369. doi: 10.1111/j.1742-4658.2011.08260.x. [DOI] [PubMed] [Google Scholar]
- Fujii S, Ito K, Ito Y, Ochiai A. Enhancer of zeste homologue 2 (EZH2) down-regulates RUNX3 by increasing histone H3 methylation. J Biol Chem. 2008;283:17324–17332. doi: 10.1074/jbc.M800224200. [DOI] [PMC free article] [PubMed] [Google Scholar]
- Fujii S, Tokita K, Wada N, Ito K, Yamauchi C, Ito Y, et al. MEK-ERK pathway regulates EZH2 overexpression in association with aggressive breast cancer subtypes. Oncogene. 2011;30:4118–4128. doi: 10.1038/onc.2011.118. [DOI] [PubMed] [Google Scholar]
- Gluz O, Leidtke C, Gottschalk N, Pusztai L, Nitz U, Harbeck N. Triple-negative breast cancer-current status and future directions. Ann Oncol. 2009;20:1913–1927. doi: 10.1093/annonc/mdp492. [DOI] [PubMed] [Google Scholar]
- Gonzalez ME, Li X, Toy K, DuPrie M, Ventura AC, Banerjee M, et al. Downregulation of EZH2 decreases growth of estrogen receptor-negative invasive breast carcinoma and requires BRCA1. Oncogene. 2009;28:843–853. doi: 10.1038/onc.2008.433. [DOI] [PMC free article] [PubMed] [Google Scholar]
- Guo BH, Feng Y, Zhang R, Xu LH, Li MZ, Kung HF, et al. Bmi-1 promotes invasion and metastasis, and its elevated expression is correlated with an advanced stage of breast cancer. Mol Cancer. 2011;10:10. doi: 10.1186/1476-4598-10-10. [DOI] [PMC free article] [PubMed] [Google Scholar]
- Hernandez-Munoz I, Taghavi P, Kuijl C, Neefjes J, van Lohuizen M. Association of BMI1 with polycomb bodies is dynamic and requires PRC2/EZH2 and the maintenance DNA methyltransferase DNMT1. Mol Cell Biol. 2005;25:11047–11058. doi: 10.1128/MCB.25.24.11047-11058.2005. [DOI] [PMC free article] [PubMed] [Google Scholar]
- Hong B, Lui VW, Hui EP, Lu Y, Leung HS, Wong EY, et al. Reverse phase protein array identifies novel anti-invasion mechanisms of YC-1. Biochem Pharmacol. 2010;9:842–852. doi: 10.1016/j.bcp.2009.10.021. [DOI] [PubMed] [Google Scholar]
- Hsu HK, Juan SH, Ho PY, Liang YC, Lin CH, Teng CM, et al. YC-1 inhibits proliferation of human vascular endothelial cells through a cyclic GMP-independent pathway. Biochem Pharmacol. 2003;66:263–271. doi: 10.1016/s0006-2952(03)00244-2. [DOI] [PubMed] [Google Scholar]
- Hussein YR, Sood AK, Bandyopadhyay S, Albashiti B, Semaan A, Nahleh Z, et al. Clinical and biological relevance of enhancer of zeste homolog 2 in triple-negative breast cancer. Hum Pathol. 2012;43:1638–1644. doi: 10.1016/j.humpath.2011.12.004. [DOI] [PMC free article] [PubMed] [Google Scholar]
- Hwang TL, Hung HW, Kao SH, Teng CM, Wu CC, Cheng SJ. Soluble guanylyl cyclase activator YC-1 inhibits human neutrophil functions through a cGMP-independent but cAMP-dependent pathway. Mol Pharmacol. 2003;64:1419–1427. doi: 10.1124/mol.64.6.1419. [DOI] [PubMed] [Google Scholar]
- Iliopoulos D, Lindahl-Allen M, Polytarchou C, Hirsch HA, Tsichlis PN, Struhl K. Loss of miR-200 inhibition of Suz12 leads to polycomb-mediated repression required for the formation and maintenance of cancer stem cells. Mol Cell. 2010;39:761–772. doi: 10.1016/j.molcel.2010.08.013. [DOI] [PMC free article] [PubMed] [Google Scholar]
- Kang JM, Park S, Kim SJ, Hong HY, Jeong J, Kim HS, et al. Cbl enhances breast tumor formation by inhibiting tumor suppressive activity of TGF-β signaling. Oncogene. 31:5123–5131. doi: 10.1038/onc.2012.18. [DOI] [PubMed] [Google Scholar]
- Kilkenny C, Browne W, Cuthill IC, Emerson M, Altman DG. Animal research: Reporting in vivo experiments: the ARRIVE guidelines. Br J Pharmacol. 2010;160:1577–1579. doi: 10.1111/j.1476-5381.2010.00872.x. [DOI] [PMC free article] [PubMed] [Google Scholar]
- Kleer CG, Cao Q, Varambally S, Shen R, Ota I, Tomlins SA, et al. EZH2 is a marker of aggressive breast cancer and promotes neoplastic transformation of breast epithelial cells. Proc Natl Acad Sci U S A. 2003;100:11606–11611. doi: 10.1073/pnas.1933744100. [DOI] [PMC free article] [PubMed] [Google Scholar]
- Ko FN, Wu CC, Kuo SC, Lee FY, Teng CM. YC-1, a novel activator of platelet guanylate cyclase. Blood. 1994;84:4226–4233. [PubMed] [Google Scholar]
- Kunju LP, Cookingham C, Toy KA, Chen W, Sabel MS, Kleer CG. EZH2 and ALDH-1 mark breast epithelium at risk for breast cancer development. Mod Pathol. 2011;24:786–793. doi: 10.1038/modpathol.2011.8. [DOI] [PMC free article] [PubMed] [Google Scholar]
- Lau CK, Yang ZF, Lam SP, Lam CT, Ngai P, Tam KH, et al. Inhibition of Stat3 activity by YC-1 enhances chemo-sensitivity in hepatocellular carcinoma. Cancer Biol Ther. 2007;6:1900–1907. doi: 10.4161/cbt.6.12.4970. [DOI] [PubMed] [Google Scholar]
- Lee CS, Kim YJ, Kim W, Myung SC. Guanylate cyclase activator YC-1 enhances TRAIL-induced apoptosis in human epithelial ovarian carcinoma cells via activation of apoptosis-related proteins. Basic Clin Pharmacol Toxicol. 2011;109:283–291. doi: 10.1111/j.1742-7843.2011.00717.x. [DOI] [PubMed] [Google Scholar]
- Lin NU, Vanderplas A, Hughes ME, Theriault RL, Edge SB, Wong YN, et al. Clinicopathologic features, patterns of recurrence, and survival among women with triple-negative breast cancer in the National Comprehensive Cancer Network. Cancer. 2012;118:5463–5472. doi: 10.1002/cncr.27581. [DOI] [PMC free article] [PubMed] [Google Scholar]
- Liu YN, Pan SL, Peng CY, Guh JH, Huang DM, Chang YL, et al. YC-1 [3-(5′-hydroxymethyl-2′-furyl)-1-benzyl indazole] inhibits neointima formation in balloon-injured rat carotid through suppression of expressions and activities of matrix metalloproteinases 2 and 9. J Pharmacol Exp Ther. 2006;316:35–41. doi: 10.1124/jpet.105.090563. [DOI] [PubMed] [Google Scholar]
- Margueron R, Reinberg D. The polycomb complex PRC2 and its mark in life. Nature. 469:343–349. doi: 10.1038/nature09784. [DOI] [PMC free article] [PubMed] [Google Scholar]
- McGrath J, Drummond G, McLachlan E, Kilkenny C, Wainwright C. Guidelines for reporting experiments involving animals: the ARRIVE guidelines. Br J Pharmacol. 2010;160:1573–1576. doi: 10.1111/j.1476-5381.2010.00873.x. [DOI] [PMC free article] [PubMed] [Google Scholar]
- Mohapatra B, Ahmad G, Nadeau S, Zutshi N, An W, Scheffe S, et al. Protein tyrosine kinase regulation by ubiquitination: critical roles of Cbl-family ubiquitin ligases. Biochim Biophys Acta. 2013;1833:122–139. doi: 10.1016/j.bbamcr.2012.10.010. [DOI] [PMC free article] [PubMed] [Google Scholar]
- Montgomery ND, Yee D, Chen A, Kalantry S, Chamberlain SJ, Otte AP, et al. The murine polycomb group protein Eed is required for global histone H3 lysine-27 methylation. Curr Biol. 2005;15:942–947. doi: 10.1016/j.cub.2005.04.051. [DOI] [PubMed] [Google Scholar]
- Nielsen TO, Hsu FD, Jensen K, Cheang M, Karaca G, Hu Z, et al. Immunohistochemical and clinical characterization of the basal-like subtype of invasive breast carcinoma. Clin Cancer Res. 2004;10:5367–5374. doi: 10.1158/1078-0432.CCR-04-0220. [DOI] [PubMed] [Google Scholar]
- Pan SL, Guh JH, Peng CY, Wang SW, Chang YL, Cheng FC, et al. YC-1 [3-(5′-hydroxymethyl-2′-furyl)-1-benzyl indazole] inhibits endothelial cell functions induced by angiogenic factors in vitro and angiogenesis in vivo models. J Pharmacol Exp Ther. 2005;314:35–42. doi: 10.1124/jpet.105.085126. [DOI] [PubMed] [Google Scholar]
- Pasini D, Bracken AP, Jensen MR, Lazzerini Denchi E, Helin K. Suz12 is essential for mouse development and for EZH2 histone methyltransferase activity. EMBO J. 2004;23:4061–4071. doi: 10.1038/sj.emboj.7600402. [DOI] [PMC free article] [PubMed] [Google Scholar]
- Rajasekhar VK, Begemann M. Roles of polycomb group proteins in development and disease: a stem cell perspective. Stem Cells. 2007;25:2498–2510. doi: 10.1634/stemcells.2006-0608. [DOI] [PubMed] [Google Scholar]
- Ravid T, Heidinger JM, Gee P, Khan EM, Goldkorn T. c-Cbl-mediated ubiquitinylation is required for epidermal growth factor receptor exit from the early endosomes. J Biol Chem. 2004;279:37153–37162. doi: 10.1074/jbc.M403210200. [DOI] [PubMed] [Google Scholar]
- Schmidt MH, Dikic I. The Cbl interactome and its functions. Nat Rev Mol Cell Biol. 2005;6:907–918. doi: 10.1038/nrm1762. [DOI] [PubMed] [Google Scholar]
- Siegel R, Naishadham D, Jemal A. Cancer Statistics, 2013. CA Cancer J Clin. 2013;63:11–30. doi: 10.3322/caac.21166. [DOI] [PubMed] [Google Scholar]
- Swaminathan G, Tsygankov AY. The Cbl family proteins: ring leaders in regulation of cell signaling. J Cell Physiol. 2006;209:21–43. doi: 10.1002/jcp.20694. [DOI] [PubMed] [Google Scholar]
- Tan J, Yang X, Zhuang L, Jiang X, Chen W, Lee PL, et al. Pharmacologic disruption of polycomb-repressive complex 2-mediated gene repression selectively induces apoptosis in cancer cells. Genes Dev. 2007;21:1050–1063. doi: 10.1101/gad.1524107. [DOI] [PMC free article] [PubMed] [Google Scholar]
- Vire E, Brenner C, Deplus R, Blanchon L, Fraga M, Didelot C, et al. The polycomb group protein EZH2 directly controls DNA methylation. Nature. 2006;439:871–874. doi: 10.1038/nature04431. [DOI] [PubMed] [Google Scholar]
- Wei Y, Chen YH, Li LY, Lang J, Yeh SP, Shi B, et al. CDK1-dependent phosphorylation of EZH2 suppresses methylation of H3K27 and promotes osteogenic differentiation of human mesenchymal stem cells. Nat Cell Biol. 2011;13:87–94. doi: 10.1038/ncb2139. [DOI] [PMC free article] [PubMed] [Google Scholar]
- Wu SC, Zhang Y. Cyclin-dependent kinase 1 (CDK1)-mediated phosphorylation of enhancer of zeste 2 (Ezh2) regulates its stability. J Biol Chem. 2011;286:28511–28519. doi: 10.1074/jbc.M111.240515. [DOI] [PMC free article] [PubMed] [Google Scholar]
- Wu SY, Pan SL, Chen TH, Liao CH, Huang DY, Guh JH, et al. YC-1 induces apoptosis of human renal carcinoma A498 cells in vitro and in vivo through activation of the JNK pathway. Br J Pharmacol. 2008;155:505–513. doi: 10.1038/bjp.2008.292. [DOI] [PMC free article] [PubMed] [Google Scholar]
- Yang X, Karuturi R, Sun F, Aau M, Yu K, Shao R, et al. CDKN1C (p57) is a direct target of EZH2 and suppressed by multiple epigenetic mechanisms in breast cancer cells. PLoS ONE. 2009;4:e5011. doi: 10.1371/journal.pone.0005011. [DOI] [PMC free article] [PubMed] [Google Scholar]
- Yu YL, Chou RH, Shyu WC, Hsieh SC, Wu CS, Chiang SY, et al. Smurf2-mediated degradation of EZH2 enhances neuron differentiation and improves functional recovery after ischaemic stroke. EMBO Mol Med. 2013;5:531–547. doi: 10.1002/emmm.201201783. [DOI] [PMC free article] [PubMed] [Google Scholar]
- Zoabi M, Sadeh R, de Bie P, Marquez VE, Ciechanover A. PRAJA1 is an ubiquitin ligase for the polycomb repressive complex 2 proteins. Biochem Biophys Res Commun. 2011;408:393–398. doi: 10.1016/j.bbrc.2011.04.025. [DOI] [PubMed] [Google Scholar]
Associated Data
This section collects any data citations, data availability statements, or supplementary materials included in this article.
Supplementary Materials
Figure S1 Effects of YC-1 and DZNep on EZH2 and H3K27me3 expression in MDA-MB-468 cells. Cells were treated with the indicated concentrations of YC-1 or DZNep for 72 h. Cells were collected, and protein levels were assessed by Western blotting.
Figure S2 Effects of YC-1 on PRC protein expression in MDA-MB-468 breast cancer cells. Cells were treated with the indicated concentrations of YC-1 for 24 h (A) or with 3 μM YC-1 for the indicated times (B). (C) EZH2 knockdown MDA-MB-468 cells were treated with 3 μM YC-1 for 4 h. Cells were harvested and used for Western blotting.
Figure S3 Effects of YC-1 on CDKN1C, FOXC1 and RUNX3 expression. MDA-MB-468 cells were treated with 3 μM YC-1 for the indicated times. Cells were harvested for Q-RT-PCR. The values presented are the mean ± SEM from three independent experiments. **P < 0.05; **P < 0.01, compared with control.
Figure S4 Effects of YC-1 on EZH2 expression under normoxia and hypoxia. (A) MDA-MB-468 breast cancer cells were incubated with the indicated concentrations of YC-1 for 24 h under normoxia or hypoxia. Cells were collected for assessment of viability by MTT assay. (B) Cells were stimulated with vehicle (DMSO, as control), 1 or 3 μM YC-1 for 9 h under normoxia or hypoxia. Cells were harvested and analysed by Western blotting to determine EZH2, HIF-1α and β-actin expression. Results are expressed as mean ± SEM of three independent experiments. **P < 0.01, compared with control.
Figure S5 YC-1 increases miR-26a, miR-101, and miR-214 expression. MDA-MB-468 cells were treated with 3 μM YC-1 for the indicated times. Cells were collected to determine miRNA expression. The values presented are the mean ± SEM from three independent experiments. *P < 0.05; **P < 0.01, compared with control.
Figure S6 Involvement of PKA in YC–1-induced inhibition of EZH2 expression. After 3 days of PKA knockdown, cells were induced with 3 μM YC-1 for 4 h. Cells were harvested and then analysed by Western blotting. The levels of EZH2 expression were quantified and are shown under the top blot.
Figure S7 YC-1 down-regulates EZH2 through the ERK pathway in SKBR3 breast cancer cells. Cells were pre-incubated with DMSO (as control), PD98059 (PD, 10 μM), SB203580 (SB, 10 μM) or SP600125 (SP, 10 μM) followed by induction with 10 μM YC-1 for 24 h. Cells were collected and then analysed by Western blotting (A) and for viability (B). Results are expressed as mean ± SEM of three independent experiments. **P < 0.01, compared with the control group.
Figure S8 YC-1 induces EZH2 down-regulation through the ERK pathway in MDA-MB-468 breast cancer cells. (A) p44/42 MAPK-knockdown cells were treated with 3 μM YC-1 for 4 h and then analysed by Western blotting. (B) Cells were treated with 3 μM YC-1 for the indicated times. Cells were harvested for detection of protein phosphorylation by Western blotting. (C and D) MDA-MB-468 cells were transfected with shRNA directed to Raf-1 (C) or Src (D). After stimulation with 3 μM YC-1 for 4 h, cell proteins were analysed by Western blotting. (E) Cells were incubated with 3 μM YC-1 for the indicated times and then lysed for detection of Src, Raf-1 and MEK activation using specific antibodies. (F) Cells were treated with 3 μM YC-1 for the indicated times. Cells were lysed and Ras activation was detected using Raf-RBD-conjugated agarose to pull down Ras-GTP. The total Ras in the cell lysate was also detected.
Figure S9 Effect of the EGFR pathway in YC–1-induced down-regulation of EZH2. (A) Cells were incubated with 3 μM YC-1 for the indicated times. (B) Cells were incubated in 3 μM YC-1 for 6 h with or without EGFR inhibitors, AG1478 (AG, 10 μM) or gefitinib (Gef, 10 μM). Cells were harvested and then analysed by Western blotting.
Figure S10 Activation of Akt and CDK1 were not involved in YC–1-induced down-regulation of EZH2 expression. (A) MDA-MB-468 breast cancer cells were pretreated with LY294002 (LY, 10 μM) for 1 h followed by induction by 3 μM YC-1 for 6 h. Cells were harvested for the detection of proteins by Western blotting. (B) MDA-MB-468 cells were incubated with 3 μM YC-1 for the indicated times. Cells were harvested for the detection of phospho-CDK1 (Thr161), CDK1, phospho-EZH2 (Tyr487), EZH2 and PCNA expression by Western blotting. EZH2 phosphorylation levels were calculated by phospho-EZH2 normalized to total EZH2. Results are expressed as mean ± SEM of three independent experiments. *P < 0.05, compared with control. (C) Cells were treated with YC-1 for 6 h in the absence or presence of roscovitine (Rosc, 20 μM). Cells were harvested and analysed by Western blotting for protein expression. (D) CDK1 was knocked down in MDA-MB-468 cells induced with 3 μM YC-1 for 4 h, and proteins were analysed by Western blotting.
Table S1 shRNA used in this study.
Table S2 Primer sequences used for qRT-PCR.
Table S3 Primer sequences used for miRNAs.