Abstract
Functional interpretation of genomic variation is critical to understanding human disease but it remains difficult to predict the effects of specific mutations on protein interaction networks and the phenotypes they regulate. We describe an analytical framework based on multiscale statistical mechanics that integrates genomic and biophysical data to model the human SH2-phosphoprotein network in normal and cancer cells. We apply our approach to data in The Cancer Genome Atlas (TCGA) and test model predictions experimentally. We find that mutations in phosphoproteins often create new interactions but that mutations in SH2 domains result almost exclusively in loss of interactions. Some of these mutations eliminate all interactions but many cause more selective loss, thereby rewiring specific edges in highly connected subnetworks. Moreover, idiosyncratic mutations appear to be as functionally consequential as recurrent mutations. By synthesizing genomic, structural, and biochemical data our framework represents a new approach to the interpretation of genetic variation.
INTRODUCTION
TCGA and similar projects have generated extensive data on the mutational landscape of tumors1. To understand the functional consequences of these mutations it is necessary to ascertain how they alter protein-protein interaction (PPI) networks involved in regulating cellular phenotype. A wide spectrum of data are available on PPIs ranging from large-scale binding experiments2–4 to co-crystal studies. The interpretation of such data is hampered by the absence of an analytical framework for integrating diverse measurements and for modelling the effects of cancer mutations. Such a framework must jointly model the genetic heterogeneity of cancer and the biophysical determinants of PPI specificity at the level of individual protein domains, multi-domain proteins, and PPI networks. In this paper we describe such a multiscale statistical mechanical (MSM) framework focusing on the subset of PPIs involving protein interaction domains (PIDs) in which SH2 domains bind to phospho-tyrosine peptides. Such interactions are essential components of receptor-mediated signaling and their misregulation is known to play a role in cancer and other diseases5–8.
The first challenge in modeling PID networks is integrating diverse low-throughput (LT) and high-throughput (HT) assays. LT methods such as fluorescence polarization spectroscopy provide precise interaction data on a few dozen PIDs and ligands but cannot easily be scaled to the full proteome2, whereas HT array-based methods provide greater scale but suffer from systematic artefacts and high false positive/negative rates, resulting in datasets that only partly agree2. A second challenge is modelling the effects of mutations in proteins with multiple binding domains and/or multiple sites of phosphorylation9, a reality for most signaling proteins (e.g. the Crk oncoprotein). Existing methods are either limited to individual domains10–13 or insufficiently precise to discern the effects of single residue changes14,15.
The MSM framework we have developed combines genomic, binding, and structural data and reconciles inconsistencies within and among datasets to generate PID networks for normal and cancer cells. We develop a bottom-up first principles approach involving a single mathematical equation based on statistical mechanical ensembles that models domains, proteins, and networks and then apply it to the analysis of SH2 networks and mutations found in TCGA16. We validate newly predicted interactions experimentally and demonstrate the sensitivity of MSM to single-residue mutations that cause subtle changes in binding affinity. Our analysis provides mechanistic insights into an important PID cancer network and validates a computational approach to PID networks that can be applied to other signaling domains and other diseases.
RESULTS
Modeling and Data Integration
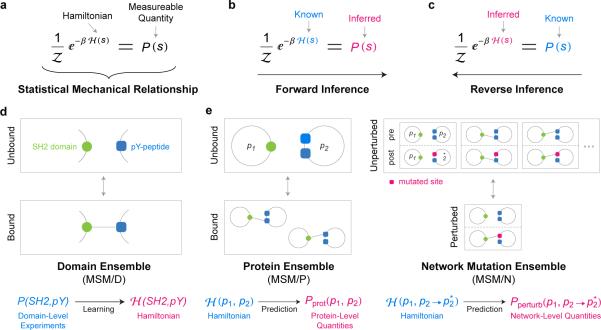
The theory of statistical mechanics relates the energy of a state of a system, such as a particular configuration of bound and free peptides and PIDs, to measurable thermodynamic quantities such as disassociation constants (Fig. 1a); from the energy it is also possible to compute the probability that a system will assume a particular state. When the function specifying the energy of a state—known as the Hamiltonian—is available, the mathematics of statistical mechanics can be used to compute thermodynamic properties directly (Fig. 1b). However, with complex systems such as proteins in solution, the Hamiltonian cannot be readily derived from first principles. In this work, we recast statistical mechanics as a machine learning problem and develop a reverse workflow in which measurements of thermodynamic quantities are used to derive a Hamiltonian for SH2/pY-peptide interactions17 (Fig. 1c). Importantly, statistical mechanics does not fully constrain the mathematical form of the Hamiltonian or the set of states—known as the ensemble—whose thermodynamic properties are being computed. We exploit this fact by choosing a form for the Hamiltonian that can model arbitrary SH2-peptide interactions, including mutated domains and unknown pY-peptides. This Hamiltonian is defined in terms of interactions between one residue in the peptide and one residue in the SH2 domain, ignoring multi-residue interactions and steric effects between residues in the same protein. Thus, it is more appropriately termed a pseudo-Hamiltonian.
Figure 1.
Multiscale Statistical Mechanical Framework. (a) Statistical mechanics establishes mathematical relationships between the energy of a state s of a system, known as the Hamiltonian H(s), and measurable thermodynamic quantities of that state, such as its probability of occurrence P(s). (b) In simple physical systems, the Hamiltonian is known, and the mathematics of statistical mechanics can be directly used to infer thermodynamic quantities. (c) Experimental data on thermodynamic quantities can be used in the reverse direction to infer the Hamiltonian (more precisely, a pseudo-Hamiltonian) using machine learning techniques. (d) In MSM, learning of the Hamiltonian is performed at the single domain level (MSM/D), by creating ensembles that correspond to bound and unbound SH2/pY-peptide complexes. (e) The learned Hamiltonian can be used to make predictions for more complex ensembles. At the whole protein level (MSM/P), ensembles comprise all physical binding configurations, accounting for the combinatorics of multiple domains and multiple phosphorylation sites. At the network and mutation level (MSM/N), ensembles comprise states that simultaneously represent the behavior of the PPI before and after a mutation is introduced. This selectively captures mutations that result in consequential changes to binding affinity (see Main Text, Supplementary Fig. 1, and Supplementary Note for more details).
We also exploit freedom in selecting ensembles. When learning the pseudo-Hamiltonian, an ensemble is comprised of the bound and unbound states of an SH2 domain and a single pY-peptide (Fig. 1d). Such domain-level ensembles correspond to readily available thermodynamic measurements and we can therefore utilize a wide variety of LT and HT data in inferring the pseudo-Hamiltonian (for a mathematical treatment see Supplementary Note and Supplementary Fig. 1 and 2). Subsequently, we use the pseudo-Hamiltonian to compute difficult-to-obtain thermodynamic quantities for ensembles of multi-domain proteins and multiply phosphorylated substrates (Fig. 1e). In principle, data on isolated domains, multi-domain proteins, and multiply phosphorylated proteins can be used in learning. In practice, virtually all experimental data relates to single domain-pY-peptide interactions. Thus ensemble theory allows us to circumvent limitations in available data to predict interactions involving the types of proteins that are actually found in signaling networks.
To perform learning we combine binding data from four HT datasets18–21 (“MacBeath”, “Jones”, “Nash”, and “Cesareni”), and a diverse set of LT data21 (Supplementary Table 1). The combined dataset spans 111 SH2 domains (out of 122 known; no data is available for 11 domains) and 5,016 pY-peptide sequences (the human proteome is estimated to contain ~37,000 pY sites lying in ~12,000 proteins22). Data were binarized, yielding a training set of ~20,000 positive and ~400,000 negative interactions. From this we learned the residue-residue energies of the pseudo-Hamiltonian by maximizing agreement between predicted and experimental affinities of domains. We also aligned SH2 domains with 25 SH2-peptide co-crystal structures and exploited the resulting spatial information by applying the well-established principle23 that selectivity is primarily determined by interacting residues in direct physical contact. Mathematically this principle is imposed by penalizing energy terms in proportion to the distance separating residues thereby assigning weaker energies to more distant interactions.
Domain Model Achieves High Accuracy and Reconciles Datasets
We evaluated the performance of the MSM domain model (MSM/D) using a nested cross-validation approach designed to prevent overfitting. Data were randomly divided into three parts, one for fitting residue interaction energies, one for fitting distance-dependent penalization, and one for model tests (Supplementary Fig. 3a). We compared MSM/D to two existing SH2 models (SMALI10 and PEPINT11) and to a general PPI method, PrePPI14, using a Receiver-Operator Characteristic (ROC) curve (Fig. 2a). Global and dataset-specific performance was evaluated by grouping HT data into four subsets based on the source. We also subdivided data by combining LT dataset with high-confidence interactions (i.e. those confirmed by two (“HC2”) and three (“HC3”) data sources). Data for high-confidence interactions were removed from the HT datasets to prevent cross-contamination during training.
Figure 2.
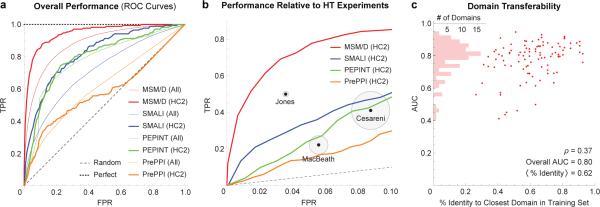
Assessment of Domain Model (MSM/D) Performance. (a) Receiver-Operator Characteristic (ROC) curves assessing the performance of MSM/D and other methods (SMALI, PEPINT, and PrePPI) in predicting the binding states of SH2-phosphopeptide interactions. ROC curves characterize a model's ability to predict SH2/pY-peptide interactions by computing the true positive rate (TPR) of predictions as a function of the false positive rate (FPR). A method that makes random guesses will produce a straight line with a slope of 1 (dashed black line) whereas a perfect method produces a constant TPR value of 1 (dotted black line). Tests were performed on the combined dataset (All) and a high-confidence subset (HC2). (b) A close up view of (a), showing the relative performance of high-throughput datasets. (c) The Areas Under the Curve (AUCs) of MSM/D on predicting held out SH2 domains are plotted as a function of the domains’ sequence identity to the closest homolog in the training set. A histogram of AUC values is overlaid on the y-axis.
We observed that MSM/D substantially outperforms existing methods in the “high precision” regime (False Positive Rate (FPR) = 0.001), yielding a True Positive Rate (TPR) 6 times higher than the best existing method across all data and >50 times higher for the HC2 subset (Fig. 2a). Integrating the area under the ROC curve (AUC) yields a single performance number and this too was substantially higher for MSM/D than existing models on all subsets of the data (Table 1). Relative performance was particularly high for “gold standard” subsets, with MSM/D achieving a nearly perfect score of 0.99 AUC on the HC3 dataset. The superiority of MSM/D relative to PrePPI does not take into account the latter's ability to model any protein; we include the comparison only to establish a baseline for general PPI methods. In addition, SMALI and PEPINT were trained on datasets only about 1/3 as large as for MSM/D; we therefore retrained MSM/D using ~1/3 of the available data (Supplementary Fig. 3e) and found that the retrained model attained ~97% of the maximum AUC, which remains substantially superior to SMALI and PEPINT. We also computed separate ROC and metaparameter sensitivity curves for each cross-validation set (Supplementary Fig. 3b-c). The curves overlapped almost perfectly, indicating that MSM/D is robust to variation in training data. We conclude that MSM/D is significantly better than available methods at modeling interactions between SH2 domains and pY-peptides.
Table 1.
Performance Breakdown (AUCs)
| Overall | MacBeath | Jones | Nash | Cesareni | LT + HC2 | HC2 | HC3 | |
|---|---|---|---|---|---|---|---|---|
| SMALI | 0.713 | 0.663 | 0.594 | 0.709 | 0.714 | 0.820 | 0.821 | 0.890 |
| PEPINT | 0.777 | 0.627 | 0.629 | 0.701 | 0.793 | 0.761 | 0.795 | 0.899 |
| PrePPI | 0.615 | 0.580 | 0.576 | 0.586 | 0.584 | 0.708 | 0.580 | 0.738 |
| MSM/D | 0.882 | 0.762 | 0.730 | 0.769 | 0.896 | 0.887 | 0.947 | 0.991 |
Available datasets for SH2-peptide interaction agree only partially4,24,2, likely due to systematic biases and high false negative/positive errors. We therefore tested the ability of MSM/D to reconcile disagreement in the experimental record. FPR and TPR were estimated for three HT assays (Fig. 2b) by comparison with HC3 data. We found that, at all FPR levels, MSM/D exhibited higher precision and recall than any experimental dataset. To test the ability of MSM/D to integrate diverse data, we left out one of the five datasets during training and then tested the model against the excluded dataset. MSM/D performance remained high against high-confidence datasets (e.g. AUC of 0.938 vs. 0.947 on HC2) but dropped when predictions were tested on the HT data excluded during training (Table 2). We interpret this as arising from systematic error in the excluded data that cannot be modeled a priori; however, we cannot exclude impact from uneven coverage of sequence space. Our results nonetheless show that MSM/D can correct for random and systematic experimental error to generate a consolidated representation of SH2-pY interactions that is superior to any single dataset or simple polling strategies.
Table 2.
Dataset Transferability (AUCs)
| Overall | MacBeath | Jones | Nash | Cesareni | LT + HC2 | HC2 | HC3 | |
|---|---|---|---|---|---|---|---|---|
| Transfer | 0.771 | 0.671 | 0.737 | 0.711 | 0.707 | 0.836 | 0.938 | 0.971 |
*AUCs computed by withholding an entire dataset from the training set and testing performance of MSM/D exclusively on the held out dataset. LT, HC2, and HC3 were treated as a single dataset.
To determine the ability of MSM/D to model SH2 domains absent from the training set, we retrained the model on data from which one domain had been excluded and then computed the AUC for the excluded domain; the process was iterated over all SH2 domains. In Figure 2c, we plot AUCs as a function of sequence identity between the excluded domain and its nearest included neighbor. MSM/D modelled excluded SH2 domains with AUC ~ 0.8 even when sequence identity to the nearest neighbor averaged ~62%. In contrast, prediction of unknown domains cannot be performed using PEPINT and SMALI. When we left out ~13 SH2 domains at a time, reducing nearest neighbor sequence identity to ~45% (Supplementary Fig. 3d), AUC dropped to ~0.75, but the model retained significant predictive capability. We also examined the properties of the 11 SH2 domains for which no experimental data are available and found binding selectivity comparable to that of other SH2 domains but ~50 fold fewer binding partners (at p > 0.85 threshold). Thus, the absence of data for these 11 domains likely reflects the low probability of observing an interaction experimentally18. We conclude that MSM/D can model unseen SH2 domains and peptides, including those carrying cancer mutations.
Protein and Mutation Models Capture Multi-site Interactions
Interactions between SH2- and pY-containing proteins involve tandem domains and phosphoproteins with up to 25 phosphosites. A majority (82/112) of SH2-containing proteins also contain one or more pY sites. To model such interactions we constructed statistical mechanical ensembles comprising all physical binding configurations, accounting for the combinatorics of multiple domains and phosphosites (Fig. 1e and Supplementary Fig. 1), to yield the MSM protein model (MSM/P). Competitive binding between sites is accounted for by the ensemble formulation. By default, MSM/P assumes all phosphosites are phosphorylated and interacting proteins are equally expressed, but this assumption is unlikely to pertain to actual cells and can be relaxed.
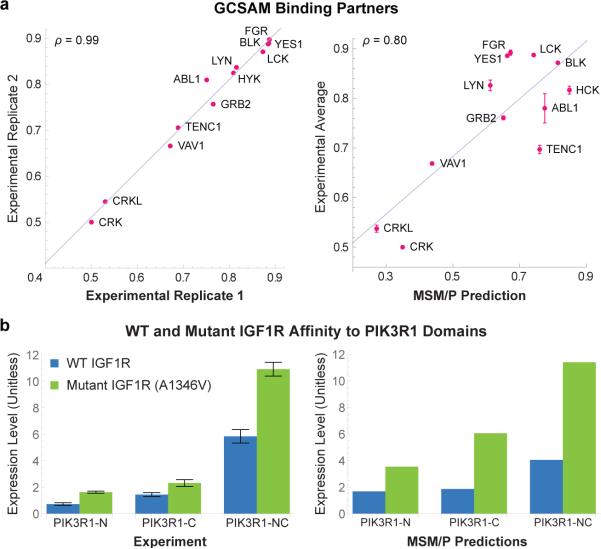
To validate MSM/P experimentally we focused on GCSAM, a protein previously implicated in B-cell lymphoma25,26 for which a large discrepancy exists between the number of published interacting SH2 partners (two are known: GRB227 and SYK28) and the number predicted by MSM/P (nine more with affinities comparable to that of GRB2). We co-expressed GCSAM fused to the monomeric red fluorescent protein TagRFP and one of 12 SH2 domains tagged with GFP. HEK293T cells were then treated with pervanadate for 5 minutes to promote tyrosine phosphorylation, lysates prepared and SH2-containing complexes immunoprecipated using anti-GFP beads. Fluorescent imaging of the beads and the supernatant made it possible to normalize the level of bound SH2 domain to the total level of SH2 and GCSAM expression, resulting in excellent reproducibility between biological replicates (ρ = 0.99, Fig. 3a). Using the bead-based assay we detected binding by all SH2 domains predicted by MSM/P to associate with GCSAM and the correlation between measured and predicted affinities was high (ρ = 0.80, Fig. 3a). This is a stringent test of MSM/P since (i) the agreement is quantitative and spans a broad range of affinities, (ii) the SH2 domains we tested have diverse primary sequences, and (iii) GCSAM contains three pY sites, thereby testing the performance of the protein-level ensemble model.
Figure 3.
Experimental Validation of Wild-type and Mutated Protein Level Interactions. (a) Quantitative co-immunoprecipitation signals of GCSAM to partner proteins show excellent experimental reproducibility (ρ = 0.99) and a high correlation with MSM/P predictions (ρ = 0.80). (b) A1346V mutated IGF1R exhibits higher affinity to the PIK3R1-N, PIK3R1-C, and PIK3R1-NC SH2 domains (p = 6.2 × 10⁻⁵, p = 9.0 × 10⁻³, and p = 5.9 × 10⁻⁵, respectively, using one-sided T-test) as predicted by MSM/P. Error bars represent the standard error of five biological replicates.
Next, we modelled the effects of mutations on SH2-pY interactions by constructing ensembles whose states simultaneously represent the behavior of the PPI before and after mutation (Fig. 1e and Supplementary Fig. 1). The resulting model distinguishes between consequential and non-consequential changes in binding affinity (Supplementary Fig. 2) and accounts for the “protein context” of a mutation, including buffering effects from other phosphosites or domains present in the same protein. To experimentally evaluate the sensitivity of MSM/P to single amino acid substitutions, we analyzed binding of the regulatory subunit α of phosphatidylinositol 3-kinase, PIK3R1, to a mutant in the insulin-like growth factor receptor, IGF1R-A1347V (COSM12856; a mutation in squamous cell carcinoma29). This is a stringent test of the model because: (i) it does not create a predictable canonical motif such as pYXXM; (ii) the mutation occurs in the complex protein context of IGF1R which has 11 phosphosites22; (iii) we predict a gain-of-function increase in affinity rather than a more common loss-of-function decrease (see below); and (iv) PIK3R1 contains two SH2 domains. We co-transfected GFP-tagged IGF1R with constructs expressing mCherry linked to either the N- or C-terminal PIK3R1 SH2 domain or to a construct encoding both domains and performed quantitative co-immunoprecipitation using anti-RFP beads. As predicted, IGF1R-A1347V exhibited stronger binding to the SH2 domains of PIK3R1 than the wild-type protein (Fig. 3b, one-sided T-test for 5 biological replicates of p = 6.2 × 10⁻⁵ for the N-terminal domain, p = 9.0 × 10⁻³ for the C-terminal domain, and p = 5.9 × 10⁻⁵ for the tandem protein). The increase in affinity was correctly predicted to stem from stronger binding of both domains to mutant receptor with the C-terminal domain being the stronger of the two (p = 0.016). The effect is potentially biologically significant, since PIK3R1 and IGF1R are oncogenes that interact through the adaptor IRS1. We conclude that MSM/P is effective at capturing the effects of mutations on SH2-pY binding affinity. However, the data also highlight the limitation that MSM/P does not account for non-additive avidity effects in tandem domains and therefore underestimates the affinity of PIK3R1 for wild-type IGF1R.
Cancer Network Model Enriches for Causal Cancer Genes
Cancer cells typically contain many mutations, a subset of which directly promotes the transformed phenotype (driver mutations), making it necessary to model the net effect of multiple mutations on a network. We formally treat cancer as a stochastic sampling process in which any given genotype is realized by random draws from a pool of mutations. This simplification ignores the sequential and interdependent accrual of cancer mutations because of insufficient data on these dependences, but it can be relaxed as data become available. Probabilities of mutations are derived empirically from unbiased whole genome databanks such as TCGA16. We construct an ensemble over all mutations, and associate a perturbed PPI network with each state in this ensemble. The resulting cancer-network model (MSM/N) assigns to every potential PPI a quantity, Pperturb, defined as the probability that the given PPI will be disrupted or activated by a randomly drawn mutation (Fig. 1e and Supplementary Fig. 1). Pperturb integrates information at the levels of domains, proteins, and networks to model the impact of mutations in multiple proteins and their disease-specific frequencies. Pperturb is central to our approach and rigorously captures the concept of a mutation that is causally responsible for a qualitative change in PPI behavior.
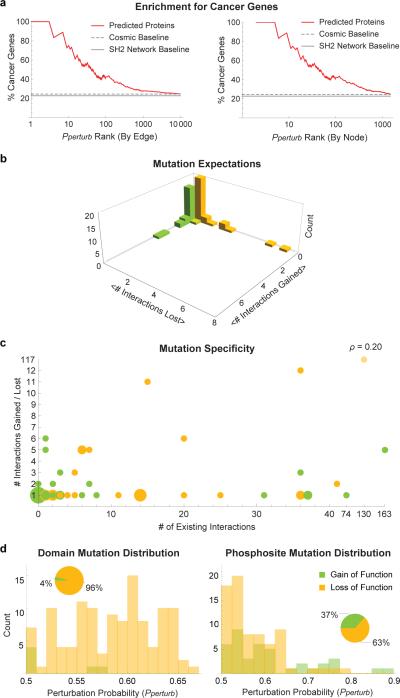
We first used MSM/P to reconstruct the human SH2-phosphoprotein network from first principles using primary sequence data on SH2 domains and 2,292 phosphoproteins, about half of which contained multiple phosphosites (Supplementary Fig. 4 and 5, and Supplementary Table 2). We then obtained all whole-genome tumor sequences from COSMIC16, filtered to include mutations in SH2 domains and residues proximate to confirmed sites of tyrosine phosphorylation (i.e. those with 2 or more sources of experimental support)22. This yielded 807 mutations in SH2 proteins and 4,648 mutations in phosphoproteins across 24 tissue types and 2,206 tumor samples. We pooled all mutations and used MSM/N to derive Pperturb values for every PPI (Supplementary Fig. 6 and Supplementary Tables 3 through 28). The resulting tumor network exhibited strong enrichment for cancer genes (Fig. 4a). The percentage of SH2/phosphoproteins annotated as oncogenes or tumor suppressors is ~23% (by TSGene30 and allOnco) and increases somewhat (to ~25%) when we consider only mutated SH2/phosphoproteins in COSMIC. In contrast, cancer gene enrichment increases to 75% for the top 10 interactors and 43% for the top 100 when scored by Pperturb (COSMIC and Pperturb did not reach parity until ~10,000 PPIs were included). We conclude that COSMIC mutations with high Pperturb values are strongly associated with cancer genes.
Figure 4.
Enrichment and Analysis of Cancer Mutations. (a) The percentage of genes already known to be involved in cancer (as oncogenes or tumor suppressors) are plotted as a function of their ranking by the model (Pperturb). Rankings were done based on edges (top) and nodes (bottom). (b) Histogram of the expected values (per mutation) of lost and gained interactions. (c) Bubble chart depicting number of interactions gained or lost in a mutation as a function of the number of wild-type interaction partners of the mutated protein (circle size indicates number of mutations with the same profile). One mutation was removed when calculating correlation (faint yellow circle). (d) Distributions of Pperturb values for SH2 proteins and phosphoproteins broken down by gain of function (yellow) and loss of function (orange) mutations.
Idiosyncratic Mutations Rewire SH2 Signaling Networks
Of 5,455 COSMIC mutations that occur in SH2- or phosphoproteins, 4,254 (78%) were idiosyncratic, occurring in only a single sample. However, we found that idiosyncratic mutations were as likely to rewire PPIs as recurrent mutations: of 419 recurrent mutations, 23 (5.5%) are predicted to rewire PPIs at >33% probability, and 5 (1.2%) at >50% probability. Of 4,254 idiosyncratic mutations, 262 (6.2%) are predicted to rewire PPIs at >33% probability, and 47 (1.1%) at >50% probability. These results imply that tumor mutations should be analyzed with respect to function rather than frequency alone. MSM is one way to detect potentially functional non-recurrent mutations.
Most Cancer Mutations Disrupt Individual PPIs
Tumorigenic mutations commonly affect enzymatic function by inactivating a tumor suppressor such as PTEN or constitutively activating an oncogene such as PI3 kinase31. It has been hypothesized that some mutations function by selectively rewiring PPIs6. We therefore analyzed MSM/N tumor networks to identify mutations that selectively disrupted single high-affinity PPIs while leaving intact higher- and lower-affinity interactions mediated by the same mutated protein. We found that the majority (69%) of strong cancer mutations (p > 0.5) target a single PPI (Fig. 4b). This appears to hold true irrespective of the number of interactions mediated by the wild-type protein (ρ = 0.2 with one outlier removed; see Fig. 4c). One exception is a mutation in the GRAP2 SH2 domain that changes a tryptophan to a cysteine at a critical residue and is predicted to disrupt 117 out of 130 interactions. Mutating a homologous tryptophan in the related GRB2 protein has been shown to similarly abolish its ability to bind pY-peptides32.
We also observed a difference in the predicted effect of cancer mutations on SH2 proteins and phosphoproteins (Fig. 4d). The vast majority of strong mutations (95%) target phosphoproteins, and result in both gain (37%) and loss (63%) of interactions. Conversely, SH2 mutations almost universally lead to loss of interactions (96%). The strength of the perturbational effect also differed. It takes on average ~100 draws from the pool of phosphoprotein mutations to disrupt an interaction, but only ~10 draws from the pool of SH2 mutations. For gain-of-function mutations, it takes on average ~250 draws for phosphoproteins and ~200 for SH2-proteins.
Two Modes of Network Rewiring by Cancer Mutations
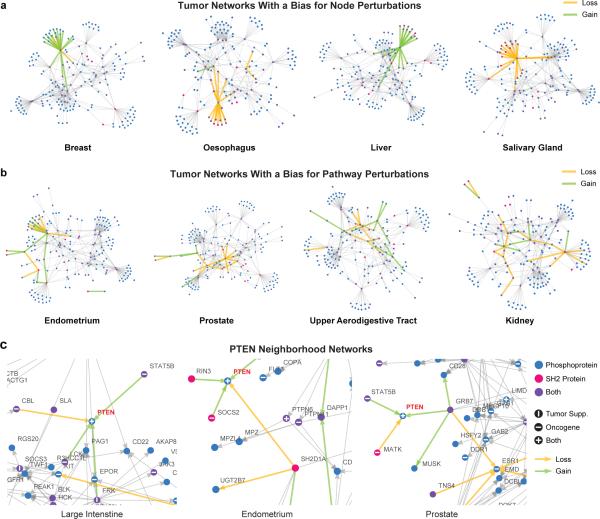
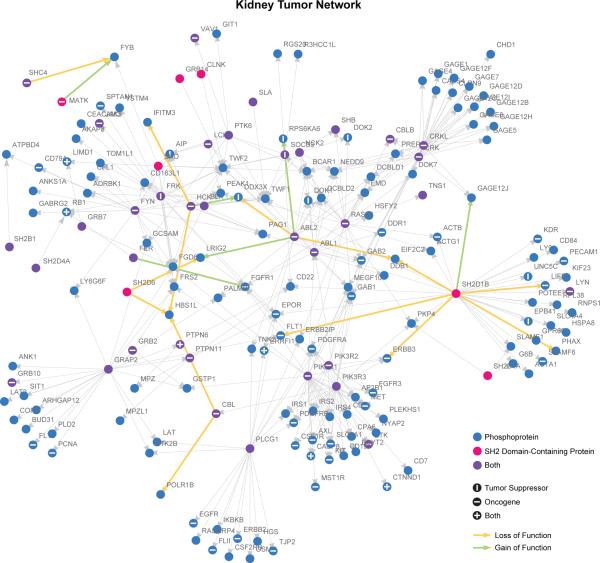
To identify associations between cancer tissue and changes in SH2 networks, we examined the 20 most strongly disrupted PPIs as ranked by Pperturb across 24 cancer tissues of origin. We observed two modes of action: “node” and “pathway”. These modes are not mutually exclusive and occur in combination. In “node” cases (e.g. breast and liver), one or more mutations target a single protein and obliterate all its interactions or result in a gain-of-function loss of selectivity (Fig. 5a). This mode of disruption is analogous to enzymatic mutations, and may be therapeutically addressable with drugs that target a single protein. In the “pathway” mode, multiple mutations disrupt PPIs that form a connected path within a network (Fig. 5b and 6). Random targeting of such connected paths is highly improbable, as each mutation can affect ~250,000 edges, suggesting that selection may be exerted at the level of the signaling pathway. Therapeutic intervention in such cases may require agents that restore pathway-level function. We also observed differential targeting of PPIs involving the same protein across different tissues. For example, the tumor suppressor PTEN is predicted to gain or lose distinct interactions in cancers of the large intestine, endometrium, and prostate (Fig. 5c), and the affected proteins are pertinent to the tumor type. For instance, in prostate, TNS1, TNS4, BCAR1, and RAC1 are known to regulate cellular motility and invasiveness33,34, and the estrogen receptor ESR1 is known to enhance proliferation35.
Figure 5.
Tissue-Specific Tumor Networks. (a) MSM/N predictions of top 20 interactions gained and lost (green and yellow edges, respectively) in four tumor networks overlaid on the wild-type SH2-phosphosignaling network (gray edges, each representing an interaction with p > 0.85 probability, as in Supplementary Fig. 4), showing a bias for the “node” mode of perturbations. (b) Four tumor networks that show a bias for the “pathway” mode of perturbations. (c) Local neighborhoods of the PTEN network in different cancer tissue types. All networks were generated using a spring-electrical embedding in the Mathematica software package.
Figure 6.
Kidney Tumor Network. MSM/N predictions of top 20 perturbed interactions (green and yellow arrows) in kidney cancer overlaid on wild-type SH2-phosphosignaling network (gray edges, each representing an interaction with p > 0.85 probability, as in Supplementary Fig. 4). Networks were generated using a spring-electrical embedding in the Mathematica software package.
DISCUSSION
In this paper we attempt to advance the state-of-the-art in functional genomics by developing an analytical framework for reconstructing SH2 phospho-tyrosine signaling networks in normal and cancer cells via multiscale statistical mechanics. MSM methodology integrates and reconciles diverse genomic, biochemical, and structural data, and provides insights into determinants of binding specificity and the consequences of genetic mutations based on biophysical principles (Fig. 8d). On the molecular level, we find that the majority of mutations that are consequential for PPIs occur in phosphoproteins and are equally likely to result in gain or loss of interactions. Conversely, SH2 domain mutations are mostly loss-of-function. At the network level, cancer mutations rewire SH2 networks in a bimodal fashion, coordinately rewiring connected subnetworks in one mode and disrupting the total function of individual proteins in the other mode.
Figure 8.
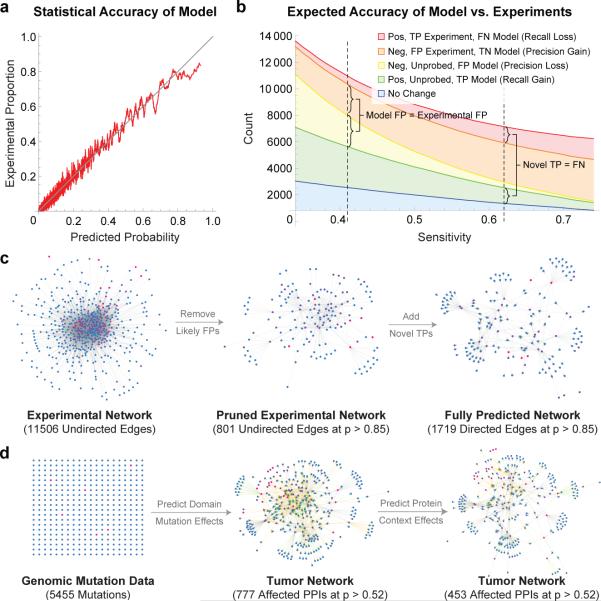
Model Enriches High-Throughput Experiments. (a) SH2/pY-peptide interactions were rank-ordered by their predicted interaction probability and binned into overlapping windows. The average probability within each bin (x-axis) is plotted against the proportion of experimental positives in the same bin (y-axis). We found the agreement to be high, indicating that on a statistical level MSM/D can predict experimental accuracy. (b) Expected proportions of various outcomes (TP/TN/FP/FN) for model and experiment are plotted as a function of model sensitivity. Right dashed vertical line indicates a sensitivity level at which MSM/D is expected to predict as many new interactions (green) as it loses due to oversensitivity (red). At this threshold, MSM/D is expected to eliminate ~7 times more FPs than it adds (415 model FPs added vs. 2973 experimental FPs eliminated). Left dashed vertical line corresponds to a sensitivity at which MSM/D is expected to add the same number of FPs (yellow) as it eliminates (orange). At this threshold, MSM/D discovers ~5 times more TPs than it loses (3091 model TPs added vs. 614 experimental TPs lost). (c) Model predictions can be used as quality indicators to enrich HT experiments for TPs by eliminating low probability interactions. Model predictions can also be used to add novel interactions that have not been experimentally probed. (d) Genomic mutation data only provides node-level information (i.e. which gene is mutated). Model converts node-level mutation information into edge-level perturbations, and integrates the known or predicted PPI network to model the buffering effects of multi-site proteins.
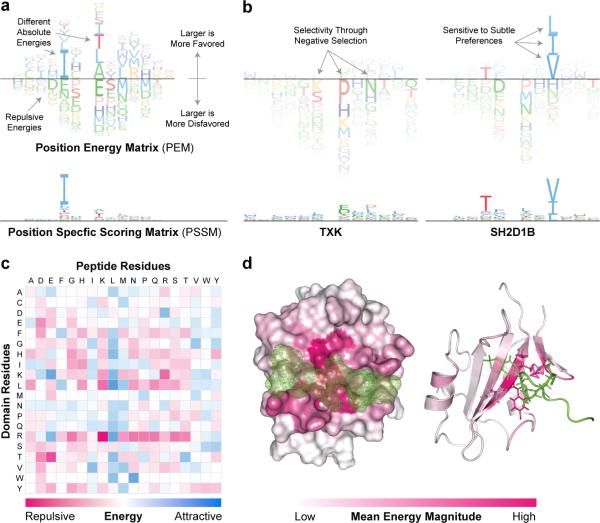
To summarize the selectivity of SH2 domains, we developed a new matrix representation: Position Energy Matrices (PEMs) (Fig. 7a, Supplementary Note, and Supplementary Table 29). Existing position-specific scoring matrices (PSSMs) describe determinants of binding selectivity by specifying the relative preferences for a base or amino acid at each position in the bound biomolecule. In contrast, PEMs describe per-residue interaction energies using a scale that is universal across SH2 domains and residue positions (Fig. 7c). This makes it possible to compare absolute preferences between peptide positions and capture selectivity effects that are obscured by PSSMs (Fig. 7a and 7b). The PEM representation also makes clear that residue-specific negative interaction energies (those lying below the line) play a significant role in binding selectivity. By mapping the position-specific MSM/D energies onto the 3D structure of the SH2/pY-peptide binding interface (Fig. 7d) we find that positive and negative energetic hotspots lie primarily in the peptide binding pocket (dark pink) showing that MSM/D captures the physico-chemical basis of protein-peptide interaction.
Figure 7.
PEMs Capture the Biophysical Basis of SH2 Domain Specificity. (a) PEM representation. Amino acids exhibiting attractive interactions lie above the dividing line whereas amino acids involving repulsive interactions lie below, with the height of the residue corresponding to the magnitude of the interaction energy. PEMs capture the effects of negative selectivity and differential energy contributions at different residue positions. (b) PEM for the domain SH2D1B shows that a tyrosine at position −2 (relative to the pY site) contributes less to affinity than a leucine or isoleucine at position +3. In the PSSM the situation is reversed, because the PSSM representation forces each position to contribute equally to the total probability which causes the dominant valine at position +3 to appear more important than it is in terms of actual energetics. Negative selectivity is also readily evident using PEMs: in the case of the SH2 domain TXK specificity involves repulsive interactions, specifically proline, asparagine, and lysine at positions +1, +3, and −1, respectively. These effects on selectivity cannot be discerned from the corresponding PSSM. (c) Heatmap of pairwise amino acid interaction energies at the SH2-phosphopeptide interface as derived from MSM/D. Instances of strong negative energies (bright pink) correspond to electrostatic repulsion (e.g. R and K) whereas positive energies (bright blue) are electrostatically complementary (e.g. R and D) or involve buried hydrophobic amino acids (e.g. L and L). (d) Heatmap of the average magnitude of interaction energies per residue position projected onto a structural representative of SH2 domains (white) in complex with phosphopeptide (green) (accession code: 1JU5).
Because it is probabilistic, MSM/D can estimate the proportion of false positives (FPs) and negatives FNs in experiments (Fig. 8a). An interaction deemed to be an experimental negative but which is assigned a 90% probability by MSM/D has only a 10% probability of being an experimental true negative (TN) and a model FP. Using a sensitivity threshold at which MSM/D is expected to predict as many new interactions (TPs) as it loses (FNs), MSM/D eliminates ~7 times more FPs than it adds (Fig. 8b); at a sensitivity threshold at which MSM/D is expected to add the same number of FPs as it eliminates, MSM/D discovers ~5 times more TPs than it loses. These results suggest a role for MSM in pruning large-scale data as a means to increase quality, sensitivity, and concordance across assays (Fig. 8c). By analogy, the introduction of Phred quality scores for DNA sequencing was critical in reducing error and increasing throughput in genomics36. Data pruning can also be used in an iterative approach involving model training on data and data refinement using a model. More generally we propose that precise statistical modeling is a superior approach to reconcile irreproducible and discordant data in biomedicine37 than simple repetition.
The MSM framework is applicable to any PID for which interaction and structural data are available (e.g. PTB, SH3, PDZ domains), including DNA-binding protein domains. Certain PIDs (e.g. SH3 domains) will present additional difficulties because they lack the absolute reference frame for peptide alignment provided by pTyr residues, possibly necessitating threading and structural alignment. Moreover, MSM does not currently take into account levels of protein expression or actual states of tyrosine phosphorylation in cells, but can be extended to incorporate this data as it becomes available (e.g. from quantitative mass spectrometry). The ultimate goal is to model information flow through PID networks under different physiological conditions as a means to understand normal physiology, disease-associated mutations, and patient-specific phenotypic responses. Statistical mechanical ensembles such as those described here provide the conceptual framework needed to achieve this.
ONLINE METHODS
Quantitative co-Immunoprecipitation of GCSAM interacting proteins
N-terminal GFP tagged SH2 domains and C-terminal TagRFP tagged GCSAM were co-transfected into HEK293T cells acquired from ATCC. After 24 hours, cells were treated with freshly prepared pervanadate according to a previously published protocol27 and subsequently lysed using Cell Signaling® Lysis Buffer according to the manufacturer's protocol. Cleared lysate was added to GFP-Trap® agarose conjugated beads (ChromoTek gta-20) and then incubated for 1 hour at 4°C. After centrifugation, 40μL of supernatant was transferred to a 384-well plate. The beads were subsequently washed twice and also transferred into the same 384-well plate for imaging on Operetta® High Content Imaging System in both GFP and RFP channels. By normalizing the bead RFP signal by the bead GFP signal and the supernatant RFP signal, a quantitative value is obtained that is linearly related to the association constant of the two species under the assumption that bead GFP signal primarily reflects the unbound state. To facilitate quantitative comparison, the signals were divided by the signal of the weakest binder, CRK, yielding fold change (f) measurement that were rescaled between 0.5 and 1 using the equation f/(1+f). This quantity represents the relative occupancy of the bound and unbound states.
Determining the effect of the IGF1R A1347V mutation
The A1347V mutation was introduced into a plasmid encoding IGF1R using site directed mutagenesis. IGF1R Quantitative co-IP was performed similarly to the GCSAM experiments described above, except that IGF1R was GFP tagged, SH2 domains were tagged with mCherry, and immunoprecipitation was done with RFP-Trap® (ChromoTek rta-20). Five biological replicates were performed on different days and the imaging parameters were optimized in each experiment so as to prevent signal saturation; the data from each biological replicate were therefore rescaled using a constant that related the signal intensities of imaging.
Supplementary Material
ACKNOWLEDGEMENTS
This work was supported by NIH grants GM68762, GM107618 and GM072872. We used resources of the National Energy Research Scientific Computing Center, which is supported by the Office of Science of the U.S. Department of Energy under Contract No. DE-AC02-05CH11231. G.M. is an employee of and shareholder in Merrimack Pharmaceuticals, Inc.; P.K.S. is also a stockholder in Merrimack and chair of its SAB.
Footnotes
AUTHOR CONTRIBUTIONS
All authors conceived and designed the study. M.A., G.K., and P.K.S. wrote the paper. M.A. developed the mathematical model. G.K. performed the experiments. All authors discussed and interpreted the results.
URLs
Paper Website: http://lincs.hms.harvard.edu/alquraishi-natgenet-2014/
Source Code: https://github.com/AlQuraishiLab/sh2-cancer
allOnco Genelists: http://www.bushmanlab.org/links/genelists
REFERENCES
- 1.Lawrence MS, et al. Discovery and saturation analysis of cancer genes across 21 tumour types. Nature. 2014 doi: 10.1038/nature12912. doi:10.1038/nature12912. [DOI] [PMC free article] [PubMed] [Google Scholar]
- 2.Liu BA, Engelmann BW, Nash PD. High-throughput analysis of peptide-binding modules. Proteomics. 2012;12:1527–1546. doi: 10.1002/pmic.201100599. [DOI] [PMC free article] [PubMed] [Google Scholar]
- 3.Ho Y, et al. Systematic identification of protein complexes in Saccharomyces cerevisiae by mass spectrometry. Nature. 2002;415:180–183. doi: 10.1038/415180a. [DOI] [PubMed] [Google Scholar]
- 4.Bader GD, Hogue CWV. Analyzing yeast protein–protein interaction data obtained from different sources. Nat. Biotechnol. 2002;2020:991, 991–997. doi: 10.1038/nbt1002-991. [DOI] [PubMed] [Google Scholar]
- 5.Gschwind A, Fischer OM, Ullrich A. The discovery of receptor tyrosine kinases: targets for cancer therapy. Nat. Rev. Cancer. 2004;4:361–370. doi: 10.1038/nrc1360. [DOI] [PubMed] [Google Scholar]
- 6.Zhong Q, et al. Edgetic perturbation models of human inherited disorders. Mol. Syst. Biol. 2009;5:321. doi: 10.1038/msb.2009.80. [DOI] [PMC free article] [PubMed] [Google Scholar]
- 7.Ren J, et al. PhosSNP for Systematic Analysis of Genetic Polymorphisms That Influence Protein Phosphorylation. Mol. Cell. Proteomics. 2010;9:623–634. doi: 10.1074/mcp.M900273-MCP200. [DOI] [PMC free article] [PubMed] [Google Scholar]
- 8.Tamborero D, et al. Comprehensive identification of mutational cancer driver genes across 12 tumor types. Sci. Rep. 2013;3:2650. doi: 10.1038/srep02650. [DOI] [PMC free article] [PubMed] [Google Scholar]
- 9.Birge RB, Kalodimos C, Inagaki F, Tanaka S. Crk and CrkL adaptor proteins: networks for physiological and pathological signaling. Cell Commun. Signal. CCS. 2009;7:13. doi: 10.1186/1478-811X-7-13. [DOI] [PMC free article] [PubMed] [Google Scholar]
- 10.Li L, et al. Prediction of phosphotyrosine signaling networks using a scoring matrix-assisted ligand identification approach. Nucleic Acids Res. 2008;36:3263–3273. doi: 10.1093/nar/gkn161. [DOI] [PMC free article] [PubMed] [Google Scholar]
- 11.Kundu K, Costa F, Huber M, Reth M, Backofen R. Semi-Supervised Prediction of SH2-Peptide Interactions from Imbalanced High-Throughput Data. PLoS ONE. 2013;8:e62732. doi: 10.1371/journal.pone.0062732. [DOI] [PMC free article] [PubMed] [Google Scholar]
- 12.Miller ML, et al. Linear Motif Atlas for Phosphorylation-Dependent Signaling. Sci. Signal. 2008;1:ra2. doi: 10.1126/scisignal.1159433. [DOI] [PMC free article] [PubMed] [Google Scholar]
- 13.Wunderlich Z, Mirny LA. Using genome-wide measurements for computational prediction of SH2-peptide interactions. Nucleic Acids Res. 2009;37:4629–4641. doi: 10.1093/nar/gkp394. [DOI] [PMC free article] [PubMed] [Google Scholar]
- 14.Zhang QC, et al. Structure-based prediction of protein-protein interactions on a genome-wide scale. Nature. 2012;490:556–560. doi: 10.1038/nature11503. [DOI] [PMC free article] [PubMed] [Google Scholar]
- 15.Franceschini A, et al. STRING v9.1: protein-protein interaction networks, with increased coverage and integration. Nucleic Acids Res. 2013;41:D808–815. doi: 10.1093/nar/gks1094. [DOI] [PMC free article] [PubMed] [Google Scholar]
- 16.Forbes SA, et al. COSMIC: mining complete cancer genomes in the Catalogue of Somatic Mutations in Cancer. Nucleic Acids Res. 2011;39:D945–D950. doi: 10.1093/nar/gkq929. [DOI] [PMC free article] [PubMed] [Google Scholar]
- 17.AlQuraishi M, McAdams HH. Direct inference of protein–DNA interactions using compressed sensing methods. Proc. Natl. Acad. Sci. 2011;108:14819–14824. doi: 10.1073/pnas.1106460108. [DOI] [PMC free article] [PubMed] [Google Scholar]
- 18.Koytiger G, et al. Phosphotyrosine signaling proteins that drive oncogenesis tend to be highly interconnected. Mol. Cell. Proteomics MCP. 2013;12:1204–1213. doi: 10.1074/mcp.M112.025858. [DOI] [PMC free article] [PubMed] [Google Scholar]
- 19.Hause RJ, et al. Comprehensive Binary Interaction Mapping of SH2 Domains via Fluorescence Polarization Reveals Novel Functional Diversification of ErbB Receptors. PLoS ONE. 2012;7:e44471. doi: 10.1371/journal.pone.0044471. [DOI] [PMC free article] [PubMed] [Google Scholar]
- 20.Liu BA, et al. SH2 Domains Recognize Contextual Peptide Sequence Information to Determine Selectivity. Mol. Cell. Proteomics. 2010;9:2391–2404. doi: 10.1074/mcp.M110.001586. [DOI] [PMC free article] [PubMed] [Google Scholar]
- 21.Tinti M, et al. The SH2 Domain Interaction Landscape. Cell Rep. 2013;3:1293–1305. doi: 10.1016/j.celrep.2013.03.001. [DOI] [PMC free article] [PubMed] [Google Scholar]
- 22.Hornbeck PV, et al. PhosphoSitePlus: a comprehensive resource for investigating the structure and function of experimentally determined post-translational modifications in man and mouse. Nucleic Acids Res. 2011 doi: 10.1093/nar/gkr1122. doi:10.1093/nar/gkr1122. [DOI] [PMC free article] [PubMed] [Google Scholar]
- 23.Branden C, Tooze J. Introduction to Protein Structure. (Garland Science. 1999 [Google Scholar]
- 24.Von Mering C, et al. Comparative assessment of large-scale data sets of protein–protein interactions. Nature. 2002;417:399–403. doi: 10.1038/nature750. [DOI] [PubMed] [Google Scholar]
- 25.Lossos IS, Alizadeh AA, Rajapaksa R, Tibshirani R, Levy R. HGAL is a novel interleukin-4-inducible gene that strongly predicts survival in diffuse large B-cell lymphoma. Blood. 2003;101:433–440. doi: 10.1182/blood-2002-06-1931. [DOI] [PubMed] [Google Scholar]
- 26.Natkunam Y, et al. Expression of the human germinal center-associated lymphoma (HGAL) protein identifies a subset of classic Hodgkin lymphoma of germinal center derivation and improved survival. Blood. 2007;109:298–305. doi: 10.1182/blood-2006-04-014977. [DOI] [PMC free article] [PubMed] [Google Scholar]
- 27.Pan Z, et al. Studies of a germinal centre B-cell expressed gene, GCET2, suggest its role as a membrane associated adapter protein. Br. J. Haematol. 2007;137:578–590. doi: 10.1111/j.1365-2141.2007.06597.x. [DOI] [PMC free article] [PubMed] [Google Scholar]
- 28.Romero-Camarero I, et al. Germinal centre protein HGAL promotes lymphoid hyperplasia and amyloidosis via BCR-mediated Syk activation. Nat. Commun. 2013;4:1338. doi: 10.1038/ncomms2334. [DOI] [PMC free article] [PubMed] [Google Scholar]
- 29.Davies H, et al. Somatic mutations of the protein kinase gene family in human lung cancer. Cancer Res. 2005;65:7591–7595. doi: 10.1158/0008-5472.CAN-05-1855. [DOI] [PubMed] [Google Scholar]
- 30.Zhao M, Sun J, Zhao Z. TSGene: a web resource for tumor suppressor genes. Nucleic Acids Res. 2013;41:D970–976. doi: 10.1093/nar/gks937. [DOI] [PMC free article] [PubMed] [Google Scholar]
- 31.Watson IR, Takahashi K, Futreal PA, Chin L. Emerging patterns of somatic mutations in cancer. Nat. Rev. Genet. 2013;14:703–718. doi: 10.1038/nrg3539. [DOI] [PMC free article] [PubMed] [Google Scholar]
- 32.Marengere LE, et al. SH2 domain specificity and activity modified by a single residue. Nature. 1994;369:502–505. doi: 10.1038/369502a0. [DOI] [PubMed] [Google Scholar]
- 33.Cabodi S, del Pilar Camacho-Leal M, Di Stefano P, Defilippi P. Integrin signalling adaptors: not only figurants in the cancer story. Nat. Rev. Cancer. 2010;10:858–870. doi: 10.1038/nrc2967. [DOI] [PubMed] [Google Scholar]
- 34.Haynie DT. Molecular Physiology of the Tensin Brotherhood of Integrin Adaptor Proteins. Proteins. 2014 doi: 10.1002/prot.24560. doi:10.1002/prot.24560. [DOI] [PubMed] [Google Scholar]
- 35.Ewan KBR, et al. Proliferation of estrogen receptor-alpha-positive mammary epithelial cells is restrained by transforming growth factor-beta1 in adult mice. Am. J. Pathol. 2005;167:409–417. doi: 10.1016/s0002-9440(10)62985-9. [DOI] [PMC free article] [PubMed] [Google Scholar]
- 36.Ewing B, Hillier L, Wendl MC, Green P. Base-calling of automated sequencer traces using phred. I. Accuracy assessment. Genome Res. 1998;8:175–185. doi: 10.1101/gr.8.3.175. [DOI] [PubMed] [Google Scholar]
- 37.Freedman LP, Inglese J. The increasing urgency for standards in basic biologic research. Cancer Res. 2014;74:4024–4029. doi: 10.1158/0008-5472.CAN-14-0925. [DOI] [PMC free article] [PubMed] [Google Scholar]
Associated Data
This section collects any data citations, data availability statements, or supplementary materials included in this article.


