Abstract
The aim of this study was to successfully establish an orthotopic murine model using two different human pancreatic adenocarcinoma cell lines and to propose a 3.0 tesla MRI protocol for noninvasive characterization of this model. SW1990 and MIAPaca-2 tumor cells were injected into the pancreas of BALB/C nu/nu mice. Tumor growth rate and morphological information were assessed by 3.0 tesla MRI (T1WI, T2WI and DCE-MRI) and immunohistology. Proliferation of SW1990 was significantly faster than that of MIAPaca-2 (P=0.000), but MIAPaca-2 mice had a significantly shorter survival than SW1990 mice (41 days and 44 days respectively, P=0.027). MRI could reliably monitor tumor growth in both cell lines: the tumors exhibiting a spherical growth pattern showed a high-intensity signal, and the SW1990 group developed significantly larger tumors compared with the MIAPaCa-2 group. There were no statistical differences between the two groups in which tumor size was assessed using electronic calipers and an MRI scan (P=0.680). Both tumors showed a slow gradual enhancement pattern. Immunohistochemistry demonstrated tumor tissues showing high expression of Ki-67. This model closely mimics human pancreatic cancer and permits monitoring of tumor growth and morphological information by noninvasive 3.0 tesla MRI studies reducing the number of mice required.
Keywords: MIAPaCa-2, MRI, orthotopic murine model, pancreatic cancer, SW1990
Introduction
Pancreatic ductal adenocarcinoma (PDAC) is associated with a 5-year survival rate of less than 5% and a median survival of 6 months after diagnosis. It is characterized by a high propensity for local invasion and distant metastasis as well as a largely drug-resistant phenotype [7, 13, 19].
Advances in the development of new anti-pancreatic cancer strategies and preclinical evaluation of anti-pancreatic cancer drugs highlight the need for animal models that are hopefully more reflective of human pancreatic cancer. There are three primary groups of rodent models that serve these purposes including xenograft implanted, carcinogen-induced, and genetically engineered models. Compared with the other two models, orthotopic xenograft rodent models are an ideal biological system for studying pancreatic cancer, because they can establish a human pancreatic cancer in its native site with the ability to expand relevance to drug evaluations, particularly targeting issues as well as studies that are focused on epithelial-mesenchymal transition, invasion, and metastasis [1, 5, 14].
Frequently, cultured pancreatic cancer cells are used for orthotopic rodent models, and there are more than 25 published lines of cultured pancreatic cancer cells available [15, 24]. Here, we introduce an orthotopic murine model using two different human pancreatic adenocarcinoma cell lines: SW1990 and MIAPaca-2. For monitoring tumor growth and metastasis formation, histologic analysis of biopsy samples remains the gold standard. However, the collection of PDAC biopsy samples is inherently invasive increasing the number of mice required. New methods to permit noninvasive assessment of tumor progression are crucial. Rapid advances in MRI technology have been made in the past decade and many powerful and versatile MRI sequences and methods have been developed and widely applied in preclinical research [2]. Comprehensive MRI protocols fully exploit the potential of these new developments. High-field-strength MRI systems (usually 7.0 tesla MRI) have been widely used for animal experiments [17, 18], but clinical 3.0 tesla MRI systems have been scarcely used. Compared with dedicated high-field-strength MRI systems, the main strength of using clinical MRI scanners is the easier translation of the obtained results to the clinical settings with patients.
In this study, we successfully established an orthotopic murine model using two different human pancreatic adenocarcinoma cell lines and characterized the animal handling for MRI imaging and details of a multiparametric MRI protocol with four sequences that are operable with a clinical 3.0-T MRI scanner. Monitoring of tumor growth and the formation of metastases was examined focussing on the possibility of reducing the number of animals needed for long-term follow-up according to the 3R principles (reduction, replacement, and refinement of research animals) described by Russel and Burch in 1959 [18, 21].
Materials and Methods
Female BALB/c nu/nu mice (n=30, 6 weeks old, 21–23 g body weight) were obtained from Shanghai Institute for Biological Sciences (Shanghai, China) and allowed to adapt to their new surroundings for 7 days. They were maintained in a specific pathogen-free environment. All animal studies were conducted in accordance with the principles and procedures outlined in the guidelines of the Institutional Animal Care and Use Committee at Shanghai Medical College of Fudan University.
Human pancreatic adenocarcinoma cell line MIAPaCa-2 was the kind gift of Prof. Mukaida, Kanazawa University, Japan. The human pancreatic adenocarcinoma cell line SW1990 was purchased from American Type Culture Collection (ATCC). Cell lines were maintained in DMEM supplemented with 10% fetal calf serum, 100 U/ml of penicillin and 100 µg/ml of streptomycin. Tissue culture reagents were obtained from Gibco (Invitrogen, Carlsbad, CA, USA). Cell cultures were kept in a humidified incubator at 37°C with 5% CO2.
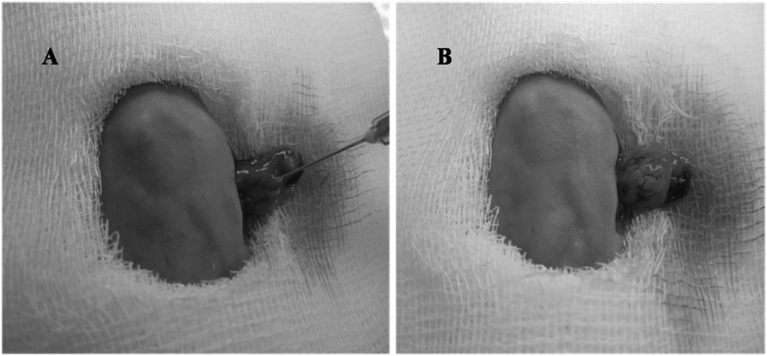
Subconfluent cultures of tumor cells were harvested using a 0.05% trypsin solution, washed twice in PBS and resuspended as single-cell suspensions in PBS at concentrations of 2 × 10⁶ per 100 µl. Cell viability was tested using trypan blue exclusion. Viability was always>95%. The mice were anesthetized with 100 µl of 2% pentobarbital sodium injected into the abdominal cavity. Then the abdominal cavity was opened by a 5- to 10-mm transverse incision on the left flank. The tail of the pancreas was exposed through this incision. Tumor cells (2 × 10⁶) were slowly injected into the juncture of the pancreas body and tail (Fig. 1). To further prevent leakage, a cotton wool tip was pressed onto the injection site for 30 s. To ensure the same injection technique for all experiments, the injection was always carried out by the same person. The pancreas was then placed back into the abdominal cavity. The abdominal cavity was closed in two layers using 3–0 nonabsorbable sutures. Fourteen mice were euthanized on day 28, and 16 mice were observed for survival.
Fig. 1.
Technique for tumor cell injection into the juncture of the pancreas body and tail. A: before injection. B: after injection.
Cell proliferation assay
Cell proliferation was assessed using Cell Counting Kit-8 (CCK8, Dojindo, Tokyo, Japan). SW1990 and Miapaca-2 cells were seeded at a concentration of 3 × 10³ cells per well in 96-well plates in 100 µl of complete medium. Six duplicate wells were set up for each group. Proliferation was measured after 1–6 days by adding 10 µl of CCK8 reagent per well followed by a 2-h incubation under standard cell culture conditions. Absorbance of each well was measured by microplate reader scanning at 450 nm.
Assessment of tumor size
All mice were checked daily for their general condition and weekly for tumor formation. Tumor-bearing animals were sacrificed 28 days after tumor cell injection following the final MRI scan. Necropsies were carried out on all of these animals immediately after sacrifice. Sites of obvious or potential tumor growth, including the pancreas, liver, spleen, lung, kidney, and peritoneal lymph nodes were harvested and routinely processed for histologic microscopic examination. The volume of tumors was estimated by electronic calliper measurements. Tumor volume was calculated using the formula for ellipsoid tumors, V=L × W × H × (π/6). L was the longest distance from right to left, W was the largest dorsal/ventral diameter and H was the largest rostral/caudal diameter [25]. Seven, 14 and 21 days after tumor cell injection, animals were scanned for tumor growth using a 3.0 tesla MRI scan.
3.0 tesla MRI
MRI was performed 14–15 days after tumor inoculation on a 3.0 tesla scanner (MAGNETOM Verio, Siemens, Erlangen, Germany) with a mouse coil. Mice were sedated with pentobarbital sodium (2%) during MRI procedures.
First, unenhanced T1-weighted SE and T2-weighted TSE imaging were performed. Then T1-weighted VIBE (volumetric interpolated breath-hold examination) images with flip angles of 2° and 14° were acquired before the injection of contrast agent to calculate the T1 map (variable flip angle technique), which would be used in the conversion of dynamic MR signal enhancement into Gd concentration values. Dynamic imaging was performed using a breath-hold VIBE sequence centered through the abdomen, which included the liver and upper pole of the kidneys. A bolus of contrast agent was manually injected into the tail vein. Gadopentetate dimeglumine (Magnevist; Bayer Schering, Beijing, China) was injected at a dose of 100 µmol per kilogram of body weight and the injection of gadoxetic acid disodium (Magnevist; Bayer Schering, Beijing, China) at a dose of 25 µmol per kilogram of body weight. Details regarding all sequence parameters are summarized in Table 1.
Table 1. Parameters of the MR sequences.
| Parameters | T1WI | T2WI | T1MAP | DCE-MRI |
|---|---|---|---|---|
| Sequence | SE | TSE | VIBE | VIBE |
| Contrast agents | Magnevist (GD-DTPA) | |||
| Dose (μmolGd/kg) | 100 | |||
| TR/TE (ms) | 400/12 | 3500/89 | 5.15/1.87 | 5.15/1.87 |
| Flip angle (degree) | 90/180 | 120 | 2/14 | 10 |
| FOV (mm) | 64 | 64 | 88 | 88 |
| Imaging matrix | 205 × 256 | 192 × 192 | 202 × 224 | 202 × 224 |
| Slice thickness (mm) | 1.2 | 0.9 | 2.0 | 2.0 |
| Voxel size (mm) | 0.3 × 0.3 × 1.2 | 0.3 × 0.3 × 0.9 | 0.4 × 0.4 × 2.0 | 0.4 × 0.4 × 2.0 |
| Bandwidth (Hz/pixel) | 233 | 203 | 400 | 400 |
| Total measure time (min:s) | 5:01 | 3:49 | 0: 8.4 | 4:27/8:47 |
| Measurements | 1 | 1 | 2 | 61/121 |
T1WI: T1-weighted imaging, T2WI: T2-weighted imaging, DCE-MRI: dynamic contrast-enhanced MRI, SE: spin echo, FSE: fast spin echo, VIBE: volumetric interpolated breath hold examination, TR: repetition time, TE: echo time, FOV: field of view.
Analysis of MRI images
Tumor volume was also calculated using the formula for ellipsoid tumors V=L × W × H × (π/6). The time–signal intensity curves of the tumors were obtained from the DCE MR imaging data set by using a dedicated postprocessing software program for DCE MR imaging (Tissue 4D; Siemens Healthcare). First, motion correction of DCE MR images was performed by using the nonrigid registration technique of the Tissue 4D program. The motion-corrected images were then registered to the T1 map. The Signal intensity was then converted to the gadolinium concentration, and the time–signal intensity curve was calculated.
Histology and immunohistochemistry
The pancreas including the tumor and suspicious metastatic tissue were completely resected. The complete specimens were fixed in 10% buffered formalin, processed routinely, embedded in paraffin and cut into 4 µm sections using a microtome (Leica). Sections were deparaffinized in xylene and washed in gradient alcohol. For HE staining, the sections were washed in phosphate-buffered saline (PBS) at pH 7.4, followed by staining with hematoxylin until the desired staining was achieved. Sections were rinsed in tap water, washed in PBS, and then subjected to the second staining protocol using eosin until the desired staining was achieved. Afterwards, sections were dehydrated in 100% alcohol, cleared and coverslipped. The sections were then examined using an Olympus light microscope. For immunohistochemistry, the sections were incubated in 3% hydrogen peroxide (H2O2) for 15 min for endogenous peroxidase activity blockade and heated in an autoclave in citrate buffer (pH 6.0) for 10 min for antigen retrieval, followed by blocking of nonspecific antigen with 10% normal goat serum (NGS) for 1 h; sections were then incubated with the primary antibody against Ki67 (Abcam, Cambridge, MA, USA) overnight at 4°C. HRP-linked anti-rabbit/mouse antibodies (EnViSion Detection Kit, Gene Tech Co., China) were used as secondary antibodies. The slides were developed using diaminobenzidine (DAB) as the chromogen and counterstained with hematoxylin, dehydrated, and coverslipped. The evaluation criteria for Ki67 results were as follows: Obvious nucleus coloring was considered a positive result. The percentage of positive cells calculated for diseased cells in 400× magnification light microscope images. No nucleus coloring or <10% positive cells was considered a negative result (−), 10%–25% was considered weakly positive (+); 26%–50% was considered moderately positive (++), and >50% was considered strongly positive (+++). Nagative and positive samples were defined as the low expression group, and moderately and strongly positive samples were defined as the high expression group.
Statistical analysis
Data are expressed as the mean ± standard deviation, unless stated otherwise. Assessments of cell proliferation and tumor size were compared by day using repeated measures analysis. Survival analyses were performed using the Kaplan-Meier procedure. Statistical significance was defined as P<0.05. The means of all statistics were calculated using SPSS for Windows (Version 16.0, SPSS Inc., Chicago, IL, USA).
Results
Cell proliferation
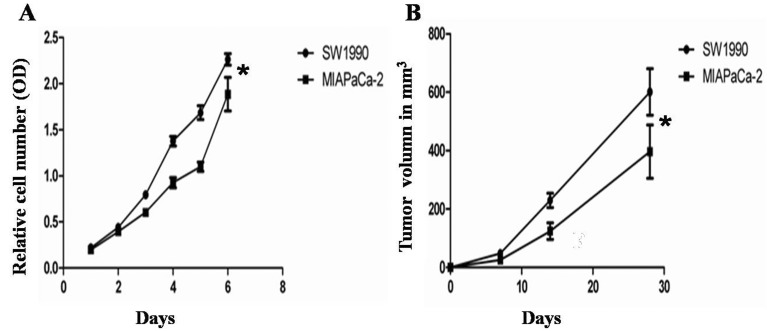
Cell proliferation of the SW1990 group and the MIAPaCa-2 group was analyzed at days 1–6. According to the CCK8 assay (Fig. 2A), the relative cell number (value of OD) was significantly increased over time and the trend over time was the same for both groups; however the cell proliferation of the SW1990 group was increased by more compared with the MIAPaCa-2 group (P=0.000).
Fig. 2.
Monitor of the growth of tumor cells and tumors. (A) Cell proliferation was analyzed at 1, 2, 3, 4, 5 and 6 days. Cell proliferation in the SW1990 group was increased by more compared with the MIAPaCa-2 group (P<0.05). (B) Tumor volume was monitored by MRI at 7, 14, and 28 days. The SW1990 group developed significantly larger tumors compared with the MIAPaCa-2 group (P<0.05, n=5).
Tumor growth monitored by MRI
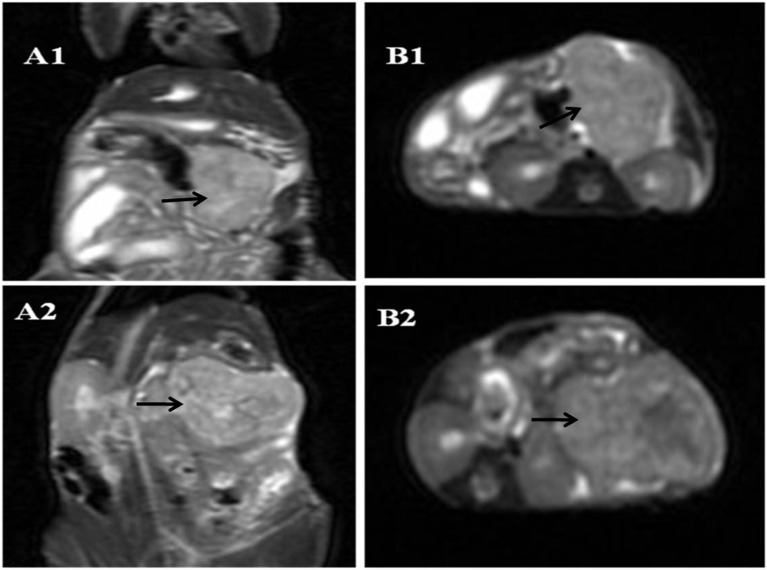
All mice orthotopically injected with tumor cells developed tumors within the juncture of the pancreas body and tail (i.e. 100%). To study the size of tumors, high- resolution T2-weighted images in the coronal and transverse planes were analyzed. Tumors within the juncture of the pancreas body and tail could be safely identified in all tumor-bearing animals. The growth pattern of the tumors resembled a spherical growth pattern, and the tumors showed a high-intensity signal. As the tumor size increased, it became possible to identity the central zone of tumor necrosis and fibrosis. The necrotic area showed a high-intensity signal, whereas the fibrotic area showed a low-intensity signal (Fig. 3).
Fig. 3.
T2WI of tumor at 28 days. A: coronal plane. B: transverse plane. 1: MIAPaCa-2 group. 2: SW1990 group. Arrows indicate a tumor.
Tumor growth in the SW1990 group and MIAPaCa-2 group was analyzed at 7, 14, and 28 days (n=7). The SW1990 group developed significantly larger tumors compared with the MIAPaCa-2 group (P=0.005) (Fig. 2B). Seven days after tumor cell injection, the SW1990 group had a mean volume of 48 mm3 (±27 mm3), no tumors were found in 40% of the mice in the MIAPaCa-2 group. Those tumors that could be identified in MRI had a mean volume of 26 mm3 (±8 mm3); Fourteen days after tumor cell injection, the tumors in the SW1990 group had increased to a mean volume of 230 mm3 (±55 mm3). Tumors were found in all the mice in the MIAPaCa-2 group within the pancreas in MRI, and the tumors showed mean volumes of 124 mm3 (±63 mm3). Twenty-eight days after tumor cell injection, the tumors in the SW1990 group had increased to a mean volume of 601 mm3 (±177 mm3). Those in the MIAPaCa-2 group showed mean volumes of only 396 mm3 (±205 mm3).
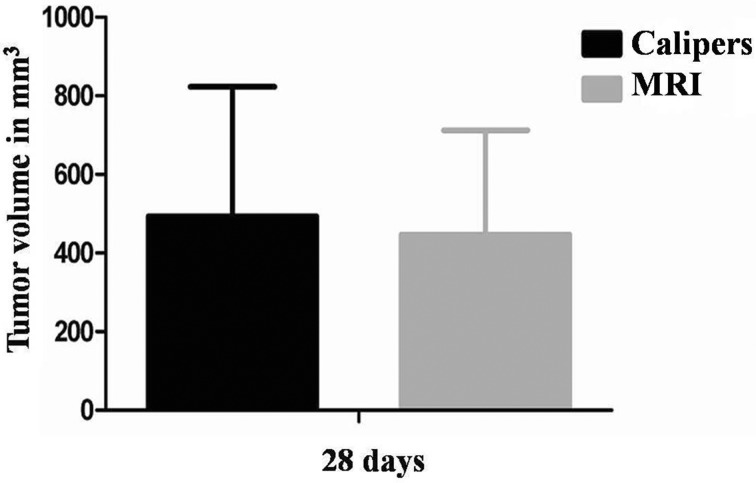
In addition, tumor size was assessed with electronic calipers using the formula V=L × W × H × (π/6). Following the last MRI scan after 28 days of tumor growth, mice were sacrificed. Tumors measured by calipers showed mean volumes of 494 mm3 (±330 mm3) and tumors measured by MRI showed mean volumns of 447 mm3 (±266 mm3). There were not statistical differences between the two groups (P=0.680) (Fig. 4).
Fig. 4.
Tumor growth was monitored by MRI and with calipers at 28 days. There were no statistical differences among the two groups (P=0.680).
Time–signal intensity curve analysis
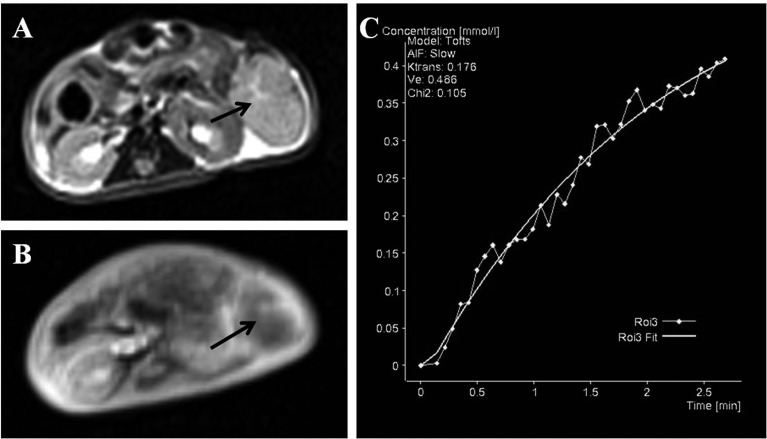
A total of 7 mice were analyzed for these studies. DC E-MRI was performed with the low molecular weight contrast medium Gd-DTPA. A region of interest was manually drawn around the whole tumor volume in the central slice through the tumor, and a slow and gradually increasing enhancement of the tumor was observed with a peak after approximately 3 min (Fig. 5).
Fig. 5.
The typical heterogeneity of contrast enhancement is shown by comparing T2WI (A) and DCE-MRI (B) following the injection of Gd-DTPA. (C) Typical enhancement over time in the whole tumor. Arrows indicate a tumor.
Survival of mice
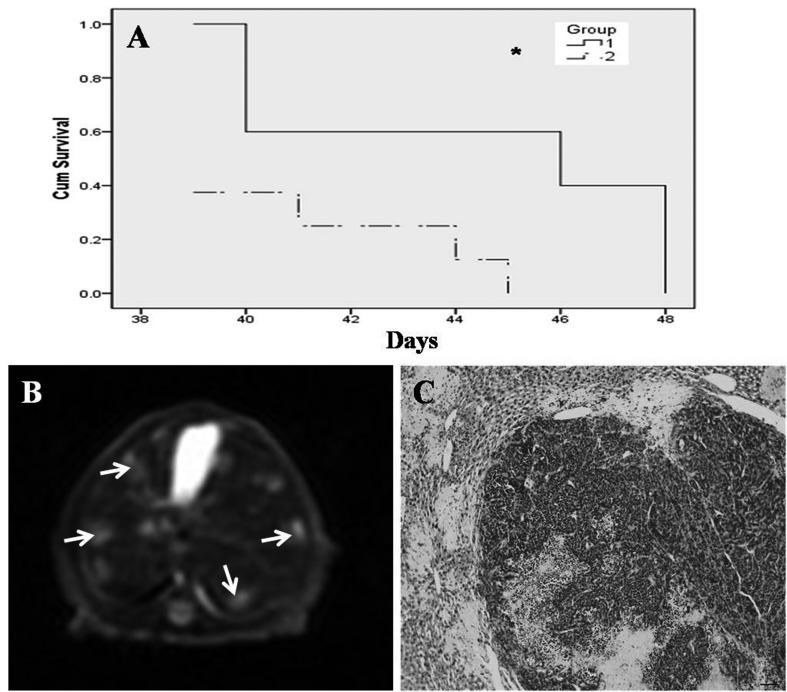
The median survival of mice injected with SW1990 cells (n=8) was 44 days. In contrast, mice injected with MIAPaCa cells (n=8, three mice in the SW1990 group died after the operation, so the actual number of mice in the survival analysis for the SW1990 group was five) displayed a median survival of 41 days. This difference was statistically significant (P=0.027; Fig. 5A). Animals bearing tumors usually died of cachexia and liver metastases. The MIAPaCa-2 group showed liver metastases earlier than the SW1990 group (Figs. 5B and 5C).
Histology and immunohistochemistry assay of orthotopic tumor tissues
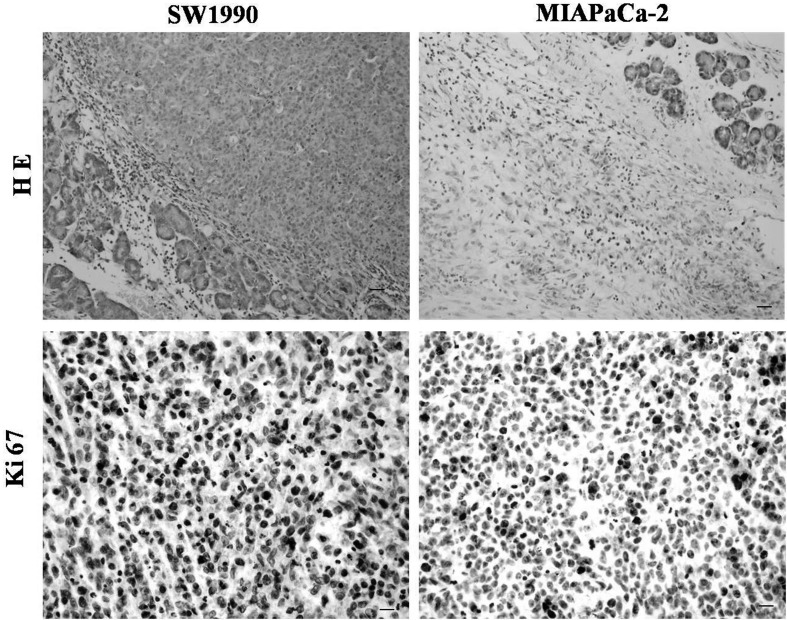
Both cell lines reproducibly formed orthotopic tumors in the juncture of the pancreas body and tail. MIAPaCa-2 tumors displayed a globe-like growth pattern, whereas SW1990 tumors displayed a cylinder-like growth pattern. The SW1990 group developed more larger tumors compared with the MIAPaCa-2 group. We examined the histology of orthotopic tumor tissues using hematoxylin and eosin (H&E) staining in the SW1990 and MIAPaCa-2 groups. The tissues in the two groups showed a typical histological appearance of pancreatic cancer (PC). In addition, as Ki-67 is an accurate index of cell proliferation, we performed immunohistochemistry to detect Ki-67 expression in the two groups. Both tumor tissues showed high expression of Ki-67 (Fig. 6).
Fig. 6.
(A) Survival of mice bearing SW1990 cells (median 44 days) versus MIAPaCa cells (median 41 days; P<0.05, n=8). 1: SW1990 group. 2: MIAPaCa-2 group. (B and C) Liver metastases in the MIAPaCa-2 group. (B) T2-weighted sequences of liver metastasis (arrows) (C) Histopathology. scale bar=50 µm.
Discussion
Currently, there are three primary ways of studying human pancreatic cancer in vivo, namely, the introduction of cancer cells (subcutaneous xenograft model and orthotopic xenograft model), carcinogens (carcinogen models), or modified genes (genetically engineered models) into the rodent’s body or genome. Subcutaneous xenograft models are relatively reliable, inexpensive, fast, and technically simpler when establishing tumors to reach a defined end point for evaluation, but its most notable limitation is that cancer cells are forced to grow under the skin of immunocompromised mice, which is not relevant to human disease [9, 20]. Carcinogen models are the most relevant to human disease in their use of environmental factors to induce progressive tissue changes leading to cancer; however, the cancers that form are not human in origin, and administration of certain chemicals that have broad effects on other tissues diminish their preclinical value [16]. Genetically engineered models mimic relevant genetic mutations that may lead to spontaneous lesions/cancer within the gland. But they are expensive and slow in their development of nonhuman pancreatic cancer [3]. Compare with the aforementioned models, orthotopic xenograft rodents models are an ideal biological system for studying pancreatic cancer, as they can establish a human pancreatic cancer in its native site with the ability to expand relevance to drug evaluations, particularly targeting issues as well as studies that focus on epithelial-mesenchymal transition, invasion, and metastasis [1, 5, 14]. In this study, we introduced an orthotopic model of pancreatic cancer using two different human pancreatic adenocarcinoma cell lines in nude mice: the SW1990 cell line and MIAPaCa-2 cell line. Both cell lines showed typical signs of malignant cells. Although the tumors in the SW1990 group grew faster than those in the MIAPaCa-2 group, the metastasis in the latter occurred earlier than in the former, which is why the SW1990 group survivd longer than the MIAPaCa-2 group. If a fast-growing, more-aggressive cell is required, SW1990 is the cell line of choice. If the study requires a slower growing, less-aggressive cell, then MIAPaCa-2 is the preferred cell line. Orthotopic injection of cancer cells into the murine pancreas requires a highly skilled technique. First, implantation is only possible via laparotomy during anesthesia. The murine pancreas is a soft mobile intraperitoneal organ and very small and to avoid disruption of the pancreatic capsule, the volume of cell suspensions should not exceed 100 µl; to further prevent tumor cell spillage into the peritoneal cavity, a cotton wool tip was pressed onto the injection site for 30 s after finishing direct injection. All injections were carried out by the same person. Employing orthotopic tumor models has also brought up the need for in vivo monitoring of tumor development and possible metastasis formation. For orthotopic tumor models, several murine imaging systems in vivo, including MRI, CT, CT-PET, ultrasound, and bioluminescence and fluorescence imaging techniques, have been developed to assess tumor size and volume. However, the MRI technique combines several advantages, making it the preferred imaging technique. MRI offers better discrimination of soft tissue and local resolution, and in contrast to fluorescence techniques, it images the whole animal. Moreover MRI does not employ any radiation and, in contrast to ultrasonography, it is less investigator dependent [12, 22, 26]. The 3.0 tesla MRI scanner employed in this study has a good spatial resolution. Tumors were always readily detected. Using high-resolution T2-weighted images in the coronal and horizontal planes the tumor volumes could be measured very accurately. Seven days after tumor cell injection, we found the smallest tumor, which was 3 mm × 2 mm × 4.5 mm in size. When using slices of 0.9 mm, and tumor growth was monitored by MRI and with callipers at 28 days; there were no statistical differences among the two groups (P=0.680). Liver metastases were also identified in MRI images. None of these observations required injection of a contrast agent, and all were confirmed by histological analyses at the end of the tumor studies. We also have routinely used the intravenous contrast medium Gd-DTPA for tumor blood flow studies employing an orthotopic murine pancreatic cancer model. Our study demonstrated that the prevalent enhancement curve patterns of pancreatic cancer showed a slow gradually enhancement pattern. The time-signal intensity curve pattern of the murine pancreatic cancer model very closely resembles the human situation [10]. These results proved that MRI is an indispensable tool for monitoring in vivo tumor growth and morphological information in longitudinal studies, thus reducing the number of research animals.
Pancreatic cancer is a complex pathological process of multigene regulation and multistep development. Uncontrolled cell proliferation is an important feature of this process and an important aspect affecting tumor development. The proliferating cell nuclear antigen Ki-67 is a kind of nuclear antigens detected in all proliferating cells (normal and tumor) and Gerdes et al. discovered it in 1983 while studying Hodgkin’s lymphoma cell lines. It was expressed in the entire cell proliferation cycle except in the G0 phase and was used to label proliferating cells of normal or tumor cell populations [4]. Scholars have studied the antigen in many tumors and found that Ki-67 is an accurate index of cell proliferation: the higher the expression, the more active cell proliferation. In addition, the Ki-67 index is closely related to the course of certain tumors such as development, staging, grading, invasion, metastasis and prognosis [23]. Malignancy is mostly characterized by ordinary hyperplasia, atypical hyperplasia, cancer (carcinoma in situ) and invasive carcinoma. Currently, Ki-67 is considered to show low to high expression continuously in this process [6]. With regard to pancreatic cancer, the present study confirmed there was no or low Ki-67 expression in the normal pancreatic tissue, higher expression in atypical hyperplasia tissues, and the highest expression in cancer tissue. So it can be used to aided in the diagnosis and differential diagnosis of pancreatic, especially with respect to the atypical lesions, or identification of chronic pancreatitis [8, 11], Ki-67 is also an important evaluation parameter. In this study, we performed immunohistochemistry to detect Ki-67expression in the SW1990 and MIAPaCa-2 group (Fig. 7). The tumor tissues in the two groups indicated high expression of Ki-67 (Fig. 4) and showed a typical histological appearance of PC.
Fig. 7.
Pathological evaluation of tumor tissue determined by H&E staining; high expression of Ki67 detected by immunohistochemistry. Left panels: SW1990. Right panels: MIAPaCa-2. Scale bars: 20 µm (H&E staining) and 10 µm (Ki67 detected). n=5.
This murine orthotopic pancreatic cancer model closely mimics human pancreatic cancer. Employing a 3.0 tesla MRI scanner allows monitoring of tumor growth, volume, liver metastasis formation, and tumor blood flow. Therefore the number of research animals can be significantly reduced in longitudinal studies.
Acknowledgments
The work was supported by the Shanghai Natural Science Foundation of China (12ZR1429600).
Declaration of conflicting interests
The Authors declare that they have no conflicts of interest.
References
- 1.Alves F., Contag S., Missbach M., Kaspareit J., Nebendahl K., Borchers U., Heidrich B., Streich R., Hiddemann W.2001. An orthotopic model of ductal adenocarcinoma of the pancreas in severe combined immunodeficient mice representing all steps of the metastatic cascade. Pancreas 23: 227–235. doi: 10.1097/00006676-200110000-00002 [DOI] [PubMed] [Google Scholar]
- 2.Brockmann M.A., Kemmling A., Groden C.2007. Current issues and perspectives in small rodent magnetic resonance imaging using clinical MRI scanners. Methods 43: 79–87. doi: 10.1016/j.ymeth.2007.07.001 [DOI] [PubMed] [Google Scholar]
- 3.Ding Y., Cravero J.D., Adrian K., Grippo P.2010. Modeling pancreatic cancer in vivo: from xenograft and carcinogen-induced systems to genetically engineered mice. Pancreas 39: 283–292. doi: 10.1097/MPA.0b013e3181c15619 [DOI] [PubMed] [Google Scholar]
- 4.Gerdes, J., Schwab, U., Lemke, H., Stein, H.1983. Production of a mouse monoclonal antibody reactive with a human nuclear antigen associated with cell proliferation. Int. J. Cancer 15; 31:13–20. [DOI] [PubMed] [Google Scholar]
- 5.Hotz H.G., Hines O.J., Foitzik T., Reber H.A.2000. Animal models of exocrine pancreatic cancer. Int. J. Colorectal Dis. 15: 136–143. doi: 10.1007/s003840000229 [DOI] [PubMed] [Google Scholar]
- 6.Hubosky S.G., Fabrizio M.D., Schellhammer P.F., Barone B.B., Tepera C.M., Given R.W.2007. Single center experience with third-generation cryosurgery for management of organ-confined prostate cancer: critical evaluation of short-term outcomes, complications, and patient quality of life. J. Endourol. 21: 1521–1531. doi: 10.1089/end.2007.9875 [DOI] [PubMed] [Google Scholar]
- 7.Jemal A., Bray F., Center M.M., Ferlay J., Ward E., Forman D.2011. Global cancer statistics. CA Cancer J. Clin. 61: 69–90. doi: 10.3322/caac.20107 [DOI] [PubMed] [Google Scholar]
- 8.Jeong S., Lee D.H., Lee J.I., Lee J.W., Kwon K.S., Kim P.S., Kim H.G., Shin Y.W., Kim Y.S., Kim Y.B.2005. Expression of Ki-67, p53, and K-ras in chronic pancreatitis and pancreatic ductal adenocarcinoma. World J. Gastroenterol. 11: 6765–6769. [DOI] [PMC free article] [PubMed] [Google Scholar]
- 9.Jimeno A., Feldmann G., Suárez-Gauthier A., Rasheed Z., Solomon A., Zou G.M., Rubio-Viqueira B., García-García E., López-Ríos F., Matsui W., Maitra A., Hidalgo M.2009. A direct pancreatic cancer xenograft model as a platform for cancer stem cell therapeutic development. Mol. Cancer Ther. 8: 310–314. doi: 10.1158/1535-7163.MCT-08-0924 [DOI] [PMC free article] [PubMed] [Google Scholar]
- 10.Kim J.H., Lee J.M., Park J.H., Kim S.C., Joo I., Han J.K., Choi B.I.2013. Solid pancreatic lesions: characterization by using timing bolus dynamic contrast-enhanced MR imaging assessment—a preliminary study. Radiology 266: 185–196. doi: 10.1148/radiol.12120111 [DOI] [PubMed] [Google Scholar]
- 11.Klein W.M, Hruban R.H, Klein-Szanto A.J., Wilentz R.E. 2002. Direct correlation between proliferative activity and dysplasia in pancreatic intraepithelial neoplasia (PanIN): additional evidence for a recently proposed model of progression. Mod. Pathol. 15: 441–447. [DOI] [PubMed] [Google Scholar]
- 12.Koo V., Hamilton P.W., Williamson K.2006. Non-invasive in vivo imaging in small animal research. Cell. Oncol. 28: 127–139. [DOI] [PMC free article] [PubMed] [Google Scholar]
- 13.Krejs G.J.2010. Pancreatic cancer: epidemiology and risk factors. Dig. Dis. 28: 355–358. doi: 10.1159/000319414 [DOI] [PubMed] [Google Scholar]
- 14.Loukopoulos P., Kanetaka K., Takamura M., Shibata T., Sakamoto M., Hirohashi S.2004. Orthotopic transplantation models of pancreatic adenocarcinoma derived from cell lines and primary tumors and displaying varying metastatic activity. Pancreas 29: 193–203. doi: 10.1097/00006676-200410000-00004 [DOI] [PubMed] [Google Scholar]
- 15.Moore P.S., Sipos B., Orlandini S., Sorio C., Real F.X., Lemoine N.R., Gress T., Bassi C., Klöppel G., Kalthoff H., Ungefroren H., Löhr M., Scarpa A.2001. Genetic profile of 22 pancreatic carcinoma cell lines. Analysis of K-ras, p53, p16 and DPC4/Smad4. Virchows Arch. 439: 798–802. doi: 10.1007/s004280100474 [DOI] [PubMed] [Google Scholar]
- 16.Osvaldt A.B., Wendt L.R., Bersch V.P., Backes A.N., de Cássia, A., Schumacher R., Edelweiss M.I., Rohde L.2006. Pancreatic intraepithelial neoplasia and ductal adenocarcinoma induced by DMBA in mice. Surgery 140: 803–809. doi: 10.1016/j.surg.2006.02.012 [DOI] [PubMed] [Google Scholar]
- 17.Partecke I.L., Kaeding A., Sendler M., Albers N., Kühn J.P., Speerforck S., Roese S., Seubert F., Diedrich S., Kuehn S., Weiss U.F., Mayerle J., Lerch M.M., Hadlich S., Hosten N., Heidecke C.D., Puls R., von Bernstorff W.2011. In vivo imaging of pancreatic tumours and liver metastases using 7 Tesla MRI in a murine orthotopic pancreatic cancer model and a liver metastases model. BMC Cancer 11: 40. doi: 10.1186/1471-2407-11-40 [DOI] [PMC free article] [PubMed] [Google Scholar]
- 18.Partecke L.I., Sendler M., Kaeding A., Weiss F.U., Mayerle J., Dummer A., Nguyen T.D., Albers N., Speerforck S., Lerch M.M., Heidecke C.D., von Bernstorff W., Stier A.2011. A syngeneic orthotopic murine model of pancreatic adenocarcinoma in the C57/BL6 mouse using the Panc02 and 6606PDA cell lines. Eur. Surg. Res. 47: 98–107. doi: 10.1159/000329413 [DOI] [PubMed] [Google Scholar]
- 19.Michl P., Gress T.M.2013. Current concepts and novel targets in advanced pancreatic cancer. Gut 62: 317–326. doi: 10.1136/gutjnl-2012-303588 [DOI] [PubMed] [Google Scholar]
- 20.Rubio-Viqueira B., Jimeno A., Cusatis G., Zhang X., Iacobuzio-Donahue C., Karikari C., Shi C., Danenberg K., Danenberg P.V., Kuramochi H., Tanaka K., Singh S., Salimi-Moosavi H., Bouraoud N., Amador M.L., Altiok S., Kulesza P., Yeo C., Messersmith W., Eshleman J., Hruban R.H., Maitra A., Hidalgo M.2006. An in vivo platform for translational drug development in pancreatic cancer. Clin. Cancer Res. 12: 4652–4661. doi: 10.1158/1078-0432.CCR-06-0113 [DOI] [PubMed] [Google Scholar]
- 21.Russel W.M.S., Burch R.L.1959. The Principles of Humane Experimental Technique. London, Methuen: 69–154. [Google Scholar]
- 22.Schmidt G.P., Wintersperger B., Graser A., Baur-Melnyk A., Reiser M.F., Schoenberg S.O.2007. High-resolution whole-body magnetic resonance imaging applications at 1.5 and 3 Tesla: a comparative study. Invest. Radiol. 42: 449–459. doi: 10.1097/01.rli.0000262089.55618.18 [DOI] [PubMed] [Google Scholar]
- 23.Scholzen T., Gerdes J.2000. The Ki-67 protein: from the known and the unknown. J. Cell. Physiol. 182: 311–322. doi: [DOI] [PubMed] [Google Scholar]
- 24.Sipos B., Möser S., Kalthoff H., Török V., Löhr M., Klöppel G.2003. A comprehensive characterization of pancreatic ductal carcinoma cell lines: towards the establishment of an in vitro research platform. Virchows Arch. 442: 444–452. [DOI] [PubMed] [Google Scholar]
- 25.Tomayko M.M., Reynolds C.P.1989. Determination of subcutaneous tumor size in athymic (nude) mice. Cancer Chemother. Pharmacol. 24: 148–154. doi: 10.1007/BF00300234 [DOI] [PubMed] [Google Scholar]
- 26.Wang H., Van de Putte M., Chen F., De Keyzer F., Jin L., Yu J., Marchal G., de Witte P., Ni Y.2008. Murine liver implantation of radiation-induced fibrosarcoma: characterization with MR imaging, microangiography and histopathology. Eur. Radiol. 18: 1422–1430. doi: 10.1007/s00330-008-0904-2 [DOI] [PubMed] [Google Scholar]


