

Abstract
Objectives
To evaluate the associations between maternal age and obstetric and neonatal outcomes in primiparous women with emphasis on teenagers and older women.
Design
A population-based cohort study.
Setting
The Swedish Medical Birth Register.
Participants
Primiparous women with singleton births from 1992 through 2010 (N=798 674) were divided into seven age groups: <17 years, 17–19 years and an additional five 5-year classes. The reference group consisted of the women aged 25–29 years.
Primary outcome
Obstetric and neonatal outcome.
Results
The teenager groups had significantly more vaginal births (adjusted OR (aOR) 2.04 (1.79 to 2.32) and 1.95 (1.88 to 2.02) for age <17 years and 17–19 years, respectively); fewer caesarean sections (aOR 0.57 (0.48 to 0.67) and 0.55 (0.53 to 0.58)), and instrumental vaginal births (aOR 0.43 (0.36 to 0.52) and 0.50 (0.48 to 0.53)) compared with the reference group. The opposite was found among older women reaching a fourfold increased OR for caesarean section. The teenagers showed no increased risk of adverse neonatal outcome but presented an increased risk of prematurity <32 weeks (aOR 1.66 (1.10 to 2.51) and 1.20 (1.04 to 1.38)). Women with advancing age (≥30 years) revealed significantly increased risk of prematurity, perineal lacerations, preeclampsia, abruption, placenta previa, postpartum haemorrhage and unfavourable neonatal outcomes compared with the reference group.
Conclusions
For clinicians counselling young women it is of importance to highlight the obstetrically positive consequences that fewer maternal complications and favourable neonatal outcomes are expected. The results imply that there is a need for individualising antenatal surveillance programmes and obstetric care based on age grouping in order to attempt to improve the outcomes in the age groups with less favourable obstetric and neonatal outcomes. Such changes in surveillance programmes and obstetric interventions need to be evaluated in further studies.
Keywords: maternal age, obstetric outcome, neonatal outcome
Strengths and limitations of this study.
A strength of the present study is that it includes primiparous women of an entire country in which an antenatal care programme is equally available to all pregnant women and is comprehensive.
Another advantage is the large number of individuals available for evaluation, which makes it possible to divide the study population into subgroups with sufficient numbers in each stratum to provide high statistical power.
A limitation is that the external validity is reduced to facilities with similar socioeconomic and demographic characteristics and healthcare systems with comparable standards.
The Swedish Medical Birth Register contain a large body of information concerning the mother and the child but only the available data in the register could be used for outcome evaluation and adjustments for putative confounders.
Introduction
There are a large number of studies evaluating obstetric and neonatal outcome over the full range of reproductive maternal ages, especially with a focus on the youngest and the oldest mothers. Young mothers have been shown to be exposed to an increased risk of anaemia, low birth weight, fetal death, eclampsia and preterm birth although, at the same time, they were more likely to have a spontaneous normal vaginal birth and the risk of preeclampsia and postpartum haemorrhage (PPH) were significantly decreased.1–6 These studies evaluated outcomes in low-income countries. Many studies performed in low-income countries presented in recent years on the topic of teenage pregnancies have found similar obstetric and neonatal outcomes.7–11
Complications during pregnancy and birth at an advanced maternal age (either defined as 35 years and older or 40 years or older) have also been evaluated in high-income countries. Advanced maternal age at birth has been found to be associated with gestational diabetes, preeclampsia, placenta previa, caesarean section (CS), placental abruption, preterm delivery, low birth weight, intrauterine fetal death and increased perinatal mortality.12–20 The difference in obstetric and neonatal outcomes between teenagers and women at advanced age seemed to be lower risks for several unwanted and threatening outcomes in the teenage group; thus there were no obvious advantages concerning obstetric and neonatal outcomes at advanced maternal ages. The earlier published studies concerning the impact of maternal age on perinatal outcome differ in many aspects methodologically as well as in the sociodemographic characteristics of the populations and healthcare systems. All these factors make interpretation of comparisons between data sets difficult.
Sweden has, during several decades, actively developed strategies in social care, education and healthcare in order to improve antenatal care and parenthood. In a Swedish state-of-the-art conference held in 1990, the scientific basis of the routine antenatal programme was critically evaluated. It was concluded that the scientific evidence to support the timing and contents of routine visits was unsatisfactory.21 Consequently, there is a constant need for evaluation both of single diagnostic procedures and intervention and of outcomes. An analysis of perinatal outcomes in relation to maternal age in the Swedish population will provide important knowledge that may be used to further improve social, antenatal, obstetric and neonatal care and reveals risk groups that in particular may need more attention in antenatal care.
The objective of the present study was to assess the impact of maternal age on obstetric and neonatal outcomes among singleton primiparous women in Sweden, with special emphasis on adolescents and older mothers.
Materials and methods
This study analyses the obstetric and neonatal outcomes of all singleton primiparous women prospectively registered in the Swedish Medical Birth Register (MBR) who gave births from 1 January 1992 through 31 December 2010. MBR has collected information about births in Sweden since 1973. It is compulsory for every healthcare provider to report to the MBR. Medical and other data on almost all (99%) births in Sweden are listed in the register, which also includes stillbirths. Starting with the first antenatal visit, usually in gestational weeks 10–12, the information is collected prospectively in standardised medical record forms completed at the maternity healthcare centres at antenatal care visits, in the birth units, and at the paediatric examination of the newborn. The standardised medical records are identical throughout the country. A description and validation of the register content is available.22–24
The study population was grouped according to maternal age into seven subgroups: <17; 17–19; 20–24, 25–29, 30–34; 35–39 and 40+ years. In the outcome analyses we selected the group of women aged 25–29 years as reference group.
The list of available variables in MBR has been extended throughout the years that the register has been active. The obstetric and neonatal outcome data for the purpose of this study are those that have been available since 1992. From 1992 until June 2008 the MBR includes stillbirths after 28 weeks of gestation and from July 2008 until 2010 all stillbirths after 22 weeks of gestation are included. Each outcome studied was either marked in the MBR or registered according to the International Statistical Classification of Diseases and Related Health Problems (ICD). The obstetric outcome variables studied were gestational age, mode of delivery (normal vaginal birth (defined as neither instrumental vaginal delivery, nor CS), CS, instrumental vaginal delivery divided into forceps and vacuum extraction), mode of onset of labour, perineal laceration, preeclampsia, abruptio placentae, placenta previa, use of epidural analgesia and PPH exceeding 1000 mL. The fetal and neonatal outcomes evaluated were Apgar score at 5 min, fetal distress (ICD code P20.0, P20.1 and P20.9), aspiration of meconium (ICD code P24.0), shoulder dystocia (ICD code O66.0) and stillbirth. Small-for-gestational age (SGA) newborns were defined as those with birth weight more than 2 SD below the mean birth weight for gestational age (sex and parity specific) according to a Swedish reference curve.25 Large-for-gestational age (LGA) newborns were those with a birth weight above 2 SD. All descriptive and background data were extracted from the MBR. The register information on these variables was obtained from the antenatal care centre records.
Statistical analysis
Data are presented as counts and per cent or mean and 1 SD. Logistic regression analyses were used for comparison of groups for categorical data. Data on a continuous scale were compared using analysis of covariance. Multivariate logistic regression models were used in order to adjust comparisons for confounding factors. Consequently crude and adjusted ORs (OR and aOR) and 95% CIs are reported. Maternal weight and height (used for calculation of maternal body mass index (BMI)) and smoking habits in early pregnancy (unknown, no smoking, smoking) and year of birth were included as confounders in the adjusted analyses. The simultaneous model of including independent variables in the multivariate logistic regression was used since we found it most appropriate for the relevance of the research goal of the study. Such a research strategy is appropriate when there is no logical or theoretical basis for considering any variable to be prior to any other, either in terms of a hypothetical causal structure of the data or in terms of its relevance to the research goals of focusing on prediction and explanation.
The rationale for including year of birth as an independent variable was that there was variability in the occurrence of obstetric and neonatal diagnoses during the observation period. This may be due to true changes but may also be a result of changes in recording with expanding use of computerised medical records. Maternal BMI and smoking were included as covariates in the adjusted analyses based on their well-known associations with maternal and fetal outcome and their unequal distribution over the maternal age strata.26 27 BMI was included as a continuous variable as the distribution of maternal BMI was almost uniform over the maternal age strata and the association between BMI and maternal age was almost linear (presented as means and SDs in table 1). For the purpose of this study gestational age was added to the confounders in the analyses of CS, preeclampsia and birth weight based on their clinically well-known associations.25 28 29 The OR for instrumental vaginal delivery was calculated among women with vaginal births only in order to exclude women with an instrumental attempt to deliver followed by an emergency CS. The ORs of perineal lacerations were also estimated among women with vaginal births only. The information concerning use of epidural analgesia was also restricted to vaginal births only. Epidural is an analgesic method that has been widely used in the delivery wards for vaginal births during the entire time period. In contrast the use of epidural analgesia in CS has varied substantially over the time period and has almost exclusively been used in elective CS. Our purpose was to evaluate the OR for epidural use over the maternal age strata and consequently we selected the mode of delivery that exhibited the least variation in the use of the analgesic method over the time period, that is, vaginal births.
Table 1.
Descriptive data of primiparous women with singleton births in the period 1992–2010
| Characteristics | <17 years (n=2392) |
17–19 years (n=29 816) |
20–24 years (n=185 942) |
25–29 years (n=300 822) |
30–34 years (n=205 905) |
35–39 years (n=63 163) |
40+ years (n=10 634) |
|||||||
|---|---|---|---|---|---|---|---|---|---|---|---|---|---|---|
| BMI (kg/m2) | 22.8 | 3.7 | 23.2 | 4.1 | 23.8 | 4.3 | 23.7 | 4.0 | 23.8 | 4.0 | 24.4 | 4.1 | 24.7 | 4.3 |
| BMI* class (kg/m2) | ||||||||||||||
| <18.5 | 135 | 5.6% | 1815 | 6.1% | 7650 | 4.1% | 7509 | 2.5% | 3847 | 1.9% | 918 | 1.5% | 133 | 1.3% |
| 18.5–24.9 | 1352 | 56.5% | 16 823 | 56.4% | 104 600 | 56.3% | 180 163 | 59.9% | 122 571 | 59.5% | 34 439 | 54.5% | 5381 | 50.1% |
| 25.0–29.9 | 315 | 13.2% | 4687 | 15.7% | 33 961 | 18.3% | 53 896 | 17.9% | 37 234 | 18.1% | 13 310 | 21.1% | 2442 | 23.0% |
| 30.0–34.9 | 81 | 3.4% | 1327 | 4.5% | 10 550 | 5.7% | 14 401 | 4.8% | 9389 | 4.6% | 3575 | 5.7% | 683 | 6.4% |
| 35–39.9 | 11 | 0.5% | 337 | 1.1% | 3013 | 1.6% | 4070 | 1.4% | 2724 | 1.3% | 1024 | 1.6% | 188 | 1.8% |
| ≥40.0 | 4 | 0.2% | 87 | 0.3% | 904 | 0.5% | 1312 | 0.4% | 944 | 0.5% | 342 | 0.5% | 68 | 0.6% |
| Missing data | 494 | 20.7% | 4740 | 15.9% | 25 264 | 13.6% | 39 471 | 13.1% | 29 196 | 14.2% | 9555 | 15.1% | 1739 | 16.4% |
| Smoking* | ||||||||||||||
| Yes | 666 | 27.8% | 9012 | 30.2% | 31 675 | 17.0% | 24 676 | 8.2% | 13 971 | 6.8% | 5287 | 8.4% | 958 | 9.0% |
| No | 1542 | 64.5% | 19 154 | 64.3% | 145 695 | 78.4% | 261 348 | 86.9% | 178 792 | 86.8% | 53 416 | 84.6% | 8883 | 83.5% |
| Missing data | 184 | 7.7% | 1650 | 5.5% | 8572 | 4.6% | 14 798 | 4.9% | 13 142 | 6.4% | 4460 | 7.0% | 793 | 7.5% |
| Gestational age | ||||||||||||||
| Information available | 2368 | 99.0% | 29 715 | 99.7% | 185 700 | 99.9% | 300 603 | 99.9% | 205 719 | 99.9% | 63 098 | 99.9% | 10 620 | 99.9% |
| Missing data | 24 | 1.0% | 101 | 0.3% | 242 | 0.1% | 219 | 0.1% | 186 | 0.1% | 65 | 0.1% | 14 | 0.1% |
Figures denote mean and SD or counts and proportions.
*Reported height, weight and smoking habits at first antenatal visit.
BMI, body mass index.
The software STATISTICA 64 V.10 (StatSoft Inc 2300 East 14th St. Tulsa, Oklahoma 74104, USA) was used to carry out the statistical analyses.
Results
In the period 1992–2010, 798 732 women were registered in the MBR as giving birth to their first child. The annual number of primiparous women giving birth varied between 34 060 and 49 417. Information on maternal age was missing in 58 cases leaving 798 674 women for the analyses. The average age of primiparous women increased substantially from 26.2 years in 1992 to 28.5 in 2004; thereafter it has stayed almost constant at that level. The demographic, obstetric and neonatal data subdivided into maternal age groups are presented in tables 1 and 2.
Table 2.
Obstetric and neonatal outcome characteristics of primiparous women with singleton births in the period 1992–2010
| Characteristics | Age groups |
|||||||||||||
|---|---|---|---|---|---|---|---|---|---|---|---|---|---|---|
| <17 years (n=2392) |
17–19 years (n=29 816) |
20–24 years (n=185 942) |
25–29 years (n=300 822) |
30–34 years (n=205 905) |
35–39 years (n=63 163) |
40+ years (n=10 634) |
||||||||
| Labour | ||||||||||||||
| Spontaneous onset labour | 2055 | 85.9% | 25 853 | 86.7% | 158 879 | 85.4% | 251 340 | 83.6% | 163 876 | 79.6% | 45 330 | 71.2% | 6261 | 58.9% |
| Induced labour | 184 | 7.7% | 2528 | 8.5% | 17 433 | 9.4% | 30 873 | 10.3% | 25 474 | 12.4% | 10 065 | 15.9% | 2111 | 19.9% |
| Mode of delivery | ||||||||||||||
| Normal vaginal birth | 2030 | 84.9% | 25 096 | 84.2% | 147 082 | 79.1% | 219 993 | 73.1% | 135 099 | 65.6% | 35 112 | 55.6% | 4724 | 44.4% |
| Forceps | 7 | 0.3% | 126 | 0.4% | 1143 | 0.6% | 2166 | 0.7% | 1515 | 0.7% | 575 | 0.9% | 84 | 0.8% |
| Vacuum extraction | 143 | 6.0% | 2090 | 7.0% | 18 011 | 9.7% | 36 696 | 12.2% | 29 811 | 14.5% | 10 119 | 16.0% | 1599 | 15.0% |
| CS* | 213 | 8.9% | 2500 | 8.4% | 19 747 | 10.6% | 42 044 | 14.0% | 39 534 | 19.2% | 17 355 | 27.5% | 4226 | 39.7% |
| CS elective 1999–2010† | 53 | 2.2% | 373 | 1.3% | 2828 | 1.5% | 6973 | 2.3% | 7656 | 3.7% | 3853 | 6.1% | 1132 | 10.6% |
| CS acute 1999–2010† | 73 | 3.1% | 882 | 3.0% | 7092 | 3.8% | 16 651 | 5.5% | 17 953 | 8.7% | 7826 | 12.4% | 1798 | 16.9% |
| Gestational age (weeks) | ||||||||||||||
| GA <28 | 20 | 0.8% | 107 | 0.4% | 464 | 0.2% | 743 | 0.2% | 640 | 0.3% | 292 | 0.5% | 73 | 0.7% |
| GA <32 | 40 | 1.7% | 308 | 1.0% | 1436 | 0.8% | 2415 | 0.8% | 2048 | 1.0% | 900 | 1.4% | 206 | 1.9% |
| GA <37 | 213 | 8.9% | 1937 | 6.5% | 11 030 | 5.9% | 18 005 | 5.6% | 12 727 | 6.2% | 4586 | 7.3% | 877 | 8.2% |
| GA 37–41 | 1990 | 83.2% | 25 811 | 86.6% | 161 043 | 86.6% | 257 320 | 85.5% | 172 621 | 83.8% | 51 494 | 81.5% | 8786 | 82.6% |
| GA ≥42 | 165 | 6.9% | 1967 | 6.6% | 13 627 | 7.3% | 25 278 | 8.4% | 20 371 | 9.9% | 7018 | 11.1% | 957 | 9.0% |
| Maternal complications and use of epidural analgesia | ||||||||||||||
| Perineal laceration grades 1–2‡ | 311 | 14.3% | 3982 | 14.6% | 32 602 | 19.6% | 70 452 | 27.3% | 55 163 | 33.2% | 15 477 | 33.9% | 2116 | 33.1% |
| Perineal laceration grades 3–4‡ | 23 | 1.1% | 272 | 1.0% | 3030 | 1.8% | 8202 | 3.2% | 6846 | 4.1% | 1856 | 4.1% | 222 | 3.5% |
| Preeclampsia | 43 | 1.8% | 576 | 1.9% | 4317 | 2.3% | 6520 | 2.2% | 4265 | 2.1% | 1610 | 2.5% | 365 | 3.4% |
| Abruptio placentae | 16 | 0.7% | 135 | 0.5% | 643 | 0.3% | 1171 | 0.4% | 955 | 0.5% | 390 | 0.6% | 87 | 0.8% |
| Placenta previa | 2 | 0.1% | 16 | 0.1% | 159 | 0.1% | 505 | 0.2% | 612 | 0.3% | 375 | 0.6% | 89 | 0.8% |
| PPH >1000 mL (VB) | 65 | 3.0% | 667 | 2.4% | 5078 | 3.1% | 10 931 | 4.2% | 9720 | 5.9% | 3173 | 6.9% | 485 | 7.6% |
| PPH >1000 mL (CS) | 2 | 0.9% | 28 | 1.1% | 252 | 1.3% | 541 | 1.3% | 578 | 1.5% | 237 | 1.4% | 80 | 1.9% |
| Epidural analgesia‡ | 903 | 41.4% | 11 569 | 42.4% | 68 332 | 41.1% | 105 266 | 40.7% | 70 691 | 42.5% | 20 151 | 44.0% | 2743 | 42.9% |
| Neonatal | ||||||||||||||
| Fetal distress | 8 | 0.3% | 122 | 0.4% | 932 | 0.5% | 1621 | 0.5% | 1070 | 0.5% | 388 | 0.6% | 56 | 0.5% |
| Fetal distress | 8 | 0.3% | 122 | 0.4% | 932 | 0.5% | 1621 | 0.5% | 1070 | 0.5% | 388 | 0.6% | 56 | 0.5% |
| Aspiration of meconium | 0 | 0% | 30 | 0.1% | 363 | 0.2% | 649 | 0.2% | 563 | 0.3% | 193 | 0.3% | 42 | 0.4% |
| Shoulder dystocia | 6 | 0.3% | 78 | 0.3% | 793 | 0.4% | 1580 | 0.5% | 1382 | 0.7% | 489 | 0.8% | 79 | 0.7% |
| Stillbirth | 7 | 0.3% | 102 | 0.3% | 571 | 0.3% | 893 | 0.3% | 768 | 0.4% | 347 | 0.5% | 87 | 0.8% |
| SGA | 91 | 3.8% | 1136 | 3.8% | 6016 | 3.2% | 8831 | 2.9% | 7216 | 3.5% | 2962 | 4.7% | 617 | 5.8% |
| LGA | 47 | 2.0% | 539 | 1.8% | 3838 | 2.1% | 5943 | 2.0% | 3846 | 1.9% | 1279 | 2.0% | 224 | 2.1% |
| Apgar score <7 at 5 min | 43 | 1.8% | 381 | 1.3% | 2409 | 1.3% | 4158 | 1.4% | 3354 | 1.6% | 1274 | 2.0% | 240 | 2.3% |
| Birth weight (g) | 3348 | 592 | 3403 | 565 | 3453 | 554 | 3470 | 555 | 3452 | 572 | 3415 | 612 | 3360 | 640 |
Figures denote counts and proportions or mean and 1 SD.
*All CS independent of status of performance—acute or elective.
†CS was subdivided into elective and acute CS from 1999.
‡Epidural analgesia and perineal lacerations in vaginal births only.
CS, caesarean section; GA, gestational age at birth; LGA, large-for-gestational age; PPH, postpartum haemorrhage; SGA, small-for-gestational age; VB, vaginal birth.
The crude odds rates and the results of the multivariate analyses models of obstetric and neonatal outcomes are shown in tables 3 and 4, respectively.
Table 3.
Obstetric outcome data in singleton primiparous women in the period 1992–2010 in relation to maternal age group
| Characteristics | Crude OR (95% CI) | aOR (95% CI)* | Crude OR (95% CI) | aOR (95% CI)* | Crude OR (95% CI) | aOR (95% CI)* |
|---|---|---|---|---|---|---|
| Labour | <17 years | 17–19 years | 20–24 years | |||
| Spontaneous onset labour | 1.20 (1.07 to 1.35) | 1.20 (1.05 to 1.37) | 1.28 (1.24 to 1.33) | 1.26 (1.21 to 1.31) | 1.16 (1.14 to 1.17) | 1.16 (1.14 to 1.18) |
| Induced labour | 0.73 (0.63 to 0.85) | 0.78 (0.66 to 0.93) | 0.81 (0.78 to 0.85) | 0.86 (0.82 to 0.90) | 0.90 (0.89 to 0.92) | 0.91 (0.90 to 0.93) |
| 30–34 years | 35–39 years | 40+ years | ||||
| Spontaneous onset labour | 0.77 (0.76 to 0.78) | 0.78 (0.77 to 0.79) | 0.50 (0.49 to 0.51) | 0.52 (0.51 to 0.54) | 0.29 (0.26 to 0.30) | 0.30 (0.28 to 0.31) |
| Induced labour | 1.23 (1.21 to 1.26) | 1.19 (1.17 to 1.21) | 1.66 (1.62 to 1.70) | 1.54 (1.50 to 1.58) | 2.17 (2.06 to 2.27) | 1.97 (1.87 to 2.08) |
| Mode of delivery | <17 years | 17–19 years | 20–24 years | |||
| Normal vaginal birth | 2.05 (1.84 to 2.30) | 2.04 (1.79 to 2.32) | 1.95 (1.89 to 2.02) | 1.95 (1.88 to 2.02) | 1.39 (1.37 to 1.41) | 1.39 (1.37 to 1.41) |
| Forceps† | 0.38 (0.18 to 0.81) | 0.41 (0.18 to 0.92) | 0.55 (0.46 to 0.64) | 0.48 (0.39 to 0.59) | 0.82 (0.76 to 0.88) | 0.77 (0.71 to 0.84) |
| Vacuum extraction† | 0.42 (0.36 to 0.51) | 0.43 (0.36 to 0.52) | 0.50 (0.48 to 0.53) | 0.50 (0.48 to 0.53) | 0.74 (0.72 to 0.75) | 0.74 (0.72 to 0.75) |
| CS: all | 0.60 (0.52 to 0.69) | 0.57 (0.48 to 0.67) | 0.56 (0.54 to 0.69) | 0.55 (0.53 to 0.58) | 0.73 (0.72 to 0.74) | 0.72 (0.71 to 0.74) |
| CS elective 1999–2010‡ | 0.95 (0.73 to 1.25) | 0.83 (0.60 to 1.14) | 0.53 (0.48 to 0.59) | 0.53 (0.47 to 0.60) | 0.65 (0.62 to 0.68) | 0.68 (0.65 to 0.71) |
| CS acute 1999–2010‡ | 0.54 (0.43 to 0.68) | 0.53 (0.40 to 0.69) | 0.52 (0.49 to 0.56) | 0.56 (0.52 to 0.61) | 0.68 (0.66 to 0.70) | 0.71 (0.69 to 0.73) |
| 30–34 years | 35–39 years | 40+ years | ||||
| Normal vaginal delivery | 0.70 (0.69 to 0.71) | 0.72 (0.71 to 0.73) | 0.46 (0.45 to 0.47) | 0.48 (0.47 to 0.49) | 0.29 (0.28 to 0.31) | 0.31 (0.30 to 0.32) |
| Forceps† | 1.08 (1.01 to 1.15) | 1.20 (1.12 to 1.29) | 1.48 (1.35 to 1.63) | 1.66 (1.49 to 1.84) | 1.58 (1.27 to 1.98) | 1.75 (1.37 to 2.24) |
| Vacuum extraction† | 1.32 (1.30 to 1.34) | 1.29 (1.27 to 1.32) | 1.72 (1.67 to 1.76) | 1.67 (1.63 to 1.72) | 2.01 (1.90 to 2.13) | 1.92 (1.80 to 2.04) |
| CS: all | 1.46 (1.44 to 1.49) | 1.44 (1.42 to 1.47) | 2.34 (2.29 to 2.38) | 2.21 (2.16 to 2.26) | 4.07 (3.91 to 4.23) | 3.78 (3.61 to 3.96) |
| CS elective 1999–2010‡ | 1.63 (1.57 to 1.68) | 1.44 (1.39 to 1.49) | 2.74 (2.63 to 2.85) | 2.25 (2.15 to 2.35) | 5.03 (4.70 to 5.36) | 3.89 (3.61 to 4.20) |
| CS acute 1999–2010‡ | 1.63 (1.59 to 1.67) | 1.44 (1.40 to 1.47) | 2.41 (2.35 to 2.48) | 1.94 (1.88 to 2.00) | 3.47 (3.29 to 3.66) | 2.68 (2.52 to 2.85) |
| Gestational age (weeks) | <17 years | 17–19 years | 20–24 years | |||
| GA <28 | 3,44 (2.20 to 5.37) | 2.84 (1.59 to 5.06) | 1.46 (1.19 to 1.79) | 1.25 (0.97 to 1.62) | 1.01 (0.90 to 1.14) | 0.89 (0.77 to 1.02) |
| GA <32 | 2.12 (1.55 to 2.91) | 1.66 (1.10 to 2.51) | 1.29 (1.15 to 1.46) | 1.20 (1.04 to 1.38) | 0.96 (0.90 to 1.03) | 0.92 (0.85 to 0.99) |
| GA <37 | 1.55 (1.34 to 1.79) | 1.46 (1.24 to 1.72) | 1.09 (1.04 to 1.15) | 1.03 (0.98 to 1.09) | 0.99 (0.97 to 1.02) | 0.97 (0.95 to 1.00) |
| GA 37–41 | 0.89 (0.79 to 0.99) | 0.88 (0.77 to 0.99) | 1.11 (1.07 to 1.15) | 1.14 (1.09 to 1.18) | 1.10 (2.08 to 1.12) | 1.12 (1.10 to 1.14) |
| GA ≥42 | 0.82 (0.70 to 0.96) | 0.89 (0.75 to 1.06) | 0.77 (0.74 to 0.81) | 0.79 (0.74 to 0.83) | 0.86 (0.84 to 0.88) | 0.85 (0.83 to 0.87) |
| 30–34 years | 35–39 years | 40+ years | ||||
| GA <28 | 1.26 (1.13 to 1.40) | 1.17 (1.04 to 1.33) | 1.88 (1.64 to 2.15) | 1.61 (1.40 to 1.90) | 2.79 (2.19 to 3.56) | 2.48 (1.86 to 3.29) |
| GA <32 | 1.24 (1–17 to 1.32) | 1.24 (1.16 to 1.33) | 1.79 (1.65 to 1.93) | 1.68 (1.53 to 1.84) | 2.44 (2.12 to 2.82) | 2.25 (1.90 to 2.66) |
| GA <37 | 1.04 (1.01 to 1.06) | 1.02 (0.99 to 1.05) | 1.23 (1–19 to 1.27) | 1.19 (1.15 to 1.24) | 1.41 (1.32 to 1.52) | 1.37 (1.26 to 1.48) |
| GA 37–41 | 0.88 (0.86 to 0.89) | 0.89 (0.86 to 0.89) | 0.75 (0.73 to 0.76) | 0.76 (0.74 to 0.78) | 0.81 (0.77 to 0.85) | 0.83 (0.79 to 0.88) |
| GA ≥42 | 1.20 (1.17 to 1.22) | 1.20 (1.18 to 1.23) | 1.36 (1.33 to 1.40) | 1.35 (1.31 to 1.39) | 1.08 (1.01 to 1.15) | 1.06 (0.98 to 1.14) |
| Maternal complications and use of epidural analgesia | <17 years | 17–19 years | 20–24 years | |||
| Perineal laceration grades 1–2† | 0.44 (0.39 to 0.50) | 0.44 (0.38 to 0.50) | 0.46 (0.44 to 0.47) | 0.47 (0.45 to 0.49) | 0.65 (0.64 to 0.66) | 0.68 (0.67 to 0.69) |
| Perineal laceration grades 3–4† | 0.33 (0.22 to 0.49) | 0.39 (0.25 to 0.60) | 0.31 (0.25 to 0.37) | 0.37 (0.32 to 0.42) | 0.57 (0.54 to 0.59) | 0.61 (0.58 to 0.64) |
| Preeclampsia | 0.83 (0.61 to 1.12) | 0.89 (0.62 to 1.27) | 0.89 (0.82 to 0.97) | 0.93 (0.84 to 1.02) | 1.07 (1.03 to 1.12) | 1.01 (0.96 to 1.05) |
| Abruptio placentae | 1.72 (1.05 to 2.83) | 1.76 (1.03 to 3.00) | 1.16 (0.97 to 1.39) | 1.02 (0.83 to 1.26) | 0.89 (0.81 to 0.98) | 0.83 (0.74 to 0.92) |
| Placenta praevia | 0.50 (0.12–2.00) | 0.57 (0.14 to 2.30) | 0.32 (0.19 to 0.53) | 0.28 (0.16 to 0.50) | 0.52 (0.43 to 0.61) | 0.52 (0.43 to 0.63) |
| PPH >1000 mL (VB) | 0.70 (0.54 to 0.89) | 0.65 (0.48 to 0.88) | 0.57 (0.53 to 0.61) | 0.64 (0.59 to 0.70) | 0.71 (0.69 to 0.74) | 0.78 (0.75 to 0.81) |
| PPH >1000 mL (CS) | 0.73 (0.18 to 2.93) | 0.52 (0.07 to 3.74) | 0.87 (0.59 to 1.27) | 1.16 (0.77 to 1.93) | 0.99 (0.92 to 1.07) | 1.09 (0.93 to 1.28) |
| Epidural analgesia† | 1.03 (0.95–1.12) | 1.03 (0.93 to 1.13) | 1.07 (1.06 to 1.08) | 1.07 (1.04 to 1.10) | 1.02 (1.01 to 1.03) | 1.03 (1.01 to 1.04) |
| 30–34 years | 35–39 years | 40+ years | ||||
| Perineal laceration grades 1–2† | 1.33 (1.31 to 1.34) | 1.11 (1.10 to 1.13) | 1.37 (1–34 to 1.40) | 1.08 (1.05 to 1.10) | 1.32 (1.25 to 1.39) | 1.00 (0.94 to 1.07) |
| Perineal laceration grades 3–4† | 1.31 (1.27 to 1.36) | 1.16 (1.12 to 1.20) | 1.29 (1.23 to 1.36) | 1.12 (1.05 to 1.18) | 1.10 (0.96 to 1.26) | 0.88 (0.75 to 1.02) |
| Preeclampsia | 0.95 (0.92 to 0.99) | 1.07 (1.03 to 1.12) | 1.18 (1.12 to 1.25) | 1.30 (1.22 to 1.39) | 1.60 (1.44 to 1.79) | 1.83 (1.62 to 2.06) |
| Abruptio placentae | 1.19 (1.09 to 1.30) | 1.27 (1.16 to 1.40) | 1.59 (1.42 to 1.78) | 1.71 (1.50 to 1.94) | 2.11 (1–70 to 2.63) | 2.09 (1.62 to 2.71) |
| Placenta praevia | 1.77 (1.58 to 1.99) | 1.74 (1.53 to 2.00) | 3.55 (3.11 to 4.06) | 3.47 (2.99 to 4.03) | 5.02 (4.00 to 6.29) | 5.23 (4.08 to 6.70) |
| PPH >1000 mL (VB) | 1.41 (1.37 to 1.45) | 1.27 (1.23 to 1.31) | 1.69 (1.62 to 1.76) | 1.47 (1.40 to 1.53) | 1.86 (1.69 to 2.05) | 1.48 (1.26 to 1.52) |
| PPH >1000 mL (CS) | 1.14 (1.01 to 1.28) | 1.04 (0.91 to 1.18) | 1.06 (0.91 to 1.24) | 0.95 (0.81 to 1.12) | 1.48 (1.17 to 1.88) | 1.35 (1.05 to 1.73) |
| Epidural analgesia† | 1.08 (1.06 to 1.09) | 1.03 (1.02 to 1.05) | 1.14 (1.12 to 1.17) | 1.06 (1.04 to 1.09) | 1.10 (1.04 to 1.15) | 0.98 (0.93 to 1.03) |
Reference group: maternal age 25–29 years.
*Adjusted for maternal body mass index and smoking habits at first antenatal care visit and year of birth. CS and preeclampsia also adjusted for gestational age.
†Forceps, vacuum extraction, epidural analgesia and perineal lacerations among vaginally delivered women.
‡ CS was subdivided into elective and acute CS from 1999.
aOR, adjusted OR; CS, caesarean section; GA, gestational age at delivery; PPH, postpartum haemorrhage; VB, vaginal birth.
Table 4.
Neonatal outcome data in singleton primiparous women in the period 1992–2010 in relation to maternal age group
| Characteristics | Crude OR (95% CI) | aOR (95% CI)* | Crude OR (95% CI) | aOR (95% CI)* | Crude OR (95% CI) | aOR (95% CI)* |
|---|---|---|---|---|---|---|
| <17 years | 17–19 years | 20–24 years | ||||
| Fetal distress | 0.62 (0.31 to 1.24) | 0.52 (0.22 to 1.26) | 0.76 (0.63 to 0.91) | 0.63 (0.51 to 0.79) | 0.93 (0.86 to 1.01) | 0.79 (0.72 to 0.91) |
| Aspiration of meconium | NA | NA | 0.47 (0.32 to 0.67) | 0.46 (0.31 to 0.70) | 0.90 (0.80 to 1.03) | 0.93 (0.81 to 1.07) |
| Shoulder dystocia† | 0.45 (0.11 to 1.82) | 0.32(0.05 to 2.29) | 0.74 (0.58 to 0.90) | 0.74 (0.52 to 1.07) | 1.01 (0.88 to 1.16) | 1.00 (0.86 to 1.16) |
| Stillbirth | 0.99 (0.47 to 2.08) | 0.58 (0.19 to 1.80) | 1.15 (0.94 to 1.42) | 0.97 (0.75 to 1.25) | 1.03 (0.93 to 1.15) | 0.98 (0.87 to 1.11) |
| SGA | 1.32 (1.07 to 1.63) | 1.00 (0.78 to 1.28) | 1.31 (1.23 to 1.40) | 1.01 (0.94 to 1.09) | 1.11 (1.07 to 1.14) | 1.00 (0.96 to 1.04) |
| LGA | 1.01 (0.75 to 1.34) | 1.08 (0.76 to 1.53) | 0.92 (0.84 to 1.00) | 1.03 (0.94 to 1.14) | 1.05 (1.00 to 1.09) | 1.05 (1.00 to 1.10) |
| Apgar score <7 at 5 min | 1.31 (0.96 to 1.77) | 1.30 (0.91 to 1.86) | 0.92 (0.83 to 1.03) | 0.92 (0.81 to 1.11) | 0.93 (0.89 to 0.99) | 0.93 (0.88 to 0.98) |
| 30–34 years | 35–39 years | 40+ years | ||||
| Fetal distress | 0.96 (0.89 to 1.04) | 1.23 (1.13 to 1.35) | 1.14 (1.02 to 1.27) | 1.51 (1.33 to 1.72) | 0.98 (0.75 to 1.28) | 1.60 (1.20 to 2.13) |
| Aspiration of meconium | 1.27 (1.13 to 1.42) | 1.36 (1.20 to 1.54) | 1.42 (1.21 to 1.67) | 1.48 (1.24 to 1.77) | 1.83 (1.34 to 2.51) | 1.82 (1.28 to 2.58) |
| Shoulder dystocia† | 1.18 (1.04 to 1.35) | 1.13 (0.90 to 1.41) | 1.13 (0.91 to 1.39) | 1.13 (0.91 to 1.41) | 1.47 (0.93 to 2.33) | 1.27 (0.76 to 2.12) |
| Stillbirth | 1.26 (1.14 to 1.38) | 1.25 (1.12 to 1.39) | 1.85 (1.64 to 2.10) | 1.72 (1.49 to 1.99) | 2.77 (2.22 to 3.46) | 2.34 (1.80 to 3.03) |
| SGA | 1.20 (1.16 to 1.24) | 1.24 (1.20 to 1.28) | 1.63 (1.56 to 1.70) | 1.65 (1.58 to 1.73) | 2.04 (1.87 to 2.22) | 2.06 (1.87 to 2.26) |
| LGA | 0.94 (0.91 to 0.98) | 0.94 (0.90 to 0.98) | 1.03 (0.97 to 1.09) | 0.97 (0.91 to 1.04) | 1.07 (0.93 to 1.22) | 0.94 (0.81 to 1.09) |
| Apgar score <7 at 5 min | 1.18 (1.13 to 1.24) | 1.18 (1.12 to 1.24) | 1.47 (1.38 to 1.56) | 1.39 (1.29 to 1.49) | 1.65 (1.44 to 1.88) | 1.51 (1.30 to 1.75) |
Reference group: maternal age 25–29 years.
*Adjusted for maternal body mass index and smoking habits at first antenatal care visit and year of birth.
†Shoulder dystocia among vaginal delivered women.
aOR, adjusted OR; LGA, large-for-gestational age; NA, not applicable; SGA, small-for-gestational age.
Mode of delivery, obstetric and neonatal outcome of adolescents
Compared with the reference group the teenagers had a significantly higher likelihood of having spontaneous onset of labour and of having a normal vaginal delivery. Teenagers also demonstrated a significantly higher risk of giving birth prematurely. However, only the group of teenagers younger than 17 years of age had an increased risk of giving birth very prematurely, that is, before 28 weeks of gestational age, and the same group revealed a significantly higher risk of placental abruption. In contrast with these observations the teenagers delivered instrumentally and by CS significantly less often, and the vaginal births caused significantly fewer perineal lacerations (only evaluated among women who delivered vaginally) and PPH >1000 mL. Likewise the occurrence of placenta previa was seen less often among teenagers whereas the occurrence of preeclampsia was equal to that seen in the reference group.
Concerning the fetal and neonatal outcomes for adolescents, the newborns were less likely to show fetal distress and meconium aspiration in spite of a similar occurrence of Apgar score <7 at 5 min. The newborns of the adolescents were not more prone to being stillborn or being SGA than the newborns of women in the reference group. The adjusted mean birth weight of newborns of adolescents did not differ significantly from that of women up to 29 years of age (figure 1).
Figure 1.
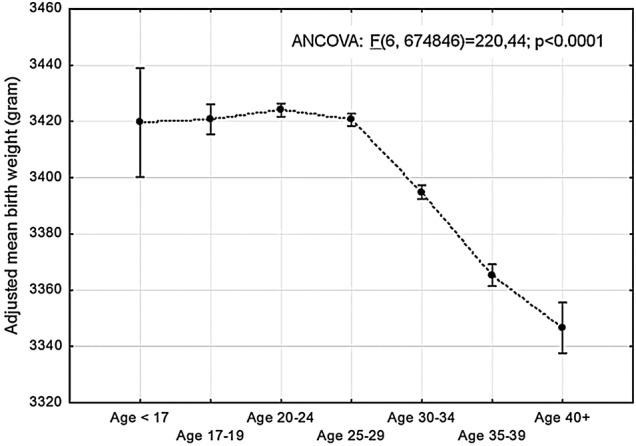
Adjusted mean birth weight of neonates in singleton primiparous women in different maternal age groups. Birth weight adjusted for gestational age, maternal body mass index and smoking habits, and year of delivery. Plots indicate means and bars 95% CI (ANCOVA, analysis of covariance).
Mode of delivery, obstetric and neonatal outcome of women aged 20–24 years
The young women, 20–24 years of age, differed in some aspects from the reference group as well as from the adolescents. They were less likely to deliver prematurely and had a lower frequency of placental abruption. Otherwise the obstetric and neonatal outcomes were similarly as favourable as those observed for the adolescents in comparison with the reference group.
Mode of delivery, obstetric and neonatal outcome of women older than 29 years of age
As shown in table 3 compared with the reference group almost all obstetric outcome variables demonstrated a continuously progressive deterioration with increasing age. The likelihood of normal vaginal births decreased; induced labour, instrumental deliveries and CS increased as well as prematurity including very premature deliveries. The risk of perineal laceration increased moderately whereas the risk of PPH >1000 mL in vaginal births was more pronounced. The likelihood of pregnancy complications such as preeclampsia, abruptio placenta and placenta previa was also higher in the older age groups and progressed substantially with increasing age. Similarly, the fetal and neonatal outcome was adversely progressively influenced by increasing maternal age. With increasing maternal age over 30 years, significantly more neonates were SGA, showed fetal distress, had Apgar score <7 at 5 min or meconium aspiration or were stillborn. The mean birth weight of the neonates also decreased significantly with increasing maternal age after the age of 30 (figure 1).
Discussion
This Swedish nation-wide population-based study with prospectively collected data concerning singleton primiparous women showed that the mode of delivery differed over the maternal age strata. Significantly more normal vaginal deliveries and fewer CS and instrumental vaginal deliveries were seen among the teenagers and among women aged 20–24 compared with the reference group of women aged 25–29. The opposite was found among older women reaching a fourfold increased risk for CS compared with women aged 20–24 years. The teenagers as well as women aged 20–24 were less prone to perineal lacerations and PPH exceeding 1000 mL. Prematurity (<28 weeks of gestational age at birth) was associated with very low maternal age (<17 years) among the adolescents although the increased risk was at the same level as among women aged 40 years and above, indicating a U-shaped risk curve. Adolescents were not afflicted more by preeclampsia than the reference women whereas the risk of preeclampsia increased significantly with advancing maternal age. The risk of placentae praevia increased dramatically with maternal age, actually a 500% increased risk was found after the age of 40 compared with the reference group. There was a significantly increased risk of stillbirth, SGA and low Apgar score only in women aged 30 years and over.
The most prominent difference between the findings in the present study and earlier studies is that no increased risk for SGA was found among the adolescents and young mothers 20–24 years of age compared with the reference women.8 9 It must be kept in mind that the definition of SGA may differ between countries. In the USA and Latin America SGA is usually defined as birth weight below the 10th centile compared with 2 SD in the Nordic countries.3 9 Adjusted risks for SGA among teenagers, recently presented from Finland, one of the Nordic countries, showed no increased risk among the youngest mothers.6 In that study the control group was defined in the same way as in the present study but the Finnish study did not adjust for smoking habits. We found that smoking in early pregnancy was a significant independent risk factor for SGA in all age groups but it was only in the young women below 25 years of age that the adjustment of smoking turned the statistically significant crude ORs into non-significant aOR values. The contrary was found for the older women where the already significant crude ORs for SGA even increased. This observation may support a biological explanation for SGA in the older women. Differences concerning the risk for SGA could also be attributable to differences in socioeconomic status. Chen et al3 restricted their analysis to white married mothers with age-appropriate education level, adequate prenatal care, and without smoking and alcohol use during pregnancy, but found the increased risk for SGA to persist. Several studies have shown low infant birth weight for adolescents as well as for mothers with advancing age.18 14 30 31 We failed to find such association among the adolescents, but in women with advancing age the difference in birth weight was statistically significant although the difference lacked clinical significance.
The finding of a preferable birth outcome with lower CS rates and lower rates of instrumental delivery among teenagers compared with older women has been pinpointed to a lesser extent than observed adverse outcomes. Earlier studies have shown relatively consistent results concerning a decreased rate of CS in the adolescent group and a higher rate in women with advancing age.6 8 9 12–18 We were able to evaluate elective and emergency CS separately and the risks among the teenagers and mothers aged 20–24 years were decreased for both types. This might indicate that the different risks concerning CS among young and older mothers could not exclusively be explained by more CS on maternal request among older mothers but may even be caused by biological factors. A low rate of instrumental deliveries and CS among adolescents and a high rate among older women have almost unanimously been shown in several reports from high-income as well as low-income countries.5 7 12–18 30–33 Whether this phenomenon depends on differences in handling the delivery, inherent or cultural behavioural, domestic or social attitudes among the obstetric staff or biological factors has not been investigated. Advancing age is associated with impaired uterine contractility as well as endothelial dysfunction which theoretically may lead to impaired uterine and uteroplacental function.34 35 The fact that adolescents in our study had a lower risk of induction of labour, perineal laceration, PPH, placental abruption (except for the very young women) and placenta previa, and women with advancing age had higher risks of all these outcomes including preeclampsia could support a biological explanation. Concerning prematurity the age-related risk curve was U shaped. This may also support a biological aetiology; immaturity of the uterus in very young women obstructs development of a term pregnancy and results in premature delivery, as does uterine dysfunction caused by ageing processes in women with advancing age. The neonatal outcomes followed almost the same pattern; fetal distress, meconium aspiration, stillbirth, SGA and low Apgar score were exclusively attributed to women older than 29 years.
The strength of this study is that it deals with the outcomes in the population of an entire country where the antenatal care programme is equally available to all pregnant women and is comprehensive. In Sweden pregnant women have completely cost-free access to antenatal and obstetric facilities; poverty and malnutrition are practically non-existent and most women attends the antenatal care programme (99%) independent of socioeconomic status and have their delivery in obstetric units.21 This context is valid for the whole study period. Another advantage is the large number of individuals available for evaluation, which makes it possible to divide the study population into subgroups with sufficient numbers in each stratum to provide high statistical power. A sufficient number of study participants made it possible to evaluate three subgroups of young maternal age. Only primiparous women were included in order to avoid the confounding effects of factors associated with subsequent deliveries. There are limitations that should be considered. The external validity is reduced to facilities with similar socioeconomic and demographic characteristics and healthcare systems with comparable standards. The drawback is obvious given the large size of the study and the numbers of healthcare units involved so the criteria for diagnosis (ICD codes) to define outcomes may not be uniform across the study population, but the variation is most likely not related to maternal age. The MBR contains a large body of information concerning the mother and child, which made it possible to adjust the results for confounding factors. At the same time this is a limitation as only the data available in the register could be used for adjustments. The register lacks information on ethnicity and socioeconomic status. Our effort was to evaluate obstetric and neonatal outcomes in different maternal age groups compared with women aged 25–29 overall. The only stratifications made were for year of birth, maternal BMI and smoking in early pregnancy. The data on year of birth showed that there is variability in the existence of obstetric and neonatal diagnoses during the observation period. This may be due to true changes but may also be a result of changes in recording, including the expanding use of computerised medical records. It was therefore necessary to adjust for year of birth. Maternal BMI, maternal smoking and gestational age (for some relevant outcomes) were included in the adjusted analyses based on their well-known association with maternal and fetal outcome.26 27 Putative confounders and intermediaries were not identified with statistical analysis. To demonstrate causality between the different outcomes evaluated in the analyses and maternal age a great number of putative intermediaries could have been considered such as the use of fertility treatment, fetal size, gestational weight gain, etc, but that was not the purpose of the study. There may be other variables (which are not intermediaries) but we have not been able to identify them. The proportion of missing data concerning the included confounders could have affected the results. The youngest age group had the highest frequency of missing data on BMI (20.7%) and smoking (7.7%) compared with the reference group (13.1% and 4.9%, respectively). The distribution of BMI in the youngest age group was almost equal to the other maternal age groups. One explanation for a higher proportion of missing data in the youngest age group could be later detection of their pregnancies and attendance to the antenatal care, and questions concerning exposure in early pregnancy were not raised. Gestational age could be calculated for more than 99% of individuals in this study with only minimal variations between maternal age groups.
Our approach of analysing the data may be a benefit for clinicians interpreting the results when dealing with young and aged mothers.
In conclusion, in a country with a highly developed social and antenatal maternity healthcare security system giving cost-free maternity and obstetric care to all pregnant women, adolescents had a decreased risk for adverse obstetric and neonatal outcome compared with the reference group. In the same social context childbirth at advanced maternal age was associated with a number of serious complications for the woman as well as the child. For clinicians counselling young mothers it is of great importance to highlight the positive consequences that less obstetric complications and favourable neonatal outcomes are expected. The results imply that there is a need for individualising the antenatal surveillance programmes and obstetric care based on age grouping in order to attempt to improve the outcomes in the age groups with less favourable obstetric and neonatal outcomes. Such changes in surveillance programmes and obstetric interventions need to be evaluated in further studies.
Supplementary Material
Footnotes
Funding: The study was supported financially by grants from the County Council of Östergötland and Linköping University.
Competing interests: None.
Ethics approval: The study was approved by the Regional Ethical Review Board in Linköping, Sweden (Dnr 2011/479-31. Approved 25 January 2012).
Provenance and peer review: Not commissioned; externally peer reviewed.
Data sharing statement: Extra data can be accessed via the Dryad data repository at http://datadryad.org/ with the doi:10.5061/dryad.nc576.
References
- 1.Olausson PM, Cnattingius S, Goldenberg RL. Determinants of poor pregnancy outcomes among teenagers in Sweden. Obstet Gynecol 1997;89:451–7. [DOI] [PubMed] [Google Scholar]
- 2.Olausson PO, Cnattingius S, Haglund B. Teenage pregnancies and risk of late fetal death and infant mortality. Br J Obstet Gynaecol 1999;106:116–21. [DOI] [PubMed] [Google Scholar]
- 3.Chen XK, Wen SW, Fleming N et al. Teenage pregnancy and adverse birth outcomes: a large population based retrospective cohort study. Int J Epidemiol 2007;36:368–73. [DOI] [PubMed] [Google Scholar]
- 4.Gupta N, Kiran U, Bhal K. Teenage pregnancies: obstetric characteristics and outcome. Eur J Obstet Gynecol Reprod Biol 2008;137:165–71. [DOI] [PubMed] [Google Scholar]
- 5.de Vienne CM, Creveuil C, Dreyfus M. Does young maternal age increase the risk of adverse obstetric, fetal and neonatal outcomes: a cohort study. Eur J Obstet Gynecol Reprod Biol 2009;147:151–6. [DOI] [PubMed] [Google Scholar]
- 6.Leppälahti S, Gissler M, Mentula M et al. Is teenage pregnancy an obstetric risk in a welfare society? A population-based study in Finland, from 2006 to 2011. BMJ Open 2013;3:e003225. [DOI] [PMC free article] [PubMed] [Google Scholar]
- 7.Lao TT, Ho LF. Obstetric outcome of teenage pregnancies. Hum Reprod 1998;13:3228–32. [DOI] [PubMed] [Google Scholar]
- 8.Malabarey OT, Balayla J, Klam SL et al. Pregnancies in young adolescent mothers: a population-based study on 37 million births. J Pediatr Adolesc Gynecol 2012;25:98–102. [DOI] [PubMed] [Google Scholar]
- 9.Conde-Agudelo A, Belizán JM, Lammers C. Maternal-perinatal morbidity and mortality associated with adolescent pregnancy in Latin America: cross-sectional study. Am J Obstet Gynecol 2005;192:342–9. [DOI] [PubMed] [Google Scholar]
- 10.Mukhopadhyay P, Chaudhuri RN, Paul B. Hospital-based perinatal outcomes and complications in teenage pregnancy in India. J Health Popul Nutr 2010;28:494–500. [DOI] [PMC free article] [PubMed] [Google Scholar]
- 11.Ayuba II, Gani O. Outcome of teenage pregnancy in the Niger delta of Nigeria. Ethiop J Health Sci 2012;22:45–50. [PMC free article] [PubMed] [Google Scholar]
- 12.Jolly M, Sebire N, Harris J et al. The risks associated with pregnancy in women aged 35 years or older. Hum Reprod 2000;15:2433–7. [DOI] [PubMed] [Google Scholar]
- 13.Jacobsson B, Ladfors L, Milsom I. Advanced maternal age and adverse perinatal outcome. Obstet Gynecol 2004;104:727–33. [DOI] [PubMed] [Google Scholar]
- 14.Cleary-Goldman J, Malone FD, Vidaver J et al. Impact of maternal age on obstetric outcome. Obstet Gynecol 2005;105:983–90. [DOI] [PubMed] [Google Scholar]
- 15.Joseph KS, Allen AC, Dodds L et al. The perinatal effects of delayed child bearing. Obstet Gynecol 2005;105:1410–18. [DOI] [PubMed] [Google Scholar]
- 16.Luke B, Brown MB. Elevated risks of pregnancy complications and adverse outcomes with increasing maternal age. Hum Reprod 2007;22:1264–72. [DOI] [PubMed] [Google Scholar]
- 17.Delbaere I, Verstraelen H, Goetgeluk S et al. Pregnancy outcome in primiparae of advanced maternal age. Eur J Obstet Gynecol Reprod Biol 2007;135:41–6. [DOI] [PubMed] [Google Scholar]
- 18.Hsieh TT, Liou JD, Hsu JJ et al. Advanced maternal age and adverse perinatal outcomes in an Asian population. Eur J Obstet Gynecol Reprod Biol 2010;148:21–6. [DOI] [PubMed] [Google Scholar]
- 19.Matsuda Y, Kawamichi Y, Hayashi K et al. Impact of maternal age on the prevalence of obstetrical complications in Japan. J Obstet Gynaecol Res 2011;37:1409–14. [DOI] [PubMed] [Google Scholar]
- 20.Biro MA, Davey MA, Carolan M et al. Advanced maternal age and obstetric morbidity for women giving birth in Victoria, Australia: a population-based study. Aust N Z J Obstet Gynaecol 2012;52:229–34. [DOI] [PubMed] [Google Scholar]
- 21.Lindmark G, Cnattingius S. The scientific basis of antenatal care routines: report from a state-of-art conference. Acta Obstet Gynecol Scand 1991;70:105–9. [DOI] [PubMed] [Google Scholar]
- 22.Källen B, Källen K, Olausson PO. The Swedish Medical Birth Register: a summary of content and quality. Research Report, Article no: 2003-112-3 Centre for Epidemiology, National Board of Health and Welfare Stockholm, 2003. http://www.socialstyrelsen.se/publikationer2003/2003-112-3 (accessed May 2014). [Google Scholar]
- 23.Cnattingius S, Ericson A, Gunnarskog J et al. A quality study of a medical birth registry. Scand J Soc Med 1990;18:143–8. [DOI] [PubMed] [Google Scholar]
- 24.Axelsson O. The Swedish medical birth register. Acta Obstet Gynecol Scand 2003;82:491. [DOI] [PubMed] [Google Scholar]
- 25.Källén B. A birth weight for gestational age standard based on data in the Swedish Medical Birth Registry, 1985–1989. Eur J Epidemiol 1995;11:601–6. [DOI] [PubMed] [Google Scholar]
- 26.Cedergren MI. Maternal morbid obesity and the risk of adverse pregnancy outcome. Obstet Gynecol 2004;103:219–24. [DOI] [PubMed] [Google Scholar]
- 27.Källén K. The impact of maternal smoking during pregnancy on delivery outcome. Eur J Public Health 2001;11:329–33. [DOI] [PubMed] [Google Scholar]
- 28.Delnord M, Blondel B, Drewniak N et al. Varying gestational age patterns in cesarean delivery: an international comparison. BMC Pregnancy Childbirth 2014;14:321. [DOI] [PMC free article] [PubMed] [Google Scholar]
- 29.Morisaki N, Togoobaatar G, Vogel JP et al. Risk factors for spontaneous and provider-initiated preterm delivery in high and low Human Development Index countries: a secondary analysis of the World Health Organization Multicountry Survey on Maternal and Newborn Health. BJOG 2014;121(Suppl 1):101–9. [DOI] [PubMed] [Google Scholar]
- 30.Shrim A, Ates S, Mallozzi A et al. Is young maternal age really a risk factor for adverse pregnancy outcome in a Canadian tertiary referral hospital? J Pediatr Adolesc Gynecol 2011;24:218–22. [DOI] [PubMed] [Google Scholar]
- 31.Jivraj S, Nazzal Z, Davies P et al. Obstetric outcome of teenage pregnancies from 2002 to 2008: the Sheffield experience. J Obstet Gynaecol 2010;30:253–6. [DOI] [PubMed] [Google Scholar]
- 32.Beyer DA, Amari F, Diedrich K et al. Teenage deliveries in Northern Germany: always a risk factor for higher surgical delivery rates? Arch Gynecol Obstet 2011;284:535–8. [DOI] [PubMed] [Google Scholar]
- 33.Jolly MC, Sebire N, Harris J et al. Obstetric risks of pregnancy in women less than 18 years old. Obstet Gynecol 2000;96:962–6. [DOI] [PubMed] [Google Scholar]
- 34.Nelson SM, Telfer EE, Anderson RA. The ageing ovary and uterus: new biological insights. Hum Reprod Update 2013;19:67–83. [DOI] [PMC free article] [PubMed] [Google Scholar]
- 35.Taddei S, Virdis A, Ghiadoni L et al. Endothelium, aging, and hypertension. Curr Hypertens Rep 2006;8:84–9. [DOI] [PubMed] [Google Scholar]
Associated Data
This section collects any data citations, data availability statements, or supplementary materials included in this article.