

Abstract
Visual categorization is an essential perceptual and cognitive process for assigning behavioral significance to incoming stimuli. Categorization depends on sensory processing of stimulus features as well as flexible cognitive processing for classifying stimuli according to the current behavioral context. Neurophysiological studies suggest that the prefrontal cortex (PFC) and the inferior temporal cortex (ITC) are involved in visual shape categorization. However, their precise roles in the perceptual and cognitive aspects of the categorization process are unclear, as the two areas have not been directly compared during changing task contexts. To address this, we examined the impact of task relevance on categorization-related activity in PFC and ITC by recording from both areas as monkeys alternated between a shape categorization and passive viewing tasks. As monkeys viewed the same stimuli in both tasks, the impact of task relevance on encoding in each area could be compared. While both areas showed task-dependent modulations of neuronal activity, the patterns of results differed markedly. PFC, but not ITC, neurons showed a modest increase in firing rates when stimuli were task relevant. PFC also showed significantly stronger category selectivity during the task compared with passive viewing, while task-dependent modulations of category selectivity in ITC were weak and occurred with a long latency. Finally, both areas showed an enhancement of stimulus selectivity during the task compared with passive viewing. Together, this suggests that the ITC and PFC show differing degrees of task-dependent flexibility and are preferentially involved in the perceptual and cognitive aspects of the categorization process, respectively.
Keywords: categorization, inferior temporal cortex, neurophysiology, object recognition, prefrontal cortex, vision
Introduction
Our ability to recognize and respond appropriately to visual stimuli depends on processing across a cortical hierarchy that transforms feature representations in “early” areas into more complex and flexible representations in downstream areas. For example, ventral stream areas, such as V2, V4, and inferior temporal cortex (ITC), transform local feature representations into more invariant encoding of complex features (Gross et al., 1972; Bruce et al., 1981; Perrett et al., 1982; Desimone et al., 1984; Logothetis and Sheinberg, 1996; Tanaka, 1996). Learning and experience can enhance visual representations in ITC (Logothetis et al., 1995; Vogels, 1999; Sheinberg and Logothetis, 2001; Sigala and Logothetis, 2002; Anderson et al., 2008; Li and DiCarlo, 2008, 2010, 2012; Woloszyn and Sheinberg, 2012), while the impact of learning in earlier areas (e.g., V2) is modest by comparison (Ghose et al., 2002). For example, discrimination or categorization training can yield sharper shape representations in ITC (Kobatake et al., 1998; Vogels, 1999; Baker et al., 2002; Sigala and Logothetis, 2002; Freedman et al., 2006; De Baene et al., 2008). In addition, ITC neurons can reflect learned stimulus associations acquired through long-term training (Miyashita, 1988; Sakai and Miyashita, 1991).
Visual categorization depends not only on the identification of stimuli or features, but also on contextual factors, such as rules, motivation, and expected outcomes—functions often ascribed to the prefrontal cortex (PFC; Miller and Cohen, 2001). Neurophysiological studies of the PFC have revealed encoding of abstract cognitive variables, such as rules and categories (Freedman et al., 2001, 2002, 2003; Wallis et al., 2001; Miller et al., 2002, 2003; Wallis and Miller, 2003; Wallis, 2007; Meyers et al., 2012), which is consistent with behavioral impairments observed in humans (Milner, 1963; Perret, 1974; Dunbar and Sussman, 1995; Vendrell et al., 1995) and animals (Rossi et al., 2007) with PFC damage. In contrast, ITC damage typically results in perceptual or mnemonic deficits (Kluver and Bucy, 1938, 1939; Blum et al., 1950; Mishkin and Pribram, 1954), rather than impaired executive functions. The influence of task relevance on PFC and ITC is unclear, as the two areas have not been directly compared during changing task contexts.
We recorded from PFC and ITC as monkeys alternated between shape categorization and passive viewing tasks, using identical stimuli in both tasks. We found that both areas exhibited task-dependent modulations of activity and selectivity, but showed different patterns of effects. First, during the categorization task, PFC showed stronger and more explicit category encoding than ITC, which is consistent with previous reports. Second, during passive viewing, PFC showed a modest (but significant) reduction in mean activity and weaker category selectivity than during the categorization task. Finally, ITC activity was less task dependent than PFC and showed modest and long-latency task-related enhancements of category selectivity.
Together, this suggests that task-related contextual factors differentially influence PFC and ITC. Encoding in PFC is more dependent on the task relevance of visual stimuli and shows strong encoding of task-relevant cognitive variables. In contrast, ITC shows more task-independent visual feature representation, while subtle task-related modulations in ITC may serve to enhance, but not dramatically alter, neuronal feature encoding.
Materials and Methods
The current study focused on a subset of the ITC and PFC populations from a previous study (Freedman et al., 2003), which examined activity during the category task (but not passive viewing). That previous study examined larger populations in both areas since not all neurons were tested with the passive viewing task. It also examined a larger set of stimuli (54 instead of 42 stimuli), since only 42 stimuli were tested during both the category and passive tasks. The difference in stimulus sets between studies, and the testing of stimuli in both task and passive conditions, necessitated slightly different criteria for assessing neuronal stimulus selectivity (i.e., examining responses across 54 vs 42 stimuli in respective studies), which was a key criterion for including or excluding neurons in population analyses. In addition, the current study includes PFC data from a monkey (monkey S) that did not participate in the 2003 study. For these reasons, it is expected that the current study will yield slightly different results of analyses that were repeated in the two studies [e.g., category-tuning index (CTI)] and have somewhat less statistical power (due to the smaller neuronal population and fewer stimuli). The detailed methods for this study were described in an earlier publication (Freedman et al., 2003) and will be will briefly discussed below.
Subjects.
Three female adult rhesus monkeys (Macacca mulatta) weighing 6.0, 6.4, and 6.6 kg were surgically implanted with a headpost and two recording chambers. All surgeries were performed under sterile conditions while the animals were anesthetized with isoflurane. Following surgery, they received postoperative antibiotics and analgesics. All procedures were in compliance with the National Institutes of Health and The Massachusetts Institute of Technology Committee on Animal Care guidelines.
Stimuli and behavioral tasks.
A large continuous set of images was generated from three cat prototypes and three dog prototypes (Fig. 1) using a previously described 3D stimulus morphing system (Shelton, 2000; Freedman et al., 2001, 2002). It found corresponding points between one of the prototypes and the others and then computed their differences as vectors. Morphs were generated by linear combinations of these vectors added to that prototype. Thousands of unique images with continuously varying shape could be generated by morphing different amounts of the prototypes. The category of a stimulus was defined by an arbitrary category boundary that divided the object space into two categories (which we refer to as “cats” and “dogs”). The category of a stimulus was defined by whichever category contributed more (>50%) to a given morph. The stimuli differed along multiple feature dimensions and were smoothly morphed, i.e., without sudden appearance or disappearance of any feature. The stimuli were 4.2° in diameter; had identical color, shading, orientation, and scale; and were presented at fixation.
Figure 1.

Task stimuli. a, Cat and dog prototypes and morph lines. Cross-boundary morph lines are shown in red. Within-category morph lines are shown in blue. While stimuli from all morph lines were shown during the task, only cross-boundary stimuli (on the red lines) were analyzed in the current study. b, Illustration of the morphs along one of the red, cross-boundary morph lines. The stimuli range from 100% cat (C1 prototype) on the left to 100% dog (D1 prototype) on the right.
Monkeys were trained to perform a delayed match-to-category (DMC) task (Fig. 2a). DMC trials were initiated when the monkey acquired gaze fixation. The monkeys viewed two sequentially presented (sample and test) stimuli (each presented for 600 ms) that were separated by a 1000 ms delay, and indicated (by releasing a lever) whether the test stimulus was from the same category as the sample stimulus. If the category of the test stimulus did not match the sample, a second test stimulus was presented that always matched the sample category (and required a response from the subject). This task design dissociated the monkey's responses (release or hold) from the categories, as the lever release indicated match or nonmatch, and was therefore not uniquely associated with either of the two categories. There were an equal proportion of match and nonmatch trials as well as sample-category 1 and sample-category 2 trials, which were presented in a pseudorandom order. During both the category and passive viewing tasks, monkeys were required to maintain gaze fixation within ±2.0° of a 0.3° square fixation point at the center of the CRT for the duration of the trial. Eye movements were typically considerably smaller in amplitude than the range of the allowed window (Freedman et al., 2006). DMC and passive viewing trials were followed by a 1500–2500 ms intertrial interval, during which fixation was not required. Eye movements were monitored and stored using an infrared eye tracking system (Iscan) at a sampling rate of 120 Hz.
Figure 2.

Task outline. a, Example DMC trial. The monkey is required to fixate for 500 ms, followed by the presentation of a sample (cat or dog) stimulus for 600 ms. There is then a 1000 ms delay followed by the presentation of a test stimulus. If the test stimulus is a category match to the sample stimulus (i.e., cat–cat or dog–dog), the monkey must release a lever. If it is a category nonmatch, the monkey must continue to hold the lever until a match is presented. b, Example passive viewing trial. The monkey must fixate for 500 ms before a sample stimulus is presented. The stimulus is displayed for 600 ms while the monkey maintains fixation, followed by a juice reward upon completion of the trial.
We examined responses to 42 sample stimuli in both tasks for most recording sessions, each belonging to one of six levels of cat/dog blends (cat/dog: 100:0%, 80:20%, 60:40%, 40:60%, 20:80%, 0:100%) along the nine morph lines that crossed the category boundary. In monkey S, only 18 stimuli were used, along the three morph lines (C1–D1, C2–D2, and C3–D3) that crossed the category boundary. Before recordings, monkeys were trained with thousands of randomly generated cat and dog stimuli that covered a wide area of the possible morph space using all combinations of the six prototypes. Thus, monkeys were not trained to simply memorize the 42 sample stimuli used during neuronal recordings. To prevent monkeys from memorizing specific stimulus–response contingencies during the recording experiments, the test stimuli were 100 randomly generated morphs from each category that were randomly paired with sample stimuli of the appropriate category. The set of test stimuli was frequently regenerated to further discourage monkeys from learning associations between specific sample and test images. The test stimuli unambiguously belonged to a given category, as they were always chosen to be a minimum distance in morph space of 20% from the category boundary.
For the neural recordings in the present experiment, monkeys alternated between the category task and “passive viewing” of the sample stimuli (Fig. 2). During passive viewing, they were rewarded for maintaining fixation for the duration of the trial and were not required to make any behavioral responses. Sample stimuli in the two tasks were presented for the same duration (600 ms), and the sample stimuli shown in the category task were also shown during passive viewing. As in the DMC task, monkeys initiated each passive viewing trial by acquiring fixation of the fixation target. After a 500 ms fixation period, a stimulus was presented at the center of gaze for 600 ms. If monkeys successfully maintained fixation for the duration of sample presentation, they received drops of apple juice 100 ms after stimulus offset. The sequence of stimuli was determined pseudorandomly. Monkeys typically performed >10 correct repetitions for each unique sample stimulus in each of the two tasks. The category and passive viewing tasks were run in alternating blocks of trials (the category task was always run as the first block), and monkeys typically completed >2 blocks of each task per session. Monkeys were not shown an explicit cue that signaled block transitions, but instead inferred the block changes based on the differences in stimuli and task events in the category and passive viewing tasks. Block lengths varied slightly between monkeys due to differences in behavioral performance and differences in the stimulus sets (e.g., fewer cat/dog stimuli for monkey S) between monkeys (block lengths: monkeys L and F: DMC task, ∼100–130 trials; passive viewing, ∼190–210 trials; monkey S: DMC task: 35–55 trials; passive viewing, ∼105–145 trials).
While the analyses in the current study focus on the 42 morphs (for monkeys L and F) or 18 morphs (for monkey S) presented during both the category task and passive viewing, the animals were shown other stimuli during these recording sessions. For monkeys L and F, the DMC task was performed with an additional 12 morphs on morph lines not crossing the boundary (Fig. 1a, blue lines), but since these were not presented during passive viewing, they were excluded from analysis in the present study. During passive viewing, the animals were presented with randomly interleaved colorful images of novel and familiar objects and faces in addition to the morphs. Neuronal responses to these other stimuli have been described previously (Freedman et al., 2006).
Recording methods.
PFC recording chambers (20 mm inner diameter; Crist Instruments) were placed stereotaxically over the principal sulcus and anterior to the arcuate sulcus using structural magnetic resonance imaging (MRI) scans acquired before surgery, ∼22.0 mm anterior to the intra-aural line. PFC recordings primarily targeted areas ventral to the principal sulcus (areas 45, 46, and 12; Fig. 3b). ITC recordings were conducted between 14 and 20 mm anteroposterior and between 15 and 21 mm lateral (Fig. 3a). ITC recording locations, as determined by stereotaxic coordinates, MRI scans, and white–gray matter transitions encountered during electrode penetrations, were in areas TEa, TEm, TE2, and TE1 (Paxinos et al., 2000). The locations of ITC recordings were similar to those reported in studies by several laboratories (Logothetis et al., 1995; Booth and Rolls, 1998; Kobatake et al., 1998; Baker et al., 2002). No attempt was made to prescreen neurons for stimulus selectivity. Instead, while advancing electrodes into the ITC, we presented the monkey with randomly chosen pictures and photographs (from the Corel image library), and focused our recordings on sites that were visually responsive to these images. Neuronal waveforms were amplified, digitized, and stored for off-line sorting into individual neuron records using principal components analysis clustering software (Plexon).
Figure 3.
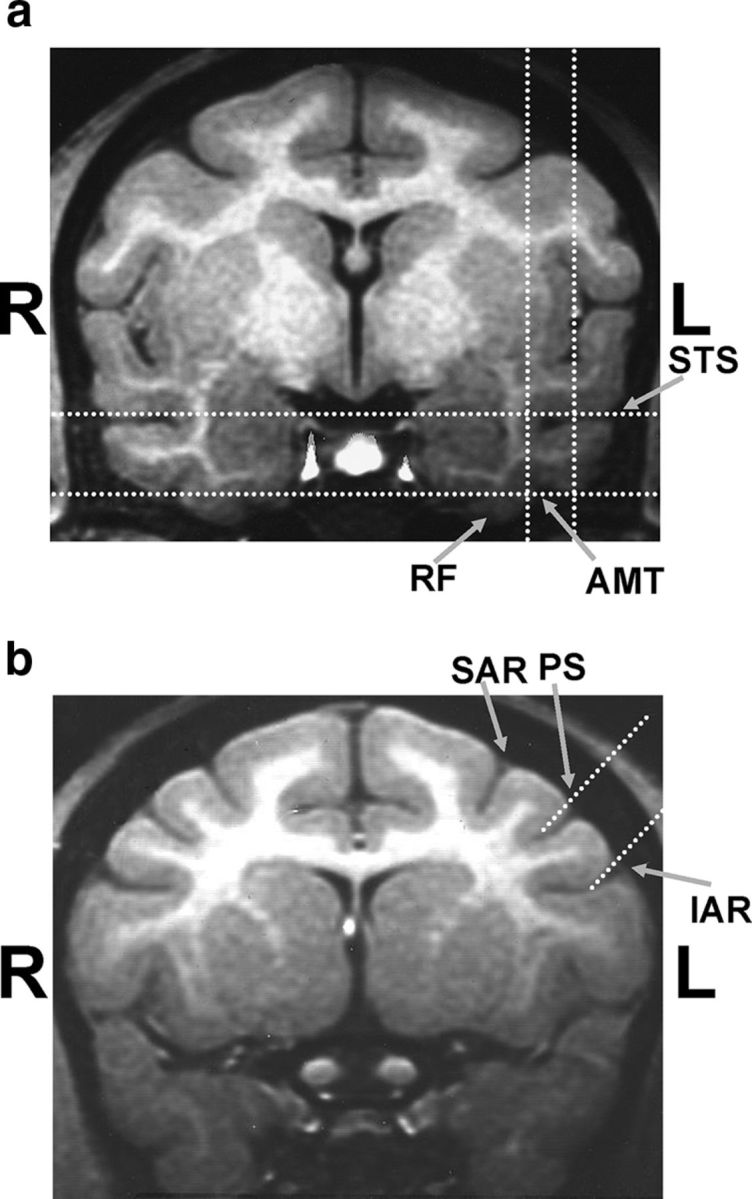
MRIs showing ITC and PFC recording locations. a, ITC chambers were centered ∼18.0 mm anterior to the intra-aural line and recordings were conducted between 14 and 20 mm anteroposterior and between 15 and 21 mm lateral. Recordings were concentrated in the lower bank of the superior temporal sulcus (STS; areas TEa, TEm) and the ventral surface of the inferior temporal cortex (area TE) lateral to the anterior medial temporal sulcus (AMT) and rhinal fissure (RF). b, PFC chambers were centered on the principal sulcus (PS) and anterior to the superior and inferior arcuate sulcus (SAR and IAR), ∼22.0 mm anterior to the intra-aural line. Recordings were obtained primarily from the areas ventral to the principal sulcus (areas 45, 46, and 12). Dotted white lines depict the approximate boundaries of the cortical areas targeted for recordings.
Data analysis.
The patterns of behavioral and neuronal results were similar across monkeys. Thus we have combined the datasets for all population analyses. Neuronal activity was examined during sample stimulus presentation using a 600 ms window that began 80 ms after stimulus onset (to account for visual latencies). For comparisons to presample baseline activity, a 500 ms window before sample onset was used. For some analyses, the sample period was divided into early (80–380 ms) and late (380–680 ms) windows following sample onset. We also performed a sliding window analysis of category selectivity [linear discriminate analysis (LDA)-based classifier; see below] with 200 ms time bins stepped at 10 ms intervals. In all cases, only neuronal activity on correct trials is included. Similar results were obtained with a variety of time-window widths and starting points for analyses using both fixed and sliding windows.
For all population analyses, we included only neurons that were stimulus selective, i.e., they modulated their firing rate to ≥1 of the presented stimuli (one-way ANOVA with all sample stimuli as the factor, p < 0.01) except where otherwise specified. To determine the time course of neuronal activity, we computed response histograms (peristimulus time histograms) across stimulus-selective PFC and ITC neurons (Fig. 4). The average spike rates were smoothed using a moving average (50 ms window width).
Figure 4.

Population peristimulus time histogram during category task and passive viewing. a, b, Average activity of all stimulus selective ITC (a) and PFC (b) neurons during the category task (solid trace) and passive viewing (dashed trace). Time is from the onset of the sample stimulus. The dotted vertical lines correspond to the time of sample onset (left) and offset (right). Insets show the mean sample-period activity during the two tasks. Error bars represent SEM. *p < 0.001 (2-way ANOVA, simple main effect of task).
The strength and time course of category selectivity was evaluated and compared with a category tuning index (CTI) as used in previous studies (Freedman et al., 2001, 2002, 2006). The CTI measured the difference in average firing rate for each neuron between pairs of stimuli in different categories [a between-category difference (BCD)] and the difference in activity between pairs of stimuli in the same category [a within-category difference (WCD)]. The CTI was defined as the difference between BCD and WCD divided by their sum. Values of the index could vary from +1.0 (i.e., strong binary-like differences in activity to directions in the two categories) to −1.0 (strong binary-like category selectivity along an axis perpendicular to the actual category boundary). A CTI value of 0.0 indicates the same difference in firing rate between and within categories. Population differences in CTI values were assessed for significance by two-way mixed ANOVAs, with the within-subjects factor “task versus passive” and the between-subject factor “area.” We also performed Bonferroni-corrected simple main effects analyses to assess the task versus passive differences separately in each area. These analyses were completed using SPSS statistical software (IBM).
We also assessed category selectivity across neuronal populations using an LDA-based classifier. Neuronal pseudopopulations were constructed from neurons that were not necessarily recorded simultaneously (i.e., neurons recorded during different sessions were combined). By training and testing the classifier on trials in which different stimuli were presented, rather than different trials in which the same stimuli were presented, we were able to examine category selectivity independently of stimulus selectivity (Meyers et al., 2008). For example, a given classifier could be trained on images from the morph lines C2 → D2, C2 → D3, C3 → D3, and C3 → D2 and tested on images from the morph line C1 → D1. There was no overlap of prototypes between the training and testing groups, i.e., if the classifier was tested on the morph line C2 → D2, it was not trained using other morph lines involving either C2 or D2. This allowed the classifier to be trained and tested on several images from each category without any overlap of prototype-specific features. For the results reported here, the data from all monkeys were subsampled such that we only used trials where one of the 18 stimuli used in monkey S was presented. This way we could pool the PFC data from the two monkeys when running the classifier. However, running the classifier separately on the data from monkeys J and F using all 42 stimuli yielded similar results. Each time the classifier was run, 68 neurons were chosen at random from either PFC or ITC. We selected 68 neurons to maximize the amount of data included in analysis while still using the same number of neurons in each area. Qualitatively similar results were obtained using populations of different sizes. For each neuron, 40 presentations of stimuli in each category were selected and the images were split into training and testing sets as described above. This procedure was then repeated 1000 times to obtain a distribution of classification accuracies. Stimulus selectivity was assessed using a similar classifier-based analysis. However, we included only those neurons that had ≥5 repetitions of every image (N = 178; 44 PFC, 134 ITC). We used the same pseudopopulations of neurons to classify which individual image was presented on a given trial, training and testing on different repetitions of the same images (five repetitions, fivefold partition). In all cases, significance was determined by comparing the bootstrapped distributions of classification accuracy in each area/condition. Classification accuracies were deemed statistically significant if 95% confidence intervals were nonoverlapping (see Figs. 9, 10) or if the confidence intervals did not include zero (see Fig. 8).
Figure 9.

Time course of category classification during category task and passive viewing. a, b, Plots show a sliding window analysis of category classification accuracy in ITC (a) and PFC (b) during the category task (solid lines) and passive viewing (dashed lines). Horizontal dashed lines on all plots represent chance performance of the classifier. The dotted vertical lines correspond to the time of sample onset (left) and offset (right). Dots along the top of a and b indicate time points where the two traces are significantly different (bootstrap, p < 0.05). Time points along the horizontal axis correspond to the center of the analysis window. c, d, Bar plots show mean classification accuracies in early and late sample epochs for ITC (c) and PFC (d) during the category task (black bars) and passive viewing (gray bars). *p < 0.05 for a task versus passive bootstrap test (2-tailed).
Figure 10.

Classification of stimulus identity during category task and passive viewing. a, b, Bar plots show average performance of the stimulus identity decoder in two time windows for the category task (black bars) and passive viewing (gray bars) in ITC (a) and PFC (b). Horizontal dashed lines represent chance performance of the classifier.
Figure 8.

Population classification of stimulus category during category task and passive viewing. a–d, Histograms of the distributions of classification accuracies across 1000 iterations of the classifier for passive viewing and the category task in ITC (a and c, respectively) and PFC (b and d, respectively). The distribution of classification accuracies during the category task is significantly greater than during passive viewing only in PFC (bootstrap, p < 0.05). The vertical dotted line at 0.5 indicates the chance (0.5) level.
Results
Behavioral task and performance
Three monkeys were trained to perform the DMC task and to alternate in blocks between this category task and a passive viewing task (Fig. 2; see Materials and Methods). During the category task, a sample stimulus was followed by a 1 s delay and a test stimulus. Monkeys had to indicate (by manually releasing a touch bar) whether the test stimulus was of the same category as the previously presented sample. If the first test stimulus was from the opposite category as the sample, the monkey had to withhold a response until, following a second brief delay, a second test stimulus (which was always a category match to the sample) was presented. All three monkeys performed the category task with a high level of accuracy, with a mean performance of 91.2% across all three animals (excluding fixation breaks). See Table 1 for performance of each monkey for stimuli at varying distances from the category boundary. During the passive viewing task, monkeys were simply required to fixate while a sample stimulus was presented foveally for 600 ms—the same duration as sample presentation during the category task.
Table 1.
Performance (percentage correct) on the DMC task separated by monkey and distance from the category boundary
| Monkey | Percentage cat/dog |
||
|---|---|---|---|
| 100 | 80:20 | 60:40 | |
| F | 96.1 | 96.4 | 88.9 |
| L | 93.0 | 92.5 | 92.6 |
| S | 87.5 | 87.3 | 75.8 |
Task-related modulations in PFC and ITC
A subset of the data presented from the category task (but not passive viewing) was previously analyzed and published in an earlier report (Freedman et al., 2003).
Two hundred eighteen PFC neurons were recorded from two monkeys during both the category and passive viewing tasks (monkey L: N = 136; monkey S: N = 82), as well as 298 ITC neurons from two monkeys (monkey L: N = 157; monkey F: N = 141). A subset of the data collected from monkey L was collected simultaneously from PFC (N = 136) and ITC (N = 117) during 22 sessions. Similar results were observed in the each of the datasets recorded from the same brain area, so data from both animals were combined for population-level analyses in each area. Except where specified otherwise, we focused our analysis on a population of 68 PFC and 182 ITC neurons that were stimulus selective during the category and/or passive viewing tasks (one-way ANOVA, p < 0.01; see Materials and Methods).
We first examined whether neuronal activity in PFC and ITC was modulated according to whether stimuli were presented during the category or passive viewing tasks. A subset of neurons in both areas showed significant differences in average sample-period activity (across all 42 stimuli in monkeys L and F, or 18 stimuli in monkey S) between the two tasks according to a paired t test (p < 0.01). This was observed in 41 of 68 PFC neurons and 106 of 182 ITC neurons. Among this population, a significantly greater fraction of PFC (N = 30 of 41) than ITC (N = 49 of 106) neurons showed greater activity during the category task compared with passive viewing (χ2 test, p = 0.0053).
The time courses of average population activity (across all stimuli) in PFC and ITC are shown in Figure 4. The impact of task on sample-period activity was assessed by a two-way mixed ANOVA on sample-period firing rates (see Materials and Methods) with an analysis of simple main effects of task in each brain area. This revealed a main effect of task (p < 0.001) as well as an interaction between task and brain area (p = 0.001). During the baseline period, there was a significant interaction between task and brain area (p < 0.001) but not a significant main effect of task (p = 0.057). PFC showed a modest but significant increase in activity during the category compared with passive task during both the sample and baseline periods (simple main effect of task: baseline, p < 0.001; sample, p < 0.001). ITC population activity was more similar between the category and passive tasks, showing stronger activity during passive viewing in the baseline period (p = 0.021). Average ITC activity was statistically indistinguishable between the two tasks during stimulus presentation (p = 0.725). Similar results (statistically significant only in PFC) were obtained by excluding neurons that showed significant differences in baseline activity between the category and passive tasks. Together, these results show that while task-related modulations in firing rate were small on average in both areas during stimulus presentation, PFC showed significantly greater activity during the task compared with passive viewing, while significant sample period task-modulations were not observed in ITC.
Category selectivity in PFC and ITC
As reported in our previous studies of visual categorization in PFC and ITC, many neurons in both areas responded differentially to images in the stimulus set (Freedman et al., 2003). This included neurons that appeared to be category tuned as well as stimulus selectivity that did not clearly reflect the task-relevant categories. Four examples of individual PFC and ITC neurons' responses during the category task are shown in Figure 5 (left column). All four neurons were “category selective,” as they responded preferentially to stimuli in one category compared with the other. In agreement with previous reports, PFC neurons typically showed sharper category selectivity than ITC neurons during the category task, a trend quantified below at the population level. Responses of some PFC neurons appeared almost binary, in that activity was similar among stimuli within each category and differed sharply between categories. In contrast, ITC neurons tended to show greater variability in activity among stimuli belonging to the same category.
Figure 5.
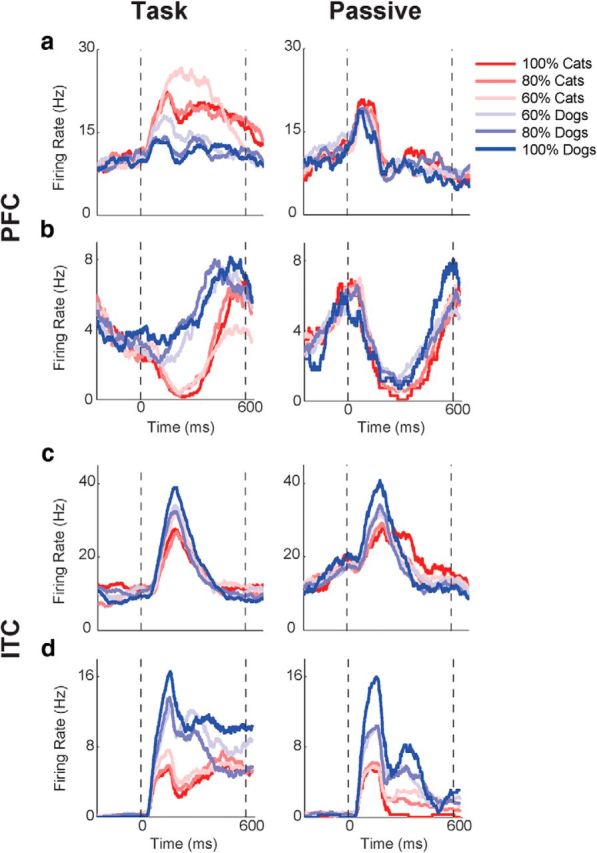
Individual neuron examples. Mean firing rates of single neurons to morphs that are different distances from the category boundary. Colors represent cats (red) or dogs (blue), with the shade corresponding to the relative contribution of that prototype (e.g., red is 100% cat; pink is 60% cat). a–d, The responses of two PFC neurons (a, b) and two ITC neurons (c, d) are shown during both the category task (left) and passive viewing (right). Time is from sample onset. The dotted vertical lines correspond to the time of sample onset (left) and offset (right).
The right column of Figure 5 shows activity for the same four PFC and ITC neurons during the passive viewing task. During the category task (left column), both PFC neurons showed strong category selectivity during stimulus presentation [top neuron (a): CTI, 0.39; bottom neuron (b): CTI, 0.44]. During passive viewing (right column), these neurons showed weaker responses and/or much weaker (or absent) category selectivity (CTI values of −0.086 and −0.16, respectively). In contrast, responses and category selectivity for the two ITC neurons were not markedly different between the two tasks (top neuron (c): task CTI, 0.10; passive CTI, 0.055; bottom neuron (d): task CTI, 0.0072; passive CTI, 0.0045). Instead, both ITC neurons showed more subtle (compared with PFC neurons) differences in the strength and/or time course of selectivity between tasks, with a trend for elevated activity or selectivity during the category task. As confirmed by population level analyses (below), neuronal responses in PFC appear to be more strongly modulated by changes in task context than those in ITC, which show a more stable pattern of selectivity across tasks.
Task-dependent modulations of category selectivity
The DMC task, but not passive viewing task, requires animals to use information about the category of sample stimuli to guide their actions. Therefore, we hypothesized that neuronal category selectivity would be enhanced during the DMC task. We quantified the strength of category selectivity for each neuron using a CTI, which compared the difference in neuronal activity among stimuli in the same versus different categories (Freedman et al., 2001, 2002, 2003; Fig. 6). Values of the CTI could range from 1.0 to −1.0. Positive values indicate larger differences in activity between categories and smaller differences within category, while negative values indicate the opposite. A CTI value of 0.0 indicates similar selectivity strength between and within categories.
Figure 6.
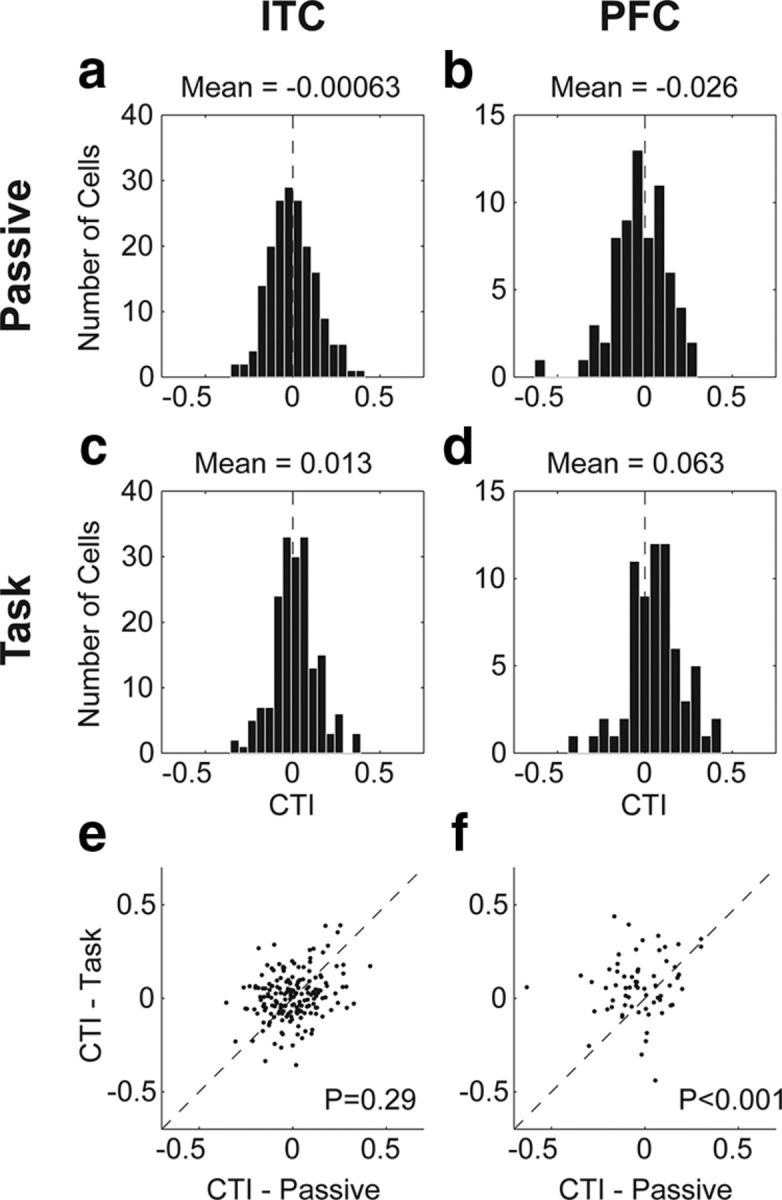
CTI values during category task and passive viewing. a–d, Histograms of the distributions of CTI values during passive viewing and the category task for ITC (a and c, respectively) and PFC (b and d, respectively). e, f, Scatter plots of CTI values during the category task versus passive viewing for each neuron are shown for ITC (e) and PFC (f). p values are from a task versus passive paired t test.
Consistent with previous studies of visual categorization, sample-period CTI values in PFC showed a significant shift toward positive values during the category task (mean, 0.063; t test, p = 0.002; Fig. 6d), indicating significant category selectivity. However, this was not the case during passive viewing (mean, −0.026; t test, p = 0.169; Fig. 6b). In ITC, CTI values showed a nonsignificant trend toward positive values during the category task (mean, 0.013; t test, p = 0.172; Fig. 6c), and had a mean near zero during passive viewing (mean, −0.001; t test, p = 0.948; Fig. 6a). We compared the impact of task demands on CTI values between brain areas with a two-way mixed ANOVA (see Materials and Methods). This revealed a main effect of task on CTI values (p < 0.001), in addition to a significant interaction between task and brain area (p = 0.002; Fig. 6e,f). A simple main effects analysis revealed a significant simple main effect of task in PFC (p < 0.001) but not ITC (p = 0.29).
To assess the time course of task-dependent modulations of category selectivity, we divided the sample period into two time windows (early and late; see Materials and Methods) and recalculated the CTI during these shorter (300 ms duration) epochs (Fig. 7). A two-way mixed ANOVA during the late window revealed a small but significant increase in category selectivity in ITC during the category task that was not evident when analyzing the entire sample period (mean, 0.0298; main effect of task, p < 0.001; interaction of task and area, p = 0.20; simple main effect of task in ITC, p = 0.017). ITC did not show a significant change in category selectivity between tasks during the early window (mean, 0.0067; main effect of task, p = 0.13; interaction of task and area, p = 0.42; simple main effect of task in ITC, p = 0.49). PFC neurons showed significantly elevated CTI values in the late sample window during the category task (mean, 0.0780; simple main effect of task in PFC, p = 0.003) and a modest nonsignificant increase during the early window (mean, 0.0198; simple main effect of task in PFC, p = 0.17).
Figure 7.

CTIs during early and late sample epochs. a, b, The sample period was divided into two time epochs and the CTI values were recalculated for ITC (a) and PFC (b) neurons during the category task (black bars) and passive viewing (gray bars). Error bars are SEM. *p < 0.05 for a task versus passive paired t test.
Population decoding of category membership
The CTI provides a measure of the impact of the category boundary on neuronal selectivity, with large positive CTI values corresponding to sharply different neuronal activity to visually similar stimuli on opposite sides of the category boundary. However, the CTI is not sensitive to some other patterns of selectivity that could be useful for categorization. For example, a neuron showing monotonically increasing activity across the 100% cat to 100% dog morph lines would have a near zero CTI value (since the difference in activity is the same between adjacent stimuli in the same and opposite categories), but that neuron's activity could be reliably read out to decode category membership. Thus, we wanted to provide a more general assessment of category-related selectivity in PFC and ITC. In addition, because the CTI measured category selectivity at the single neuron level, we also wanted to assess how much category information is available across the neuronal population in each area.
We used a linear classifier to read out the category of the sample stimulus based on the average firing rates from neuronal pseudopopulations. We constructed pseudopopulations by aligning the conditions of nonsimultaneously recorded neurons as if they had been recorded during the same session. To assess category selectivity independently of stimulus selectivity, we trained and tested the classifier on different subsets of images from each category (Meyers et al., 2008). If it was instead trained and tested on the same stimuli, then high classification accuracies could result from a combination of category and/or stimulus selectivity. To avoid this potential confound, the classifier was trained on a subset of the stimuli from each category and tested on a different, nonoverlapping subset. This way, when probed with an image, the classifier must determine whether it is a cat or a dog based on the responses of the neurons to other (visually dissimilar) cat and dog stimuli, allowing for a dissociation of neuronal category selectivity and stimulus/feature tuning (see Materials and Methods).
Figure 8 shows histograms of the sample-period classification accuracies obtained from 1000 iterations of the classifier using a randomly selected subset of neurons and trials on each iteration (see Materials and Methods). In ITC and PFC during both passive viewing and the category task, the distributions of classification accuracies are significantly shifted above 0.5 (Fig. 8a–d), indicating a greater than chance probability of reading out the correct category from neuronal firing rates. However, when comparing the distributions obtained during the category task and passive viewing with a bootstrap analysis, the classification accuracies during the category task are significantly greater than during passive viewing only in PFC (p < 0.05). This suggests that category information in PFC, but not ITC, is significantly enhanced when it is task relevant, confirming what we observed with the CTI analysis during the sample period.
Next we examined the time course of category selectivity in the category and passive tasks using a sliding window (window size, 200 ms; step size, 10 ms) classification analysis (Fig. 9a,b). This revealed that, in both tasks, ITC and PFC each showed an increase of classification accuracy above chance (0.5) shortly following stimulus onset. However, task modulations of classification accuracy were evident with different time courses in the two areas. ITC showed significantly elevated (two-tailed bootstrap, p < 0.05; see Materials and Methods) category selectivity during the category task in a brief period toward the end of stimulus presentation. In contrast, PFC showed an enhancement of category selectivity at multiple time points, including the early, middle, and late stimulus presentation period. Figure 9c,d shows classification performance in the early and late sample epochs used for the CTI analysis. In ITC we observed a significant increase in classification accuracy only for the category task compared with passive viewing during the late window (Fig. 9c; bootstrap, p < 0.05). In PFC we observed greater task classification in the late sample (Fig. 9d; bootstrap, p < 0.05), while during the early sample the difference was significant (at p < 0.05) only by a one-tailed, but not two-tailed, bootstrap test. Together, this shows that there is a shorter latency difference in task versus passive classification accuracies in PFC than ITC. Thus we are able to read-out category information from the activity of PFC neurons with greater accuracy during the DMC task when that category information is task relevant. However, ITC neurons only provide more category information during the DMC task in the late sample period.
Population decoding of stimulus identity
In addition to decoding the category of the sample stimulus, we examined how well the identity of an individual stimulus was encoded across the population of ITC and PFC neurons, and characterized the impact of task relevance on stimulus selectivity. To do this, we employed the same LDA-based classifier approach used above to decode which of the 18 stimuli was presented on a given trial (see Materials and Methods). We divided the sample period into the same two time windows used previously and discovered that there were higher classification accuracies during the category task in both time windows in both ITC (Fig. 10a) and PFC (Fig. 10b). While mean accuracies were consistently greater during the task than passive viewing in both epochs and brain areas, the 95% confidence intervals of the task–passive difference distributions overlapped in the two areas, and thus were not significant by our bootstrap analysis.
Discussion
The goal of this study was to determine the effects of task demands on the encoding of category information in ITC and PFC. We trained monkeys to categorize a parametric stimulus set into two arbitrary categories. We recorded from neurons in both areas while monkeys alternated between the categorization task and passively viewing the same sets of stimuli. In this way, we could compare the neural representations of the same stimuli under conditions when they were (category task) and were not (passive viewing) task relevant. This revealed that task demands affected neuronal encoding, with PFC demonstrating larger and shorter latency task-related modulations of category selectivity than ITC.
When comparing neuronal activity in the two tasks, we observed modestly higher activity in PFC during both the fixation and sample periods during the category task than during passive viewing. This task-related increase in activity was not observed in the ITC population. Modulations of category selectivity were assessed by two different methods, the CTI and a population-level linear classifier. These metrics revealed mostly similar effects, with PFC, but not ITC, having greater sample-period category selectivity during the task compared with passive viewing. Task-dependent enhancements of category selectivity were observed in the late, but not early, sample period in ITC. One notable difference between the CTI classifier results is that CTI values during the sample epoch were not significantly different from zero (indicating no explicit representation of the category boundary), while the classifier revealed category decoding performance that was well above chance levels (and similar to that in PFC). This is consistent with a previous report in ITC (Meyers et al., 2008) and suggests that category-related information is indeed present in ITC. However, unlike PFC, category-related selectivity in ITC does not explicitly represent the category boundary. This suggests that rather than an abstract encoding of category membership, ITC more likely shows an enhanced and more graded representation of task-relevant stimuli or features (Sigala and Logothetis, 2002; Freedman et al., 2006; Meyers et al., 2008), which is consistent with theoretical model predictions (Riesenhuber and Poggio, 1999).
Our results suggest that PFC encodes more category information when that information is task relevant. ITC neurons showed more similar category selectivity between tasks, except during the late sample period (when ITC showed enhanced category selectivity during categorization). This late increase in selectivity could be due to feedback from other areas known to be involved in categorization, such as PFC (Freedman et al., 2001, 2002, 2003; Miller et al., 2002) or parietal cortex (Freedman and Assad, 2006; Fitzgerald et al., 2011; Goodwin et al., 2012) and occurs without the increase in firing rates that is observed in PFC. The observation of significant modulations of PFC encoding with changing task demands fits with the idea that PFC is more involved in transforming sensory information into task-relevant cognitive variables. This is complementary with previous work that showed stronger category signals in PFC than ITC during the category task (Freedman et al., 2003), or found modest changes in shape tuning (but not explicit category representations) in ITC as a result of categorization training (Sigala and Logothetis, 2002; Freedman et al., 2006; De Baene et al., 2008).
Relatively few studies have directly addressed the effects of task relevance in ITC, or compared task-related modulations in PFC and ITC. One study reported that ITC responses to the same stimuli in two different tasks were unchanged (Suzuki et al., 2006), and concluded that behavioral context only affects neuronal signaling downstream of ITC (i.e., PFC). Another ITC study (Vogels et al., 2009) observed a lack of task-related modulation, except that study noted that delay activity in some neurons was reduced during passive fixation. Our results are consistent with these, in that we did not observe a large difference in overall firing rate between the two tasks. However, we did observe a trend for a short-latency increase in stimulus selectivity and a long-latency increase in category selectivity when stimuli were task relevant. The observation of significant task-related modulations of ITC stimulus selectivity is relevant for interpreting studies of stimulus selectivity in ITC and other high-level visual areas, many of which examined activity only during passive viewing (Bruce et al., 1981; Desimone et al., 1984; Kobatake et al., 1998; Baker et al., 2002; Brincat and Connor, 2004; Hung et al., 2005; Freedman et al., 2006; Op de Beeck et al., 2006; Tsao et al., 2006; Kiani et al., 2007; Woloszyn and Sheinberg, 2012). A recent study reported enhanced selectivity in ITC during a categorization task compared with passive viewing (Emadi and Esteky, 2014). Our results are compatible in that we also observed a modest enhancement of stimulus and category selectivity in ITC for task-relevant stimuli. However, our finding that CTI values were not significantly elevated in ITC suggests that category selectivity in ITC is more related to encoding task-relevant stimulus features rather than more abstract or rule-based category information (which is more explicitly encoded in PFC).
Our results are likewise consistent with human fMRI studies of task-specific modulations in PFC and ITC. Jiang et al. (2007) trained subjects on a categorization task involving morphed shapes, similar to our monkey task. In that study, after learning the categorization task, the lateral occipital complex (LOC), the human analog to monkey ITC, showed increased shape selectivity compared with pretraining, but no explicit category selectivity, whereas an area in lateral PFC showed explicit category selectivity. Interestingly, category-selective PFC activity was suppressed when subjects executed another task on the stimuli (judgments of displacements on the screen) for which stimulus categories were irrelevant. In contrast, selectivity in LOC was the same for both tasks. Another fMRI study (Ranganath et al., 2004) found that fusiform face area activity to faces was greater when faces were task relevant than when scenes were relevant, and that parahippocampal place area activity to scenes was greater when scenes were task relevant compared with when faces were relevant. In PFC, they found that activity was modulated by the amount of information subjects needed to retain, regardless of content (faces or scenes).
While we did not observe increases in ITC population activity to stimuli when they were relevant (though there were individual ITC neurons that showed significant activity increases or decreases), we did observe increased category selectivity (with a long latency following stimulus presentation) and a trend for increased stimulus selectivity when stimuli were task relevant. Our observation that PFC had both increased activity and selectivity during the category task could reflect both an increase in cognitive load (e.g., task difficulty and working memory demands) and task-relevant content. The effects of task demands have also been probed for visual word recognition using a combination of EEG/MEG and fMRI (Chen et al., 2013). This study found task-specific effects as early as 150 ms following stimulus onset. One recent fMRI study directly assessed the effects of task context on object representations across cortex (Harel et al., 2014). They found a decrease in object decoding across tasks compared with within tasks in ventral temporal cortex and lateral PFC, suggesting that representations of objects are task dependent. This is consistent with our finding of reduced object identity decoding during passive viewing in ITC and PFC.
Since our passive viewing task only required fixation, we could not definitively rule out the possibility that monkeys were still covertly categorizing the stimuli even though it was not required. This explanation is less likely considering we did observe significant modulations of neuronal activity and category selectivity. One study of task effects on color-selective ITC neurons examined the differences in activity when monkeys performed categorization, discrimination, and fixation tasks (Koida and Komatsu, 2007). The most striking differences were observed when comparing activity during categorization and discrimination tasks, with activity during the fixation task falling somewhere in between, but usually more similar to the categorization task. Thus, we may have observed stronger modulations of neuronal activity with task demands if we had required the monkeys to perform a discrimination task rather than passive viewing, or if monkeys were required to actively ignore stimuli.
Our results show that task-related modulation of selectivity appears with a shorter latency in PFC and only later in ITC, suggesting this effect may be due to feedback from PFC or another area. Indeed, previous studies have reported top-down feedback from PFC into monkey ITC (Tomita et al., 1999). Likewise, several human EEG studies have provided evidence for re-entrant signals, possibly originating from frontal or parietal sources following conscious detection of objects (Del Cul et al., 2007; Fahrenfort et al., 2007). One possibility not explored in the current study is the involvement of parietal cortex in the categorization process or these task modulations. Recent work has demonstrated that category signals during a direction categorization task emerge earlier in lateral intraparietal area (LIP) than PFC (Swaminathan and Freedman, 2012), and LIP shows a category-like encoding of learned stimulus associations during a shape–pair association task (Fitzgerald et al., 2011). Thus, an important avenue for future work is to compare the roles of parietal, temporal, and frontal lobes in categorization and other complex visually guided behaviors.
Footnotes
This work was supported by the National Institute of Mental Health (5R01MH065252-12), a McKnight Scholar award (D.J.F.), the Alfred P. Sloan Foundation (D.J.F.), and a Natural Sciences and Engineering Research Council of Canada fellowship (J.L.M.).
The authors declare no competing financial interests.
References
- Anderson B, Mruczek RE, Kawasaki K, Sheinberg D. Effects of familiarity on neural activity in monkey inferior temporal lobe. Cereb Cortex. 2008;18:2540–2552. doi: 10.1093/cercor/bhn015. [DOI] [PMC free article] [PubMed] [Google Scholar]
- Baker CI, Behrmann M, Olson CR. Impact of learning on representation of parts and wholes in monkey inferotemporal cortex. Nat Neurosci. 2002;5:1210–1216. doi: 10.1038/nn960. [DOI] [PubMed] [Google Scholar]
- Blum JS, Chow KL, Pribram KH. A behavioral analysis of the organization of the parieto-temporo-preoccipital cortex. J Comp Neurol. 1950;93:53–100. doi: 10.1002/cne.900930105. [DOI] [PubMed] [Google Scholar]
- Booth MC, Rolls ET. View-invariant representations of familiar objects by neurons in the inferior temporal visual cortex. Cereb Cortex. 1998;8:510–523. doi: 10.1093/cercor/8.6.510. [DOI] [PubMed] [Google Scholar]
- Brincat SL, Connor CE. Underlying principles of visual shape selectivity in posterior inferotemporal cortex. Nat Neurosci. 2004;7:880–886. doi: 10.1038/nn1278. [DOI] [PubMed] [Google Scholar]
- Bruce C, Desimone R, Gross CG. Visual properties of neurons in a polysensory area in superior temporal sulcus of the macaque. J Neurophysiol. 1981;46:369–384. doi: 10.1152/jn.1981.46.2.369. [DOI] [PubMed] [Google Scholar]
- Chen Y, Davis MH, Pulvermüller F, Hauk O. Task modulation of brain responses in visual word recognition as studied using EEG/MEG and fMRI. Front Hum Neurosci. 2013;7:376. doi: 10.3389/fnhum.2013.00376. [DOI] [PMC free article] [PubMed] [Google Scholar]
- De Baene W, Ons B, Wagemans J, Vogels R. Effects of category learning on the stimulus selectivity of macaque inferior temporal neurons. Learn Mem. 2008;15:717–727. doi: 10.1101/lm.1040508. [DOI] [PubMed] [Google Scholar]
- Del Cul A, Baillet S, Dehaene S. Brain dynamics underlying the nonlinear threshold for access to consciousness. PLoS Biol. 2007;5:e260. doi: 10.1371/journal.pbio.0050260. [DOI] [PMC free article] [PubMed] [Google Scholar]
- Desimone R, Albright TD, Gross CG, Bruce C. Stimulus-selective properties of inferior temporal neurons in the macaque. J Neurosci. 1984;4:2051–2062. doi: 10.1523/JNEUROSCI.04-08-02051.1984. [DOI] [PMC free article] [PubMed] [Google Scholar]
- Dunbar K, Sussman D. Toward a cognitive account of frontal lobe function: simulating frontal lobe deficits in normal subjects. Ann N Y Acad Sci. 1995;769:289–304. doi: 10.1111/j.1749-6632.1995.tb38146.x. [DOI] [PubMed] [Google Scholar]
- Emadi N, Esteky H. Behavioral demand modulates object category representation in the inferior temporal cortex. J Neurophysiol. 2014;pii doi: 10.1152/jn.00761.2013. jn.00761.2013. [DOI] [PMC free article] [PubMed] [Google Scholar]
- Fahrenfort JJ, Scholte HS, Lamme VA. Masking disrupts reentrant processing in human visual cortex. J Cogn Neurosci. 2007;19:1488–1497. doi: 10.1162/jocn.2007.19.9.1488. [DOI] [PubMed] [Google Scholar]
- Fitzgerald JK, Freedman DJ, Assad JA. Generalized associative representations in parietal cortex. Nat Neurosci. 2011;14:1075–1079. doi: 10.1038/nn.2878. [DOI] [PMC free article] [PubMed] [Google Scholar]
- Freedman DJ, Assad JA. Experience-dependent representation of visual categories in parietal cortex. Nature. 2006;443:85–88. doi: 10.1038/nature05078. [DOI] [PubMed] [Google Scholar]
- Freedman DJ, Riesenhuber M, Poggio T, Miller EK. Categorical representation of visual stimuli in the primate prefrontal cortex. Science. 2001;291:312–316. doi: 10.1126/science.291.5502.312. [DOI] [PubMed] [Google Scholar]
- Freedman DJ, Riesenhuber M, Poggio T, Miller EK. Visual categorization and the primate prefrontal cortex: neurophysiology and behavior. J Neurophysiol. 2002;88:929–941. doi: 10.1152/jn.2002.88.2.929. [DOI] [PubMed] [Google Scholar]
- Freedman DJ, Riesenhuber M, Poggio T, Miller EK. A comparison of primate prefrontal and inferior temporal cortices during visual categorization. J Neurosci. 2003;23:5235–5246. doi: 10.1523/JNEUROSCI.23-12-05235.2003. [DOI] [PMC free article] [PubMed] [Google Scholar]
- Freedman DJ, Riesenhuber M, Poggio T, Miller EK. Experience-dependent sharpening of visual shape selectivity in inferior temporal cortex. Cereb Cortex. 2006;16:1631–1644. doi: 10.1093/cercor/bhj100. [DOI] [PubMed] [Google Scholar]
- Ghose GM, Yang T, Maunsell JH. Physiological correlates of perceptual learning in monkey V1 and V2. J Neurophysiol. 2002;87:1867–1888. doi: 10.1152/jn.00690.2001. [DOI] [PubMed] [Google Scholar]
- Goodwin SJ, Blackman RK, Sakellaridi S, Chafee MV. Executive control over cognition: stronger and earlier rule-based modulation of spatial category signals in prefrontal cortex relative to parietal cortex. J Neurosci. 2012;32:3499–3515. doi: 10.1523/JNEUROSCI.3585-11.2012. [DOI] [PMC free article] [PubMed] [Google Scholar]
- Gross CG, Rocha-Miranda CE, Bender DB. Visual properties of neurons in inferotemporal cortex of the macaque. J Neurophysiol. 1972;35:96–111. doi: 10.1152/jn.1972.35.1.96. [DOI] [PubMed] [Google Scholar]
- Harel A, Kravitz DJ, Baker CI. Task context impacts visual object processing differentially across the cortex. Proc Natl Acad Sci U S A. 2014;111:E962–E971. doi: 10.1073/pnas.1312567111. [DOI] [PMC free article] [PubMed] [Google Scholar]
- Hung CP, Kreiman G, Poggio T, DiCarlo JJ. Fast readout of object identity from macaque inferior temporal cortex. Science. 2005;310:863–866. doi: 10.1126/science.1117593. [DOI] [PubMed] [Google Scholar]
- Jiang X, Bradley E, Rini RA, Zeffiro T, Vanmeter J, Riesenhuber M. Categorization training results in shape- and category-selective human neural plasticity. Neuron. 2007;53:891–903. doi: 10.1016/j.neuron.2007.02.015. [DOI] [PMC free article] [PubMed] [Google Scholar]
- Kiani R, Esteky H, Mirpour K, Tanaka K. Object category structure in response patterns of neuronal population in monkey inferior temporal cortex. J Neurophysiol. 2007;97:4296–4309. doi: 10.1152/jn.00024.2007. [DOI] [PubMed] [Google Scholar]
- Kluver H, Bucy L. An analysis of certain effects of bilateral temporal lobectomy in the rhesus monkey, with special reference to “psychic blindness.”. J Psychol. 1938;5:33–54. doi: 10.1080/00223980.1938.9917551. [DOI] [Google Scholar]
- Kluver H, Bucy L. Preliminary analysis of functions of the temporal lobes in monkeys. Arch Neur Psych. 1939;42:979–1000. doi: 10.1001/archneurpsyc.1939.02270240017001. [DOI] [PubMed] [Google Scholar]
- Kobatake E, Wang G, Tanaka K. Effects of shape-discrimination training on the selectivity of inferotemporal cells in adult monkeys. J Neurophysiol. 1998;80:324–330. doi: 10.1152/jn.1998.80.1.324. [DOI] [PubMed] [Google Scholar]
- Koida K, Komatsu H. Effects of task demands on the responses of color-selective neurons in the inferior temporal cortex. Nat Neurosci. 2007;10:108–116. doi: 10.1038/nn1823. [DOI] [PubMed] [Google Scholar]
- Li N, DiCarlo JJ. Unsupervised natural experience rapidly alters invariant object representation in visual cortex. Science. 2008;321:1502–1507. doi: 10.1126/science.1160028. [DOI] [PMC free article] [PubMed] [Google Scholar]
- Li N, DiCarlo JJ. Unsupervised natural visual experience rapidly reshapes size-invariant object representation in inferior temporal cortex. Neuron. 2010;67:1062–1075. doi: 10.1016/j.neuron.2010.08.029. [DOI] [PMC free article] [PubMed] [Google Scholar]
- Li N, DiCarlo JJ. Neuronal learning of invariant object representation in the ventral visual stream is not dependent on reward. J Neurosci. 2012;32:6611–6620. doi: 10.1523/JNEUROSCI.3786-11.2012. [DOI] [PMC free article] [PubMed] [Google Scholar]
- Logothetis NK, Sheinberg DL. Visual object recognition. Ann Rev Neurosci. 1996;19:577–621. doi: 10.1146/annurev.ne.19.030196.003045. [DOI] [PubMed] [Google Scholar]
- Logothetis NK, Pauls J, Poggio T. Shape representation in the inferior temporal cortex of monkeys. Curr Biol. 1995;5:552–563. doi: 10.1016/S0960-9822(95)00108-4. [DOI] [PubMed] [Google Scholar]
- Meyers EM, Freedman DJ, Kreiman G, Miller EK, Poggio T. Dynamic population coding of category information in inferior temporal and prefrontal cortex. J Neurophysiol. 2008;100:1407–1419. doi: 10.1152/jn.90248.2008. [DOI] [PMC free article] [PubMed] [Google Scholar]
- Meyers EM, Qi XL, Constantinidis C. Incorporation of new information into prefrontal cortical activity after learning working memory tasks. Proc Natl Acad Sci U S A. 2012;109:4651–4656. doi: 10.1073/pnas.1201022109. [DOI] [PMC free article] [PubMed] [Google Scholar]
- Miller EK, Cohen JD. An integrative theory of prefrontal cortex function. Annu Rev Neurosci. 2001;24:167–202. doi: 10.1146/annurev.neuro.24.1.167. [DOI] [PubMed] [Google Scholar]
- Miller EK, Freedman DJ, Wallis JD. The prefrontal cortex: categories, concepts and cognition. Philos Trans R Soc Lond B Biol Sci. 2002;357:1123–1136. doi: 10.1098/rstb.2002.1099. [DOI] [PMC free article] [PubMed] [Google Scholar]
- Miller EK, Nieder A, Freedman DJ, Wallis JD. Neural correlates of categories and concepts. Curr Opin Neurobiol. 2003;13:198–203. doi: 10.1016/S0959-4388(03)00037-0. [DOI] [PubMed] [Google Scholar]
- Milner B. Effects of different brain lesions on card sorting. Arch Neurol. 1963;9:90. [Google Scholar]
- Mishkin M, Pribram KH. Visual discrimination performance following partial ablations of the temporal lobe. I. Ventral vs. lateral. J Comp Physiol Psychol. 1954;47:187–193. doi: 10.1037/h0057551. [DOI] [PubMed] [Google Scholar]
- Miyashita Y. Neuronal correlate of visual associative long-term memory in the primate temporal cortex. Nature. 1988;335:817–820. doi: 10.1038/335817a0. [DOI] [PubMed] [Google Scholar]
- Op de Beeck HP, Baker CI, DiCarlo JJ, Kanwisher NG. Discrimination training alters object representations in human extrastriate cortex. J Neurosci. 2006;26:13025–13036. doi: 10.1523/JNEUROSCI.2481-06.2006. [DOI] [PMC free article] [PubMed] [Google Scholar]
- Paxinos G, Huang XF, Toga AW. The rhesus monkey brain in stereotaxic coordinates. San Diego: Academic; 2000. [Google Scholar]
- Perret E. The left frontal lobe of man and the suppression of habitual responses in verbal categorical behaviour. Neuropsychologia. 1974;12:323–330. doi: 10.1016/0028-3932(74)90047-5. [DOI] [PubMed] [Google Scholar]
- Perrett DI, Rolls ET, Caan W. Visual neurones responsive to faces in the monkey temporal cortex. Exp Brain Res. 1982;47:329–342. doi: 10.1007/BF00239352. [DOI] [PubMed] [Google Scholar]
- Ranganath C, DeGutis J, D'Esposito M. Category-specific modulation of inferior temporal activity during working memory encoding and maintenance. Brain Res Cogn Brain Res. 2004;20:37–45. doi: 10.1016/j.cogbrainres.2003.11.017. [DOI] [PubMed] [Google Scholar]
- Riesenhuber M, Poggio T. Hierarchical models of object recognition in cortex. Nat Neurosci. 1999;2:1019–1025. doi: 10.1038/14819. [DOI] [PubMed] [Google Scholar]
- Rossi AF, Bichot NP, Desimone R, Ungerleider LG. Top down attentional deficits in macaques with lesions of lateral prefrontal cortex. J Neurosci. 2007;27:11306–11314. doi: 10.1523/JNEUROSCI.2939-07.2007. [DOI] [PMC free article] [PubMed] [Google Scholar]
- Sakai K, Miyashita Y. Neural organization for the long-term memory of paired associates. Nature. 1991;354:152–155. doi: 10.1038/354152a0. [DOI] [PubMed] [Google Scholar]
- Sheinberg DL, Logothetis NK. Noticing familiar objects in real world scenes: the role of temporal cortical neurons in natural vision. J Neurosci. 2001;21:1340–1350. doi: 10.1523/JNEUROSCI.21-04-01340.2001. [DOI] [PMC free article] [PubMed] [Google Scholar]
- Shelton C. Morphable surface models. Int J Comput Vis. 2000;38:75–91. doi: 10.1023/A:1008170818506. [DOI] [Google Scholar]
- Sigala N, Logothetis NK. Visual categorization shapes feature selectivity in the primate temporal cortex. Nature. 2002;415:318–320. doi: 10.1038/415318a. [DOI] [PubMed] [Google Scholar]
- Suzuki W, Matsumoto K, Tanaka K. Neuronal responses to object images in the macaque inferotemporal cortex at different stimulus discrimination levels. J Neurosci. 2006;26:10524–10535. doi: 10.1523/JNEUROSCI.1532-06.2006. [DOI] [PMC free article] [PubMed] [Google Scholar]
- Swaminathan SK, Freedman DJ. Preferential encoding of visual categories in parietal cortex compared with prefrontal cortex. Nat Neurosci. 2012;15:315–320. doi: 10.1038/nn.3016. [DOI] [PMC free article] [PubMed] [Google Scholar]
- Tanaka K. Inferotemporal cortex and object vision. Annu Rev Neurosci. 1996;19:109–139. doi: 10.1146/annurev.ne.19.030196.000545. [DOI] [PubMed] [Google Scholar]
- Tomita H, Ohbayashi M, Nakahara K, Hasegawa I, Miyashita Y. Top-down signal from prefrontal cortex in executive control of memory retrieval. Nature. 1999;401:699–703. doi: 10.1038/44372. [DOI] [PubMed] [Google Scholar]
- Tsao DY, Freiwald WA, Tootell RB, Livingstone MS. A cortical region consisting entirely of face-selective cells. Science. 2006;311:670–674. doi: 10.1126/science.1119983. [DOI] [PMC free article] [PubMed] [Google Scholar]
- Vendrell P, Junqué C, Pujol J, Jurado MA, Molet J, Grafman J. The role of prefrontal regions in the Stroop task. Neuropsychologia. 1995;33:341–352. doi: 10.1016/0028-3932(94)00116-7. [DOI] [PubMed] [Google Scholar]
- Vogels R. Categorization of complex visual images by rhesus monkeys. Part 2: single-cell study. Eur J Neurosci. 1999;11:1239–1255. doi: 10.1046/j.1460-9568.1999.00531.x. [DOI] [PubMed] [Google Scholar]
- Vogels R, Sáry G, Orban GA. How task-related are the responses of inferior temporal neurons? Vis Neurosci. 2009;12:207. doi: 10.1017/s0952523800007884. [DOI] [PubMed] [Google Scholar]
- Wallis JD. Neuronal mechanisms in prefrontal cortex underlying adaptive choice behavior. Ann N Y Acad Sci. 2007;1121:447–460. doi: 10.1196/annals.1401.009. [DOI] [PubMed] [Google Scholar]
- Wallis JD, Miller EK. Neuronal activity in primate dorsolateral and orbital prefrontal cortex during performance of a reward preference task. Eur J Neurosci. 2003;18:2069–2081. doi: 10.1046/j.1460-9568.2003.02922.x. [DOI] [PubMed] [Google Scholar]
- Wallis JD, Anderson KC, Miller EK. Single neurons in prefrontal cortex encode abstract rules. Nature. 2001;411:953–956. doi: 10.1038/35082081. [DOI] [PubMed] [Google Scholar]
- Woloszyn L, Sheinberg DL. Effects of long-term visual experience on responses of distinct classes of single units in inferior temporal cortex. Neuron. 2012;74:193–205. doi: 10.1016/j.neuron.2012.01.032. [DOI] [PMC free article] [PubMed] [Google Scholar]